Original Link: https://www.anandtech.com/show/13391/the-kingston-hyperx-fury-rgb-ssd-review
The Kingston HyperX Fury RGB SSD Review: Bright Idea, Dimmed Performance
by Billy Tallis on September 24, 2018 8:35 AM EST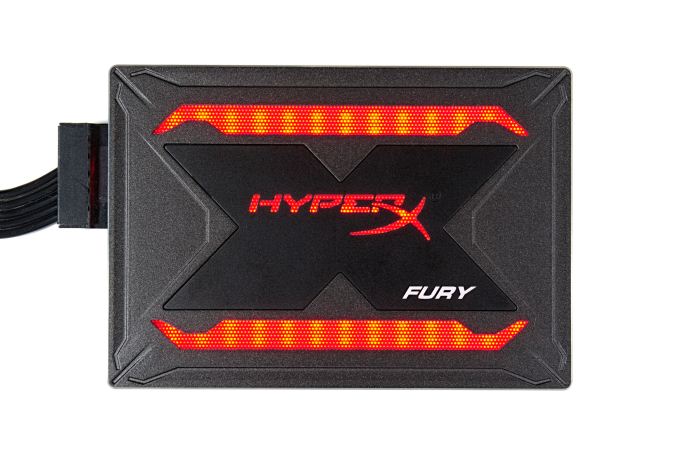
No component in a gaming desktop PC is safe from the RGB LED lighting trend. SSDs with LED lighting have existed as a tiny niche for years, but now that motherboards are integrating lighting controllers, that product segment is expanding significantly. Kingston's HyperX gaming brand is introducing the Fury RGB SSD to capitalize on the seemingly unstoppable (and oddly lucrative) trend.
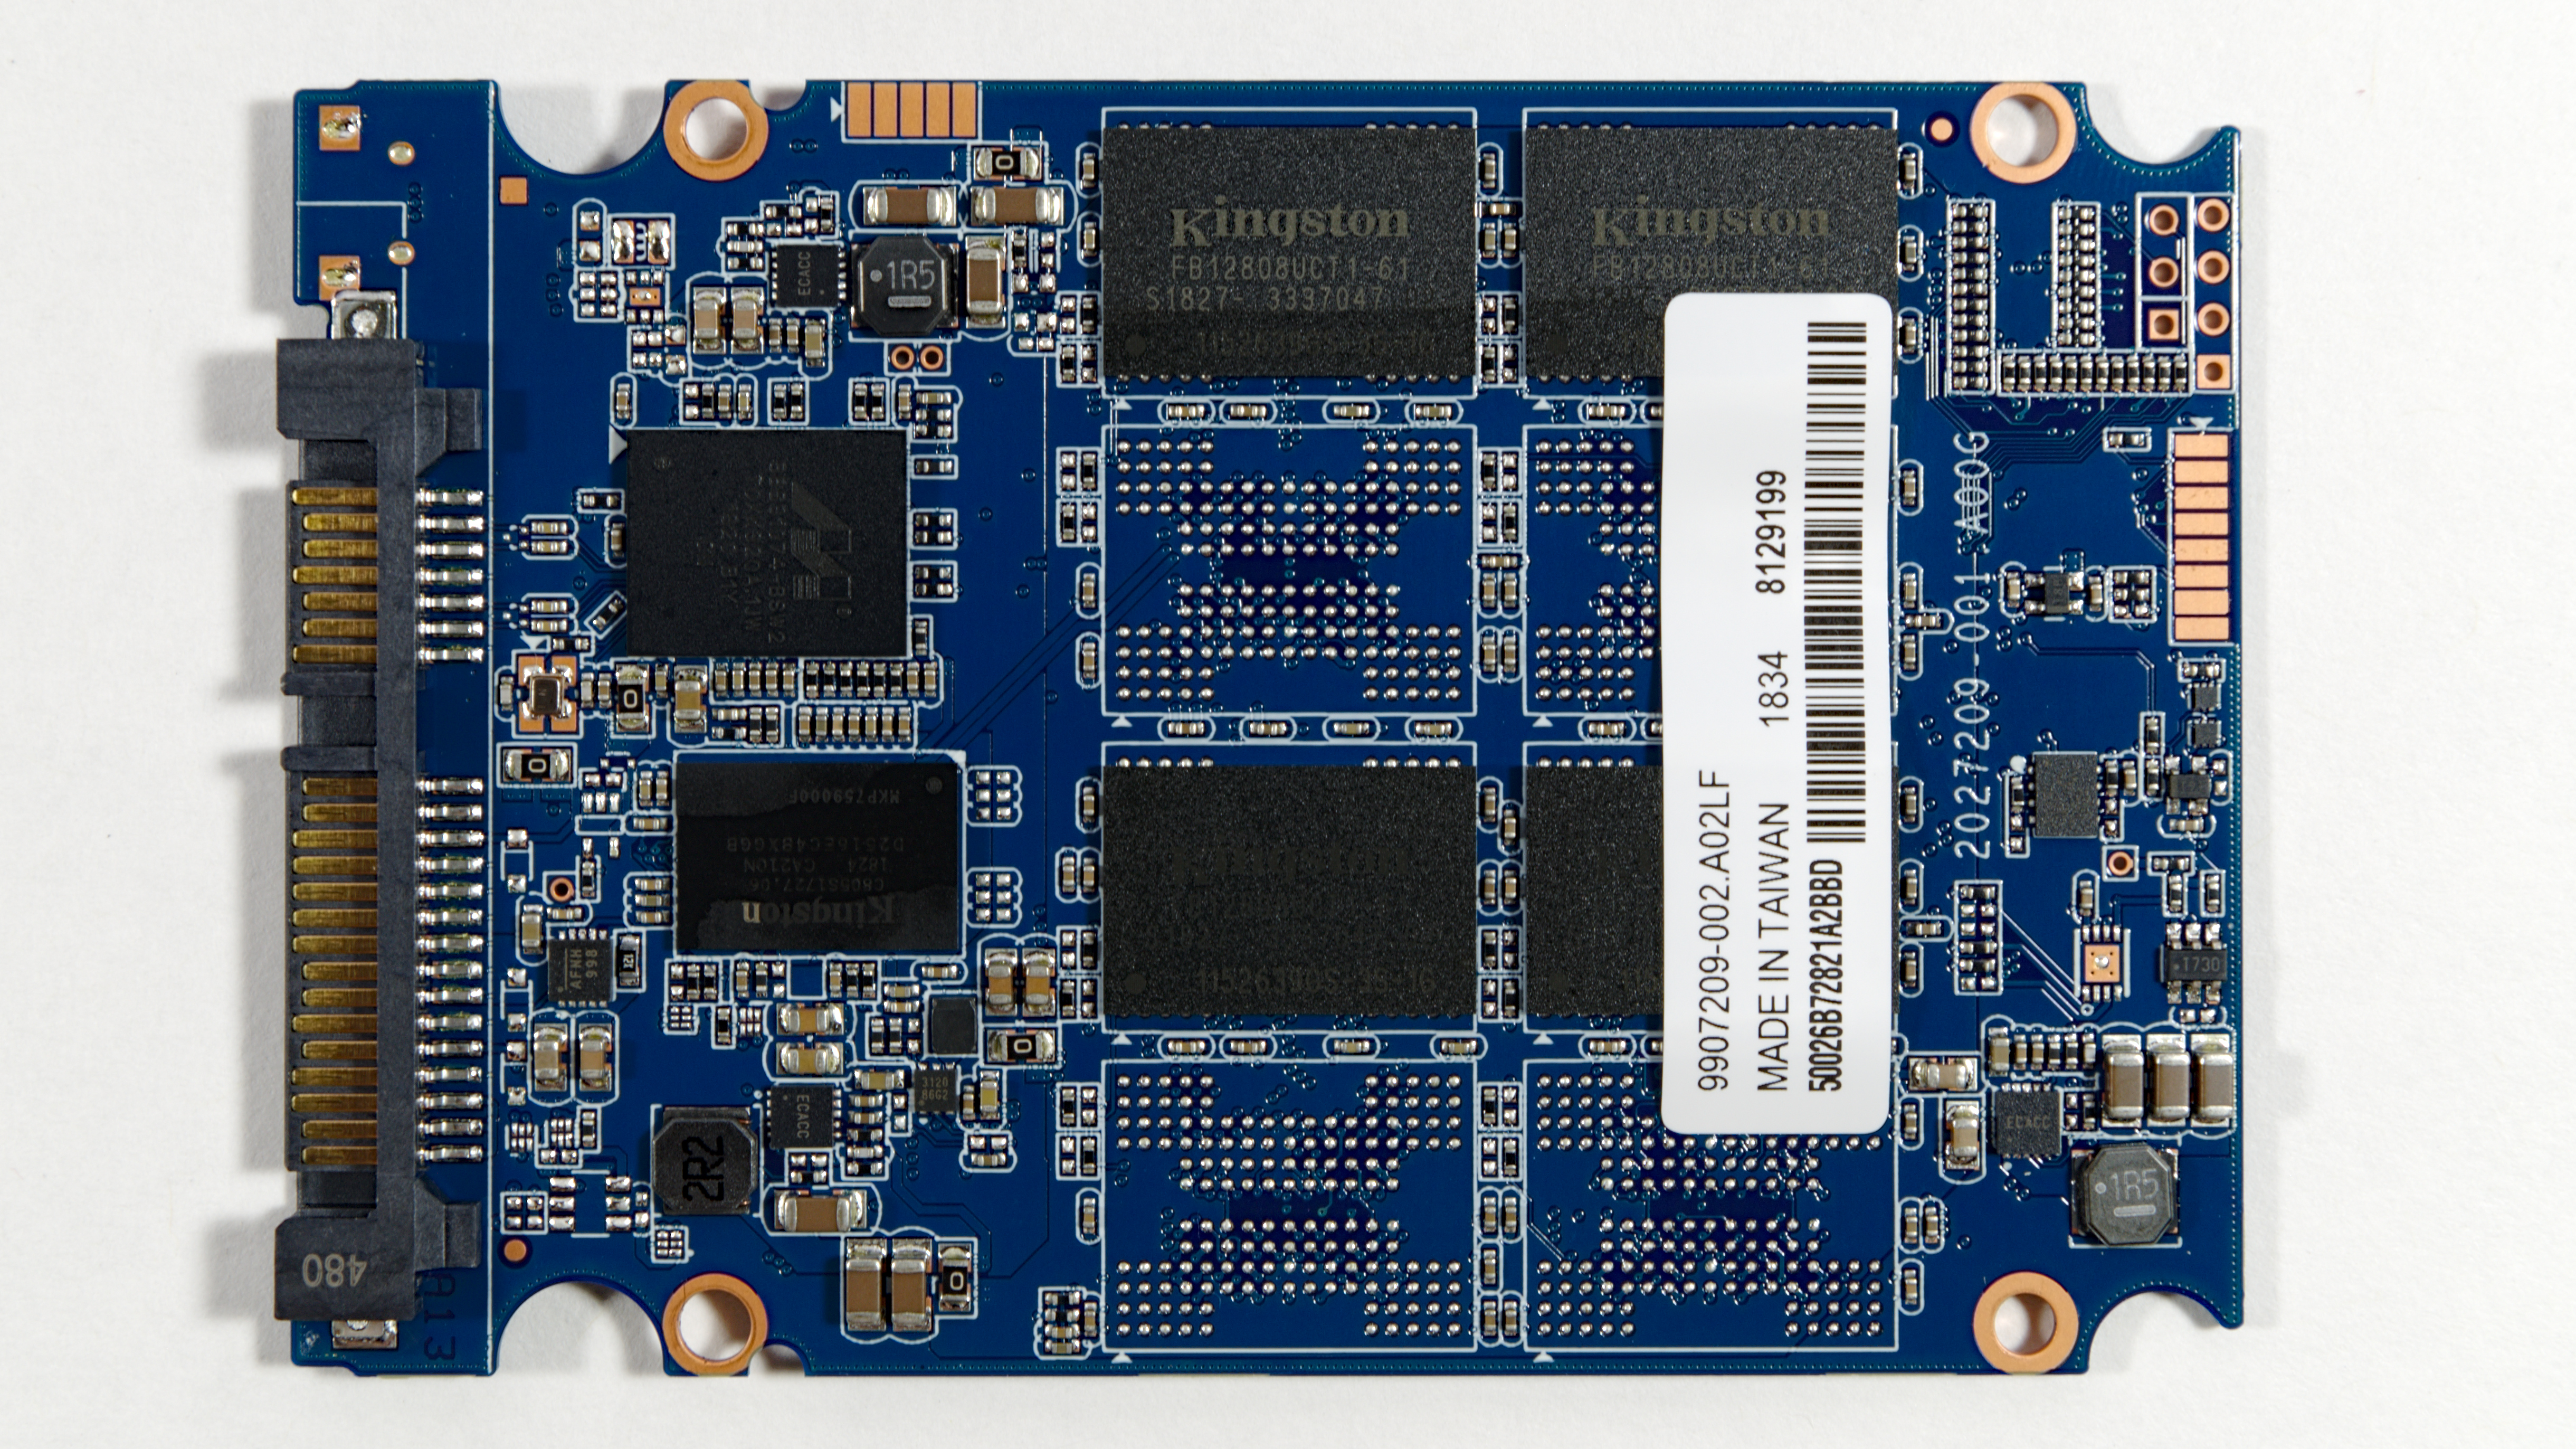
The original HyperX Fury SSD was released back in 2014 and used a SandForce controller combined with 20nm planar MLC NAND. This new HyperX Fury RGB SSD has almost nothing in common with that older drive on the inside, though the non-LED parts of the visual styling are quite similar. The Fury RGB uses current-generation Toshiba/SanDisk 64-layer 3D TLC NAND and Marvell's 88SS1074 controller.
The lighting on the Fury RGB is controllable through a connector next to the SATA power and data connectors. Kingston used a USB micro-B connector here, but it's not electrically compatible with USB. Instead, the adapter cable included with the drive must be used to connect to a 4-pin 12V RGB header on the motherboard or other lighting controller. This allows the color of the lighting to be adjusted as a group; individual control of the LEDs is not possible. Alternatively, if the LED cable is not connected, the drive will default to illuminating the red LEDs using the 12V supply on the SATA power connector while the rest of the device uses the 5V supply like a normal SATA SSD. The LEDs can also be powered and controlled solely through the LED cable even when the SATA power connector is not supplying any power.
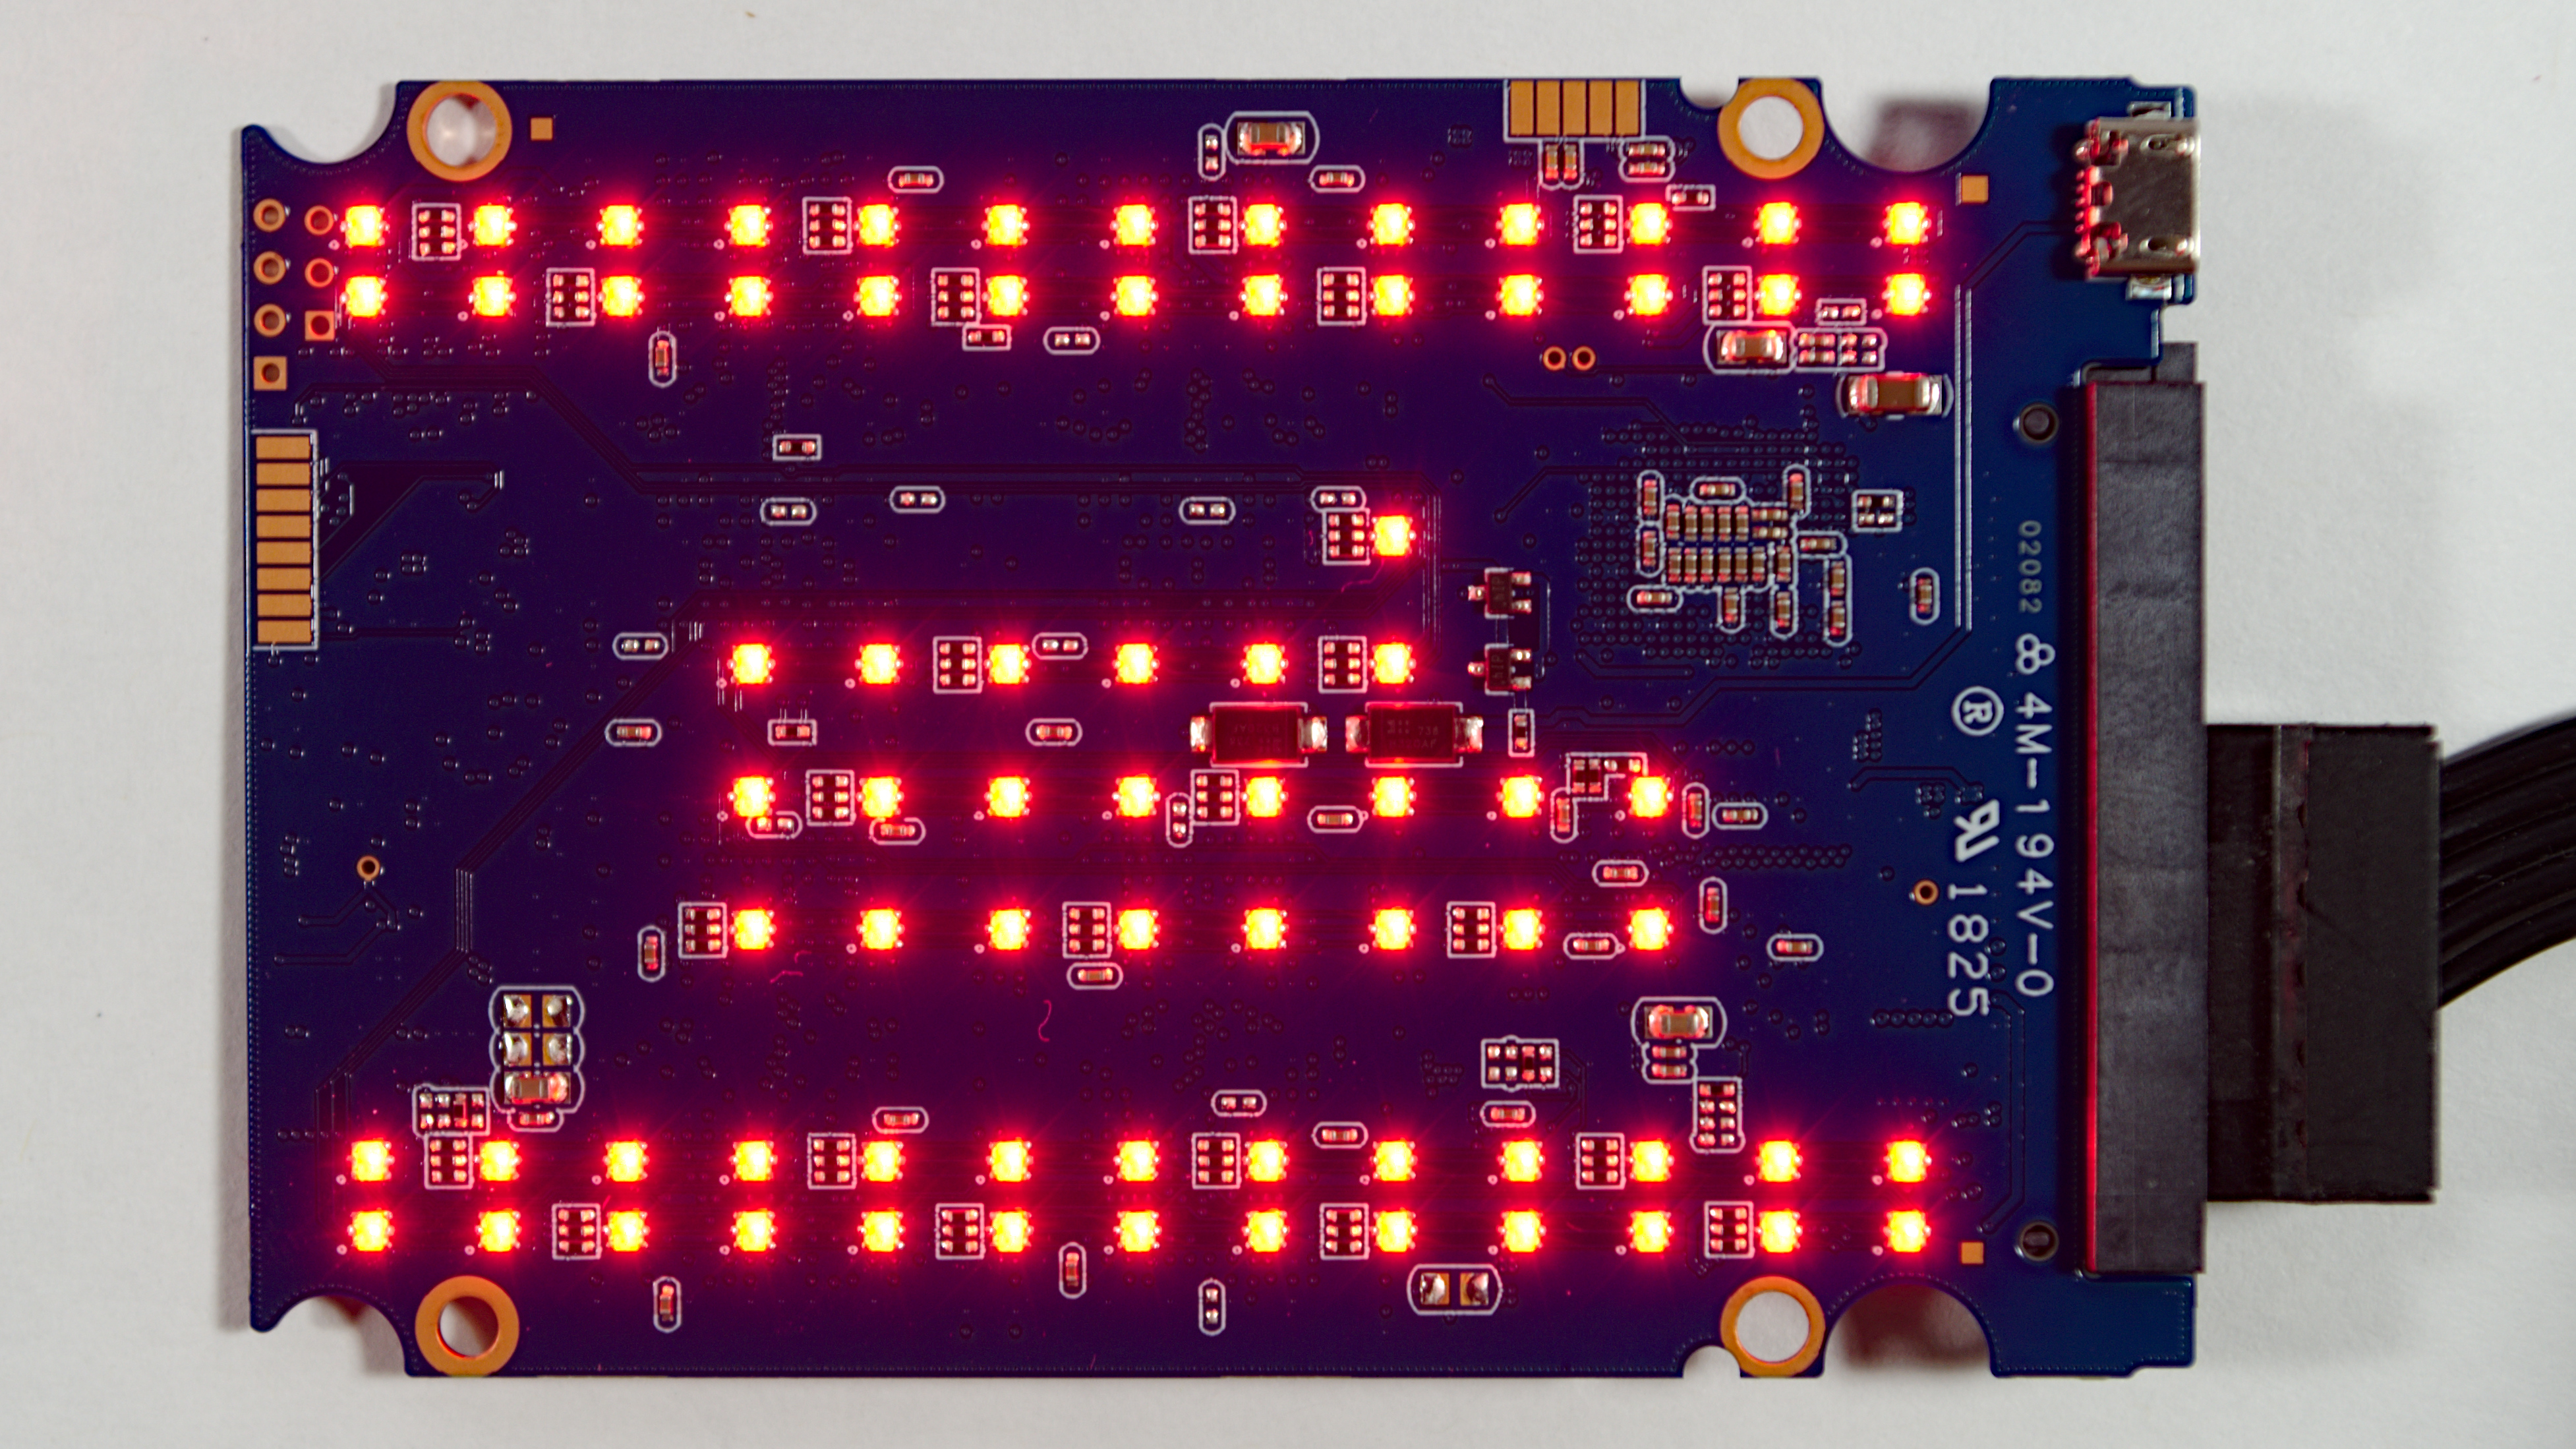


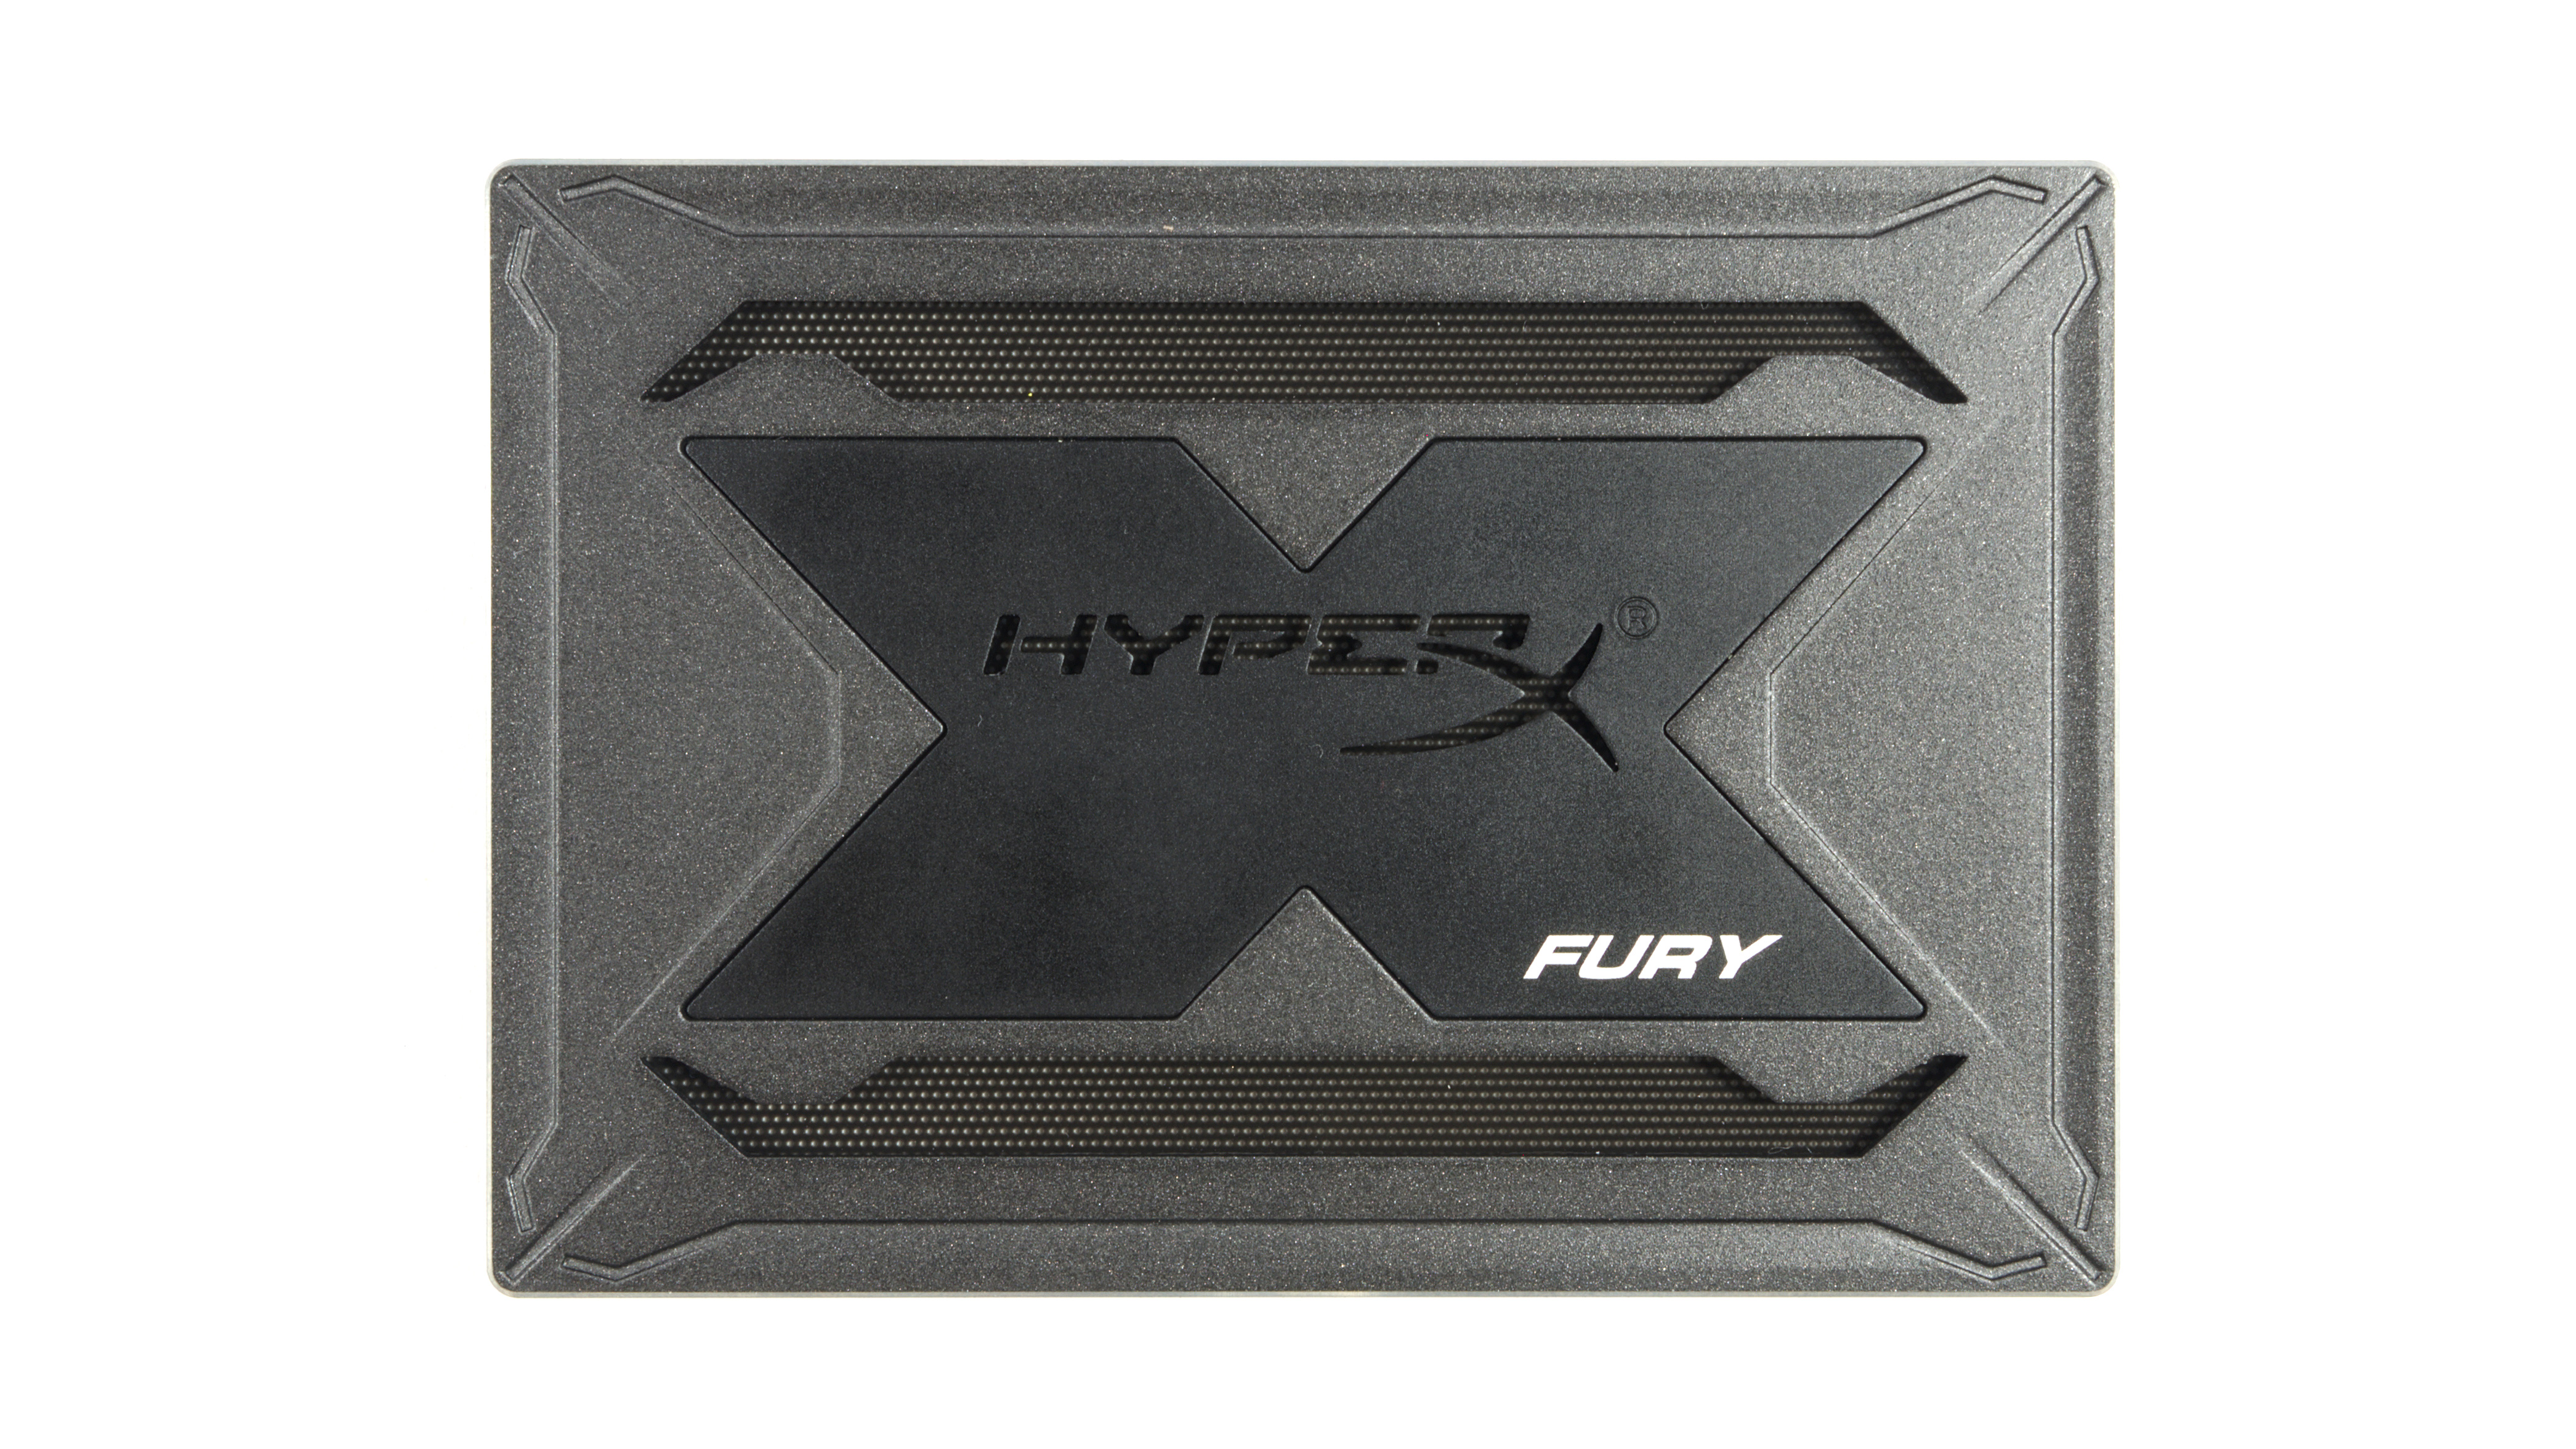
The HyperX Fury uses a staggering 75 RGB LED modules internally, mounted on the same PCB as the storage-related components. The LEDs are distributed to provide thorough coverage of the backlit HyperX logo and the edge highlights. The light shines through a thin sheet of white plastic that acts as a diffuser, and the through a perforated sheet of metal that adds some texture to the lighting effect. Those two layers also block a lot of light, which is probably why the Fury RGB needs so many LEDs. The lighting forces the HyperX Fury RGB to be slightly thicker than most SATA SSDs at 9.5mm instead of 7mm.
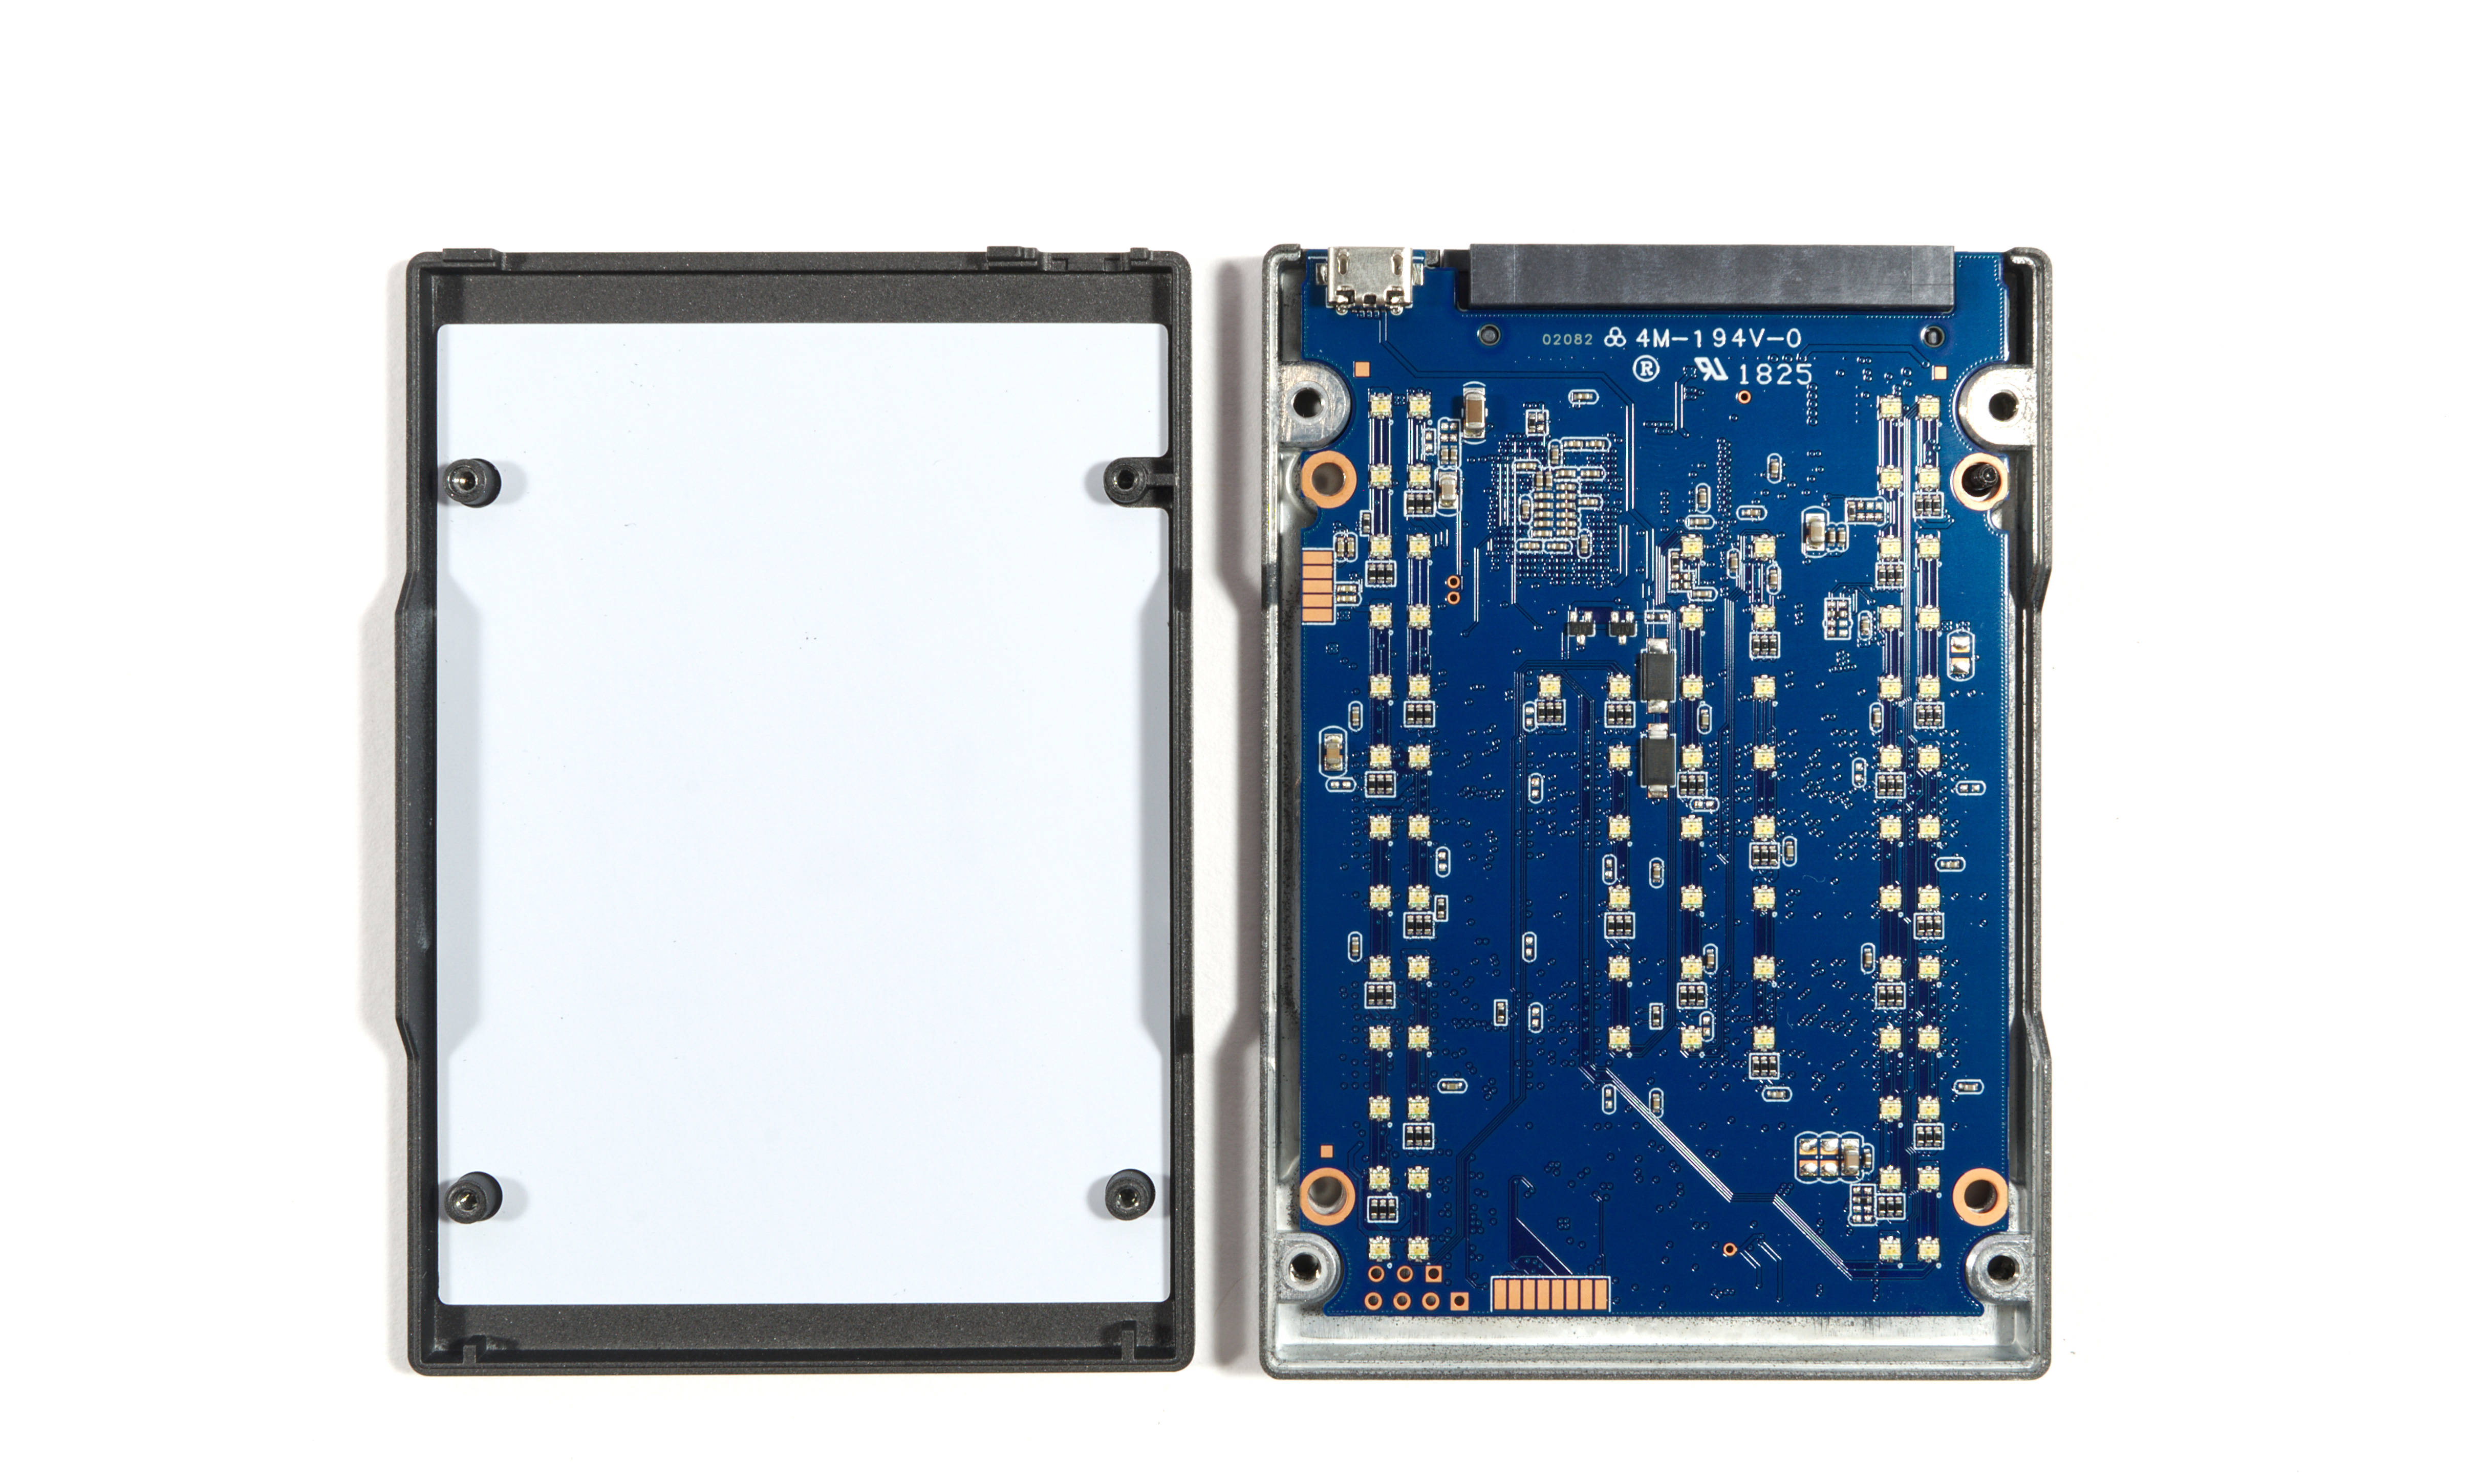
Left: Diffuser. Right: 75 RGB LEDs
| Kingston HyperX Fury RGB SSD Comparison | |||||
| Capacity | 240 GB | 480 GB | 960 GB | ||
| Form Factor | 2.5" 9.5mm SATA | ||||
| Controller | Marvell 88SS1074 | ||||
| NAND Flash | Toshiba/SanDisk BiCS3 64-layer 3D TLC | ||||
| Sequential Read | 550 MB/s | ||||
| Sequential Write | 480 MB/s | ||||
| Random Read | unspecified | ||||
| Random Write | unspecified | ||||
| Power (LEDs off?) |
Read | 1.2 W | |||
| Write | 2.5 W | ||||
| Idle | 200 mW | ||||
| Warranty | 3 years | ||||
| Write Endurance | 120 TB 0.46 DWPD |
240 TB 0.46 DWPD |
480 TB 0.46 DWPD |
||
| MSRP | $74.99 (31¢/GB) |
$124.99 (26¢/GB) |
$219.99 (23¢/GB) |
||
On the storage side of the PCB, we find typical mainstream SATA SSD components. Kingston only provides sequential I/O performance specifications which indicate SATA-saturating peak performance, but they are not saying anything about how performance scales with capacity, nor how things behave when the SLC write cache fills up. The power draw ratings seem to be based on the drive operating with the LEDs off and peak write power of 2.5 W is reasonable for a drive using modern, low-power 3D NAND. The HyperX Fury RGB is warranted for a write endurance of 0.46 DWPD over three years, equivalent to a bit less than 0.3 DWPD if it had the 5-year warranty duration that mainstream SATA drives usually come with.
The MSRPs for the Fury RGB reflect a fairly steep price premium for the RGB lighting. The Fury RGB will hit the market with pricing more typical of an entry or mid-level NVMe SSD than a SATA SSD with only a 3-year warranty. Kingston's own A1000 low-end NVMe SSD is currently selling for well below the MSRPs of the HyperX Fury RGB, so the Fury RGB is clearly only for enthusiasts who are willing to sacrifice performance and pay a premium to get the aesthetics they want from their SSD.
It's been a while since we received a SATA drive using the Marvell 88SS1074 controller; most of the SATA drives we've been seeing lately have used either Silicon Motion or Phison controllers. The turnkey solutions offered by those two vendors seem to be a lot more popular with the smaller SSD brands than Marvell's offerings. Some of the biggest brands have also been lured away from Marvell, most notably the Crucial M/MX series that switched to Silicon Motion's SM2258 after using Marvell controllers for all their previous high-end 6Gbps SATA SSDs. Western Digital still uses the 88SS1074 controller in their WD Blue SSDs, but they switched from Marvell to an in-house controller for the 3D NAND update to their WD Black SSD.
The Toshiba/SanDisk BiCS3 64-layer 3D TLC NAND flash used in the HyperX Fury RGB is a much more common sight on our SSD testbed this year, both in NVMe and SATA SSDs. Virtually all drives using Phison controllers are using Toshiba NAND, and this includes Toshiba's own TR200 SATA SSD with the DRAMless Phison S11 controller. The Plextor M8V is a more mainstream drive, pairing the same NAND with the SM2258 controller. The M8V has been scarce at retailers but its OEM counterpart (Liteon CV8) has been used by major OEMs like Dell.
It's hard to decide which drives are the best to compare the Fury RGB against, since most of our SSDs don't have LED lighting. Ignoring the lighting aspect, the drives that are most technologically similar are the Toshiba TR200 and Plextor M8V, SATA drives with the same NAND and different controllers. The Crucial MX500 and Intel 545s are mainstream SATA drives with Intel/Micron 64-layer TLC.
The price premium that the LED lighting brings to the Fury RGB brings it up to the level of some of the cheaper NVMe SSDs. Kingston's own A1000 is an entry-level NVMe SSD using the Phison E8 controlller, and it is substantially cheaper than the Fury RGB's MSRPs. Meanwhile the ADATA XPG SX8200 uses the much higher-performing combination of Micron 64L 3D TLC and the SM2262 controller and costs about the same as the Fury RGB.
For this review, two sets of power measurements are reported for the Fury RGB: the total power draw across both 5V and 12V rails with the LEDs illuminated in their default red color, and the power on just the 5V rail. These two sets of measurements come from the same test runs, so there's only one set of performance numbers. At full brightness, the red LEDs draw about 2.24 W when powered by the SATA power connecter, and this is enough to keep the drive rather warm even when it is idle. With all three color channels illuminated, LED power consumption exceeds 4W but we did not leave it connected to the multimeter long enough for the drive to reach an equilibrium temperature and power draw. (I didn't want to burn out the breadboard I was using to wire things up.)
Our SSD coverage in recent months has been heavily focused on NVMe SSDs as the more active and exciting market segment. As a result, our post-Spectre/Meltdown re-testing of drives has included relatively few SATA SSDs. Most of our small and low-end SATA drives have not yet completed the longer AnandTech Storage Bench tests, so this review has fewer results for The Destroyer and the ATSB Heavy test than we typically include.
| AnandTech 2018 Consumer SSD Testbed | |
| CPU | Intel Xeon E3 1240 v5 |
| Motherboard | ASRock Fatal1ty E3V5 Performance Gaming/OC |
| Chipset | Intel C232 |
| Memory | 4x 8GB G.SKILL Ripjaws DDR4-2400 CL15 |
| Graphics | AMD Radeon HD 5450, 1920x1200@60Hz |
| Software | Windows 10 x64, version 1709 |
| Linux kernel version 4.14, fio version 3.6 | |
| Spectre/Meltdown microcode and OS patches current as of May 2018 | |
- Thanks to Intel for the Xeon E3 1240 v5 CPU
- Thanks to ASRock for the E3V5 Performance Gaming/OC
- Thanks to G.SKILL for the Ripjaws DDR4-2400 RAM
- Thanks to Corsair for the RM750 power supply, Carbide 200R case, and Hydro H60 CPU cooler
- Thanks to Quarch for the XLC Programmable Power Module and accessories
- Thanks to ICY DOCK for providing a custom ExpressCage MB324SP-B hot swap bay
- Thanks to StarTech for providing a RK2236BKF 22U rack cabinet.
AnandTech Storage Bench - The Destroyer
The Destroyer is an extremely long test replicating the access patterns of very IO-intensive desktop usage. A detailed breakdown can be found in this article. Like real-world usage, the drives do get the occasional break that allows for some background garbage collection and flushing caches, but those idle times are limited to 25ms so that it doesn't take all week to run the test. These AnandTech Storage Bench (ATSB) tests do not involve running the actual applications that generated the workloads, so the scores are relatively insensitive to changes in CPU performance and RAM from our new testbed, but the jump to a newer version of Windows and the newer storage drivers can have an impact.
We quantify performance on this test by reporting the drive's average data throughput, the average latency of the I/O operations, and the total energy used by the drive over the course of the test.
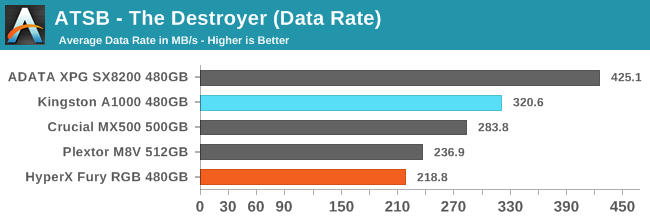
The HyperX Fury RGB's average data rate on The Destroyer is 23% slower than the Crucial MX500 and is also clearly slower than the Plextor M8V that uses the same Toshiba 64-layer 3D NAND. The Fury RGB is not delivering the performance expected from a mainstream SATA drive, let alone one with enthusiast pricing.
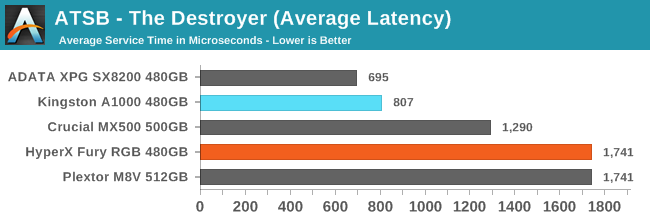
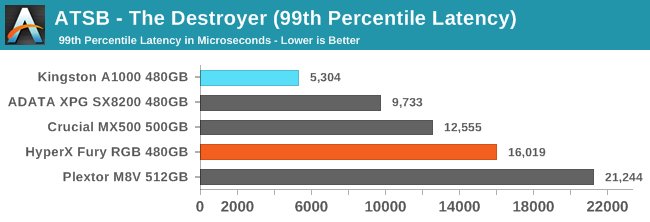
The average latency of the Fury RGB on The Destroyer is tied with the Plextor M8V and the 99th percentile latency is better, so Kingston has managed to get decent performance out of the Toshiba 3D TLC in at least some respects, but the Crucial drive is still clearly much better off.
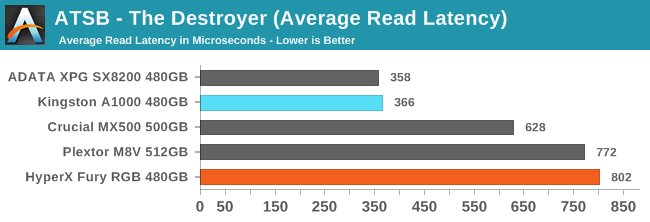
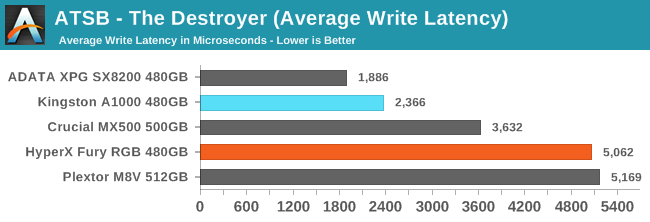
The average read latency of the Fury RGB is slightly worse than the Plextor M8V while the average write latency is slightly better, but neither drive can get the Toshiba TLC to match the performance of the Micron TLC in the Crucial MX500.
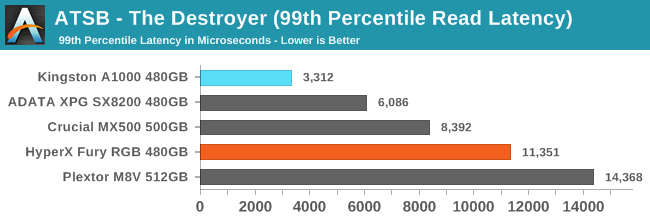
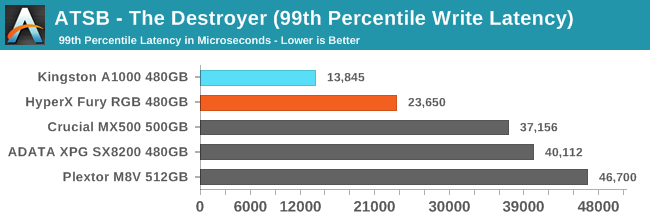
The 99th percentile read latency of the Fury RGB falls between the MX500 and the M8V and is nothing to complain about. The 99th percentile write latency surprises with a substantial advantage over the other SATA drives and even the ADATA SX8200, so Kingston's firmware for the Fury RGB is doing a good job at limiting worst-case performance stalls.
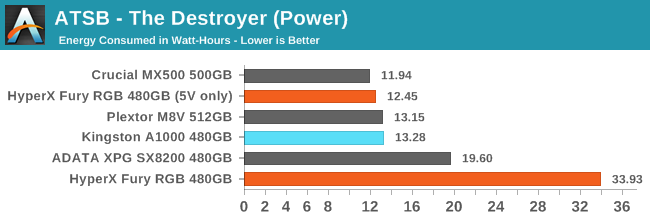
When ignoring the energy used for the LED lighting, the HyperX Fury RGB requires a similar amount of energy to complete The Destroyer as other SATA drives, despite taking a bit longer overall. The LEDs were responsible for almost 2/3 the total energy usage by the drive.
AnandTech Storage Bench - Heavy
Our Heavy storage benchmark is proportionally more write-heavy than The Destroyer, but much shorter overall. The total writes in the Heavy test aren't enough to fill the drive, so performance never drops down to steady state. This test is far more representative of a power user's day to day usage, and is heavily influenced by the drive's peak performance. The Heavy workload test details can be found here. This test is run twice, once on a freshly erased drive and once after filling the drive with sequential writes.
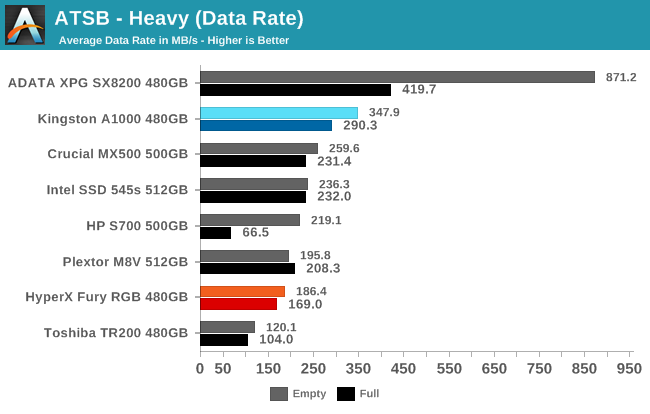
The average data rates of the HyperX Fury RGB on the Heavy test are clearly below the current standard for mainstream SATA drives and even a bit below the Plextor M8V that uses the same Toshiba 64-layer 3D TLC, but the Fury RGB does at least retain a significant lead over the DRAMless Toshiba TR200. The Fury RGB also shows a fairly small performance impact when the test is run on a full drive instead of a freshly erased drive.
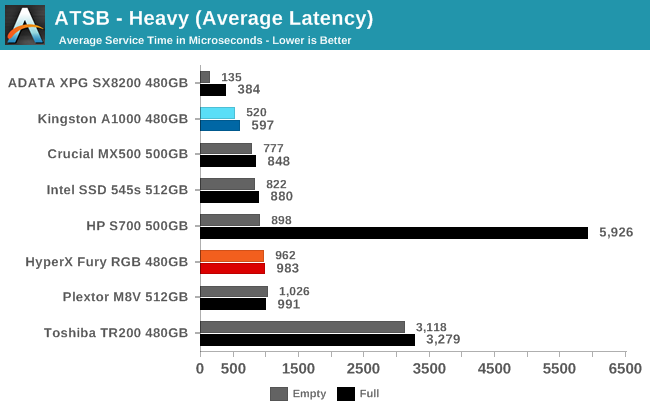
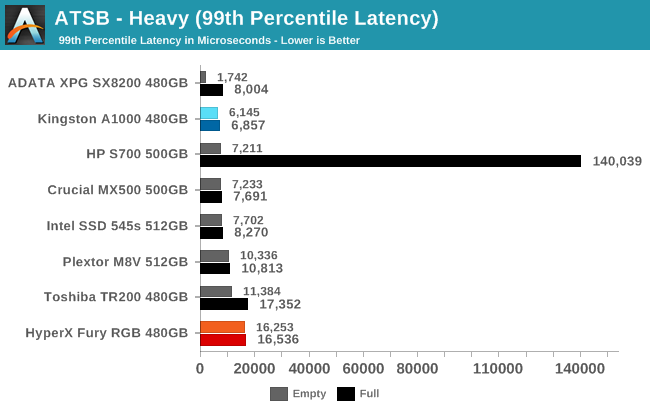
The average latency of the Fury RGB on the Heavy test is slightly higher than normal for mainstream SATA SSDs, but it's nothing compared to the DRAMless Toshiba TR200. The 99th percentile latency is a problem, as even the TR200 does better than the Fury RGB when the test is run on a full drive.
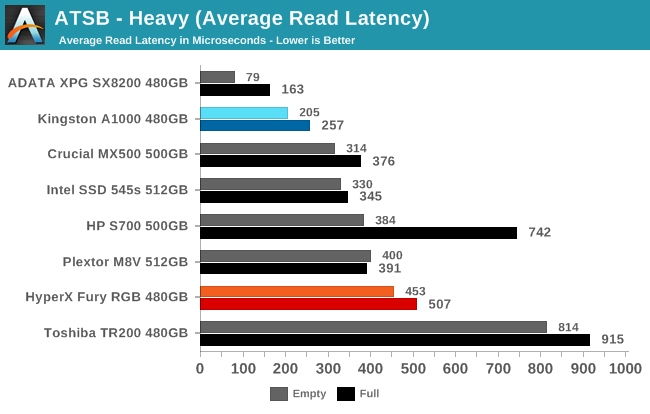
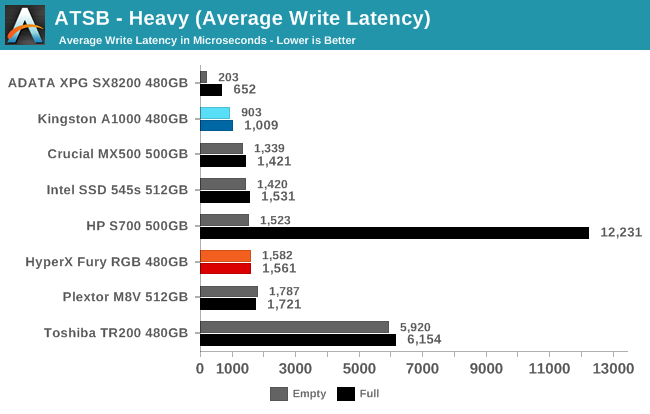
The average read latency scores from the Fury RGB stand out a bit more than the average write latency, but they're both within reason and far better than the DRAMless drive.
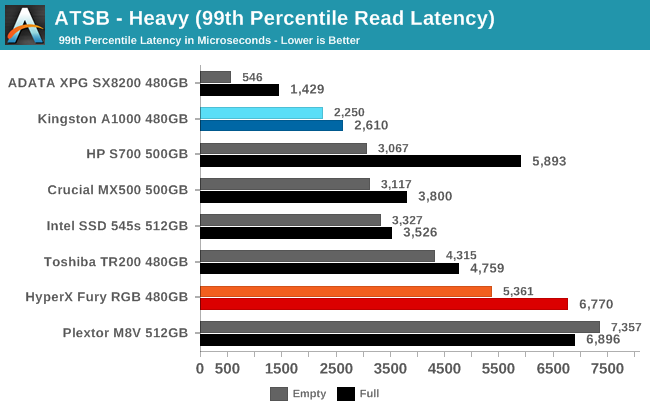
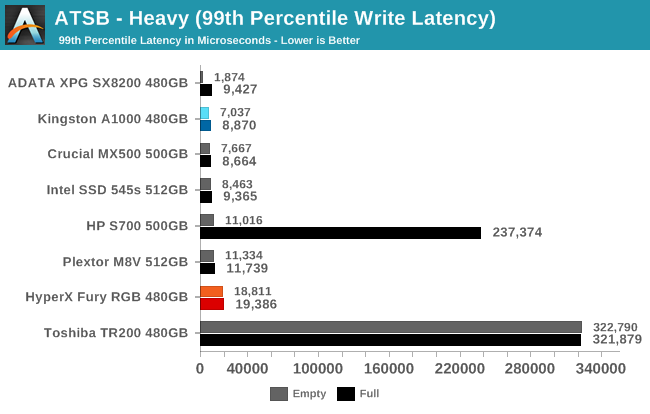
The 99th percentile read latencies of the Fury RGB are larger than what most of the competition provides but not large enough to be a serious problem. The 99th percentile write latencies are more of an outlier compared to the mainstream SATA drives, but the Toshiba TR200 shows what real performance problems look like.
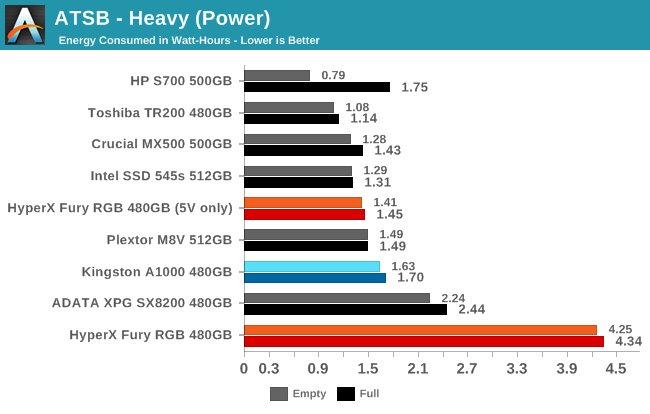
The Fury RGB again shows reasonable power efficiency if the energy used by the LEDs is ignored, because the LEDs set to red at full brightness use twice the power of the storage side of the drive.
AnandTech Storage Bench - Light
Our Light storage test has relatively more sequential accesses and lower queue depths than The Destroyer or the Heavy test, and it's by far the shortest test overall. It's based largely on applications that aren't highly dependent on storage performance, so this is a test more of application launch times and file load times. This test can be seen as the sum of all the little delays in daily usage, but with the idle times trimmed to 25ms it takes less than half an hour to run. Details of the Light test can be found here. As with the ATSB Heavy test, this test is run with the drive both freshly erased and empty, and after filling the drive with sequential writes.
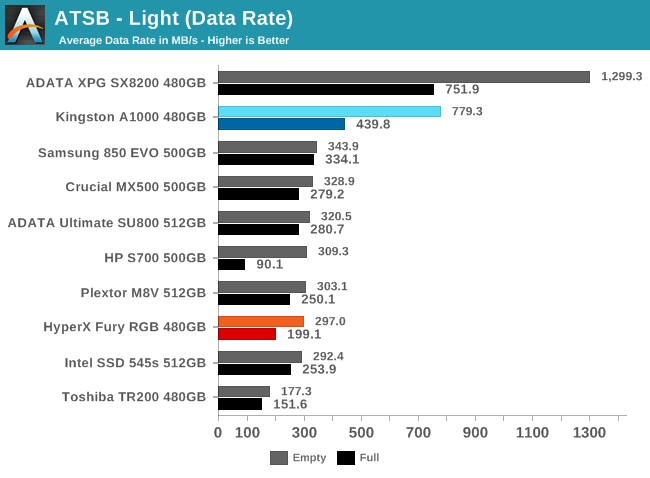
When the Light test is run on an empty drive, the HyperX Fury RGB provides an average data rate that is only slightly below normal for mainstream SATA SSDs. When the test is run on a full drive the Fury RGB suffers more than a typical mainstream drive but does not fall all the way down to the performance level of DRAMless SSDs.
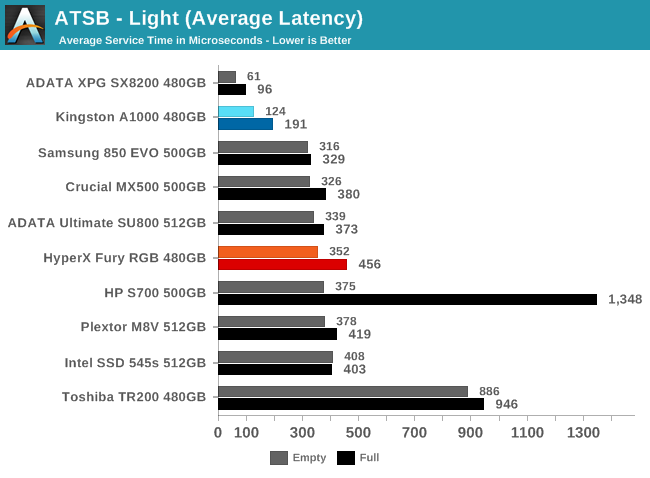
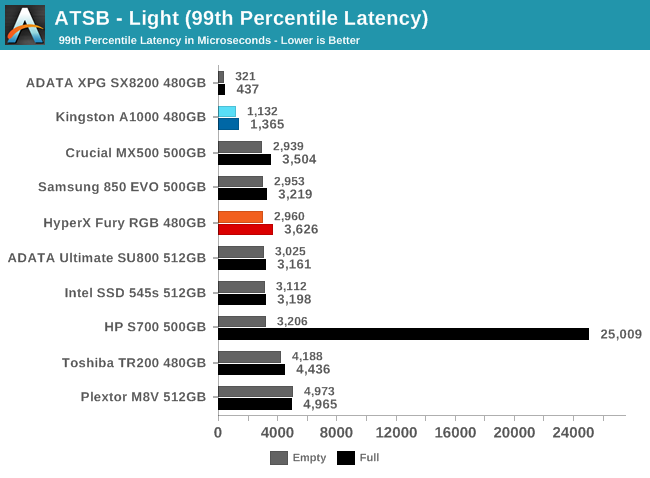
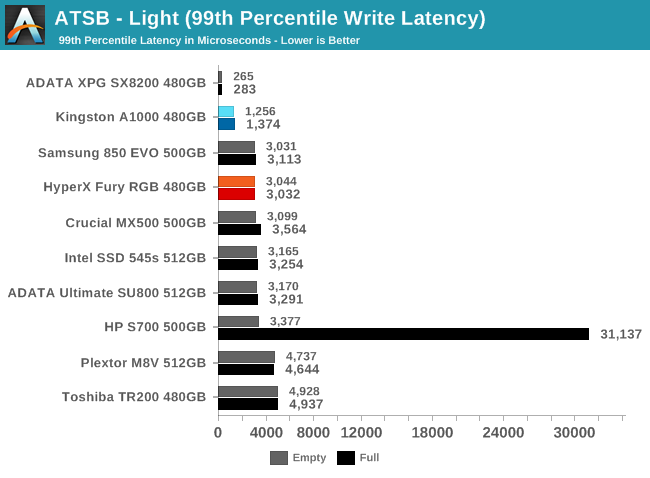
The average and 99th percentile latencies from the Fury RGB on the Light test are reasonable for a SATA drive and don't indicate any serious issues on gentle workloads.
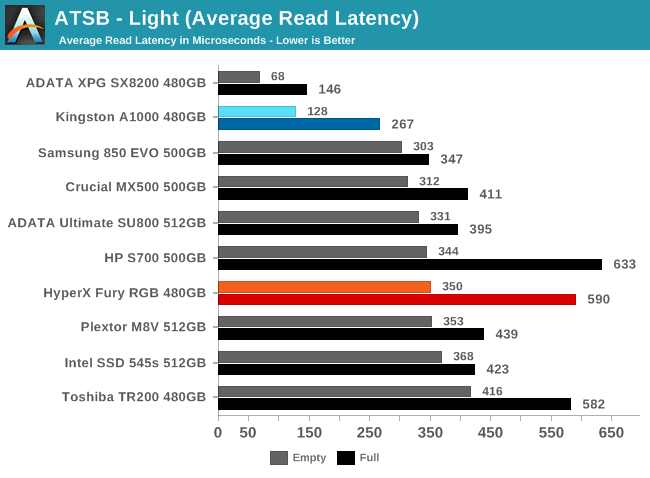
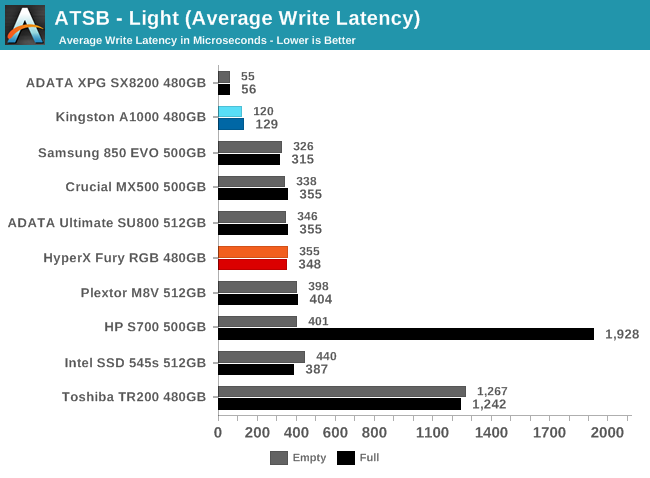
The full-drive test run's average read latency is a bit higher than normal but otherwise the Fury RGB scores about as well as any other SATA SSD.
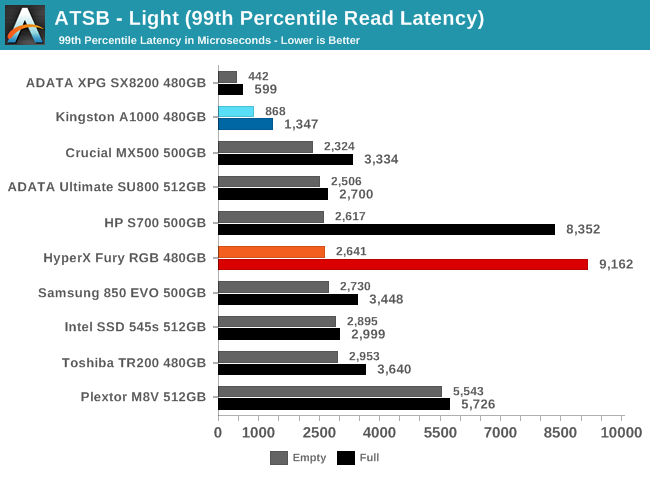
Read latency again stands out when looking at 99th percentiles, and the Fury RGB actually scores a bit worse than even the DRAMless HP S700. It does not appear that the Fury RGB is capable of suspending write operations in order to quickly handle new read requests.
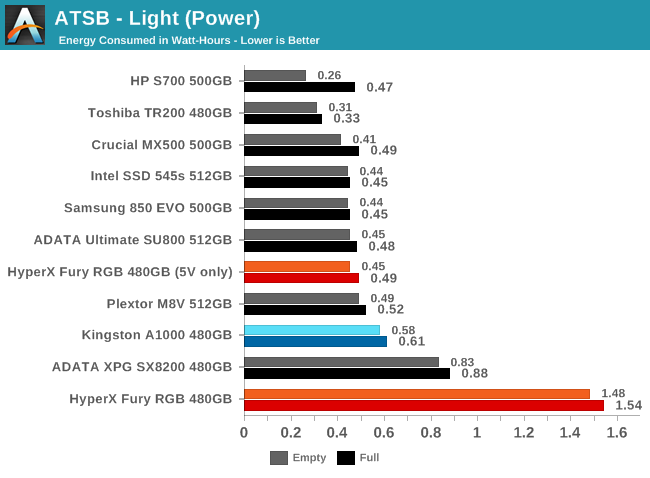
The energy usage of just the SSD side of the drive is similar to other SATA SSDs, and the LEDs continue to use far more power than the storage operations.
Random Read Performance
Our first test of random read performance uses very short bursts of operations issued one at a time with no queuing. The drives are given enough idle time between bursts to yield an overall duty cycle of 20%, so thermal throttling is impossible. Each burst consists of a total of 32MB of 4kB random reads, from a 16GB span of the disk. The total data read is 1GB.
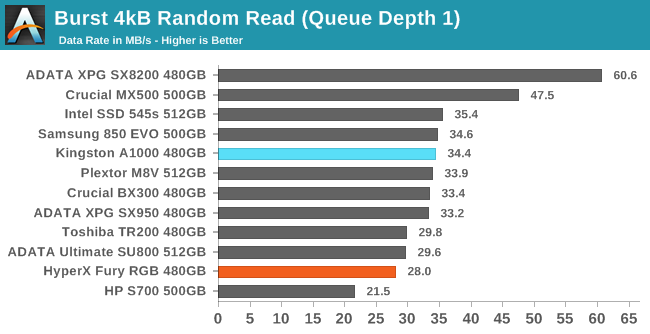
The QD1 burst random read performance of the HyperX Fury RGB is about 18% slower than what the Plextor M8V manages with the same NAND flash, and 40% slower than the Crucial MX500.
Our sustained random read performance is similar to the random read test from our 2015 test suite: queue depths from 1 to 32 are tested, and the average performance and power efficiency across QD1, QD2 and QD4 are reported as the primary scores. Each queue depth is tested for one minute or 32GB of data transferred, whichever is shorter. After each queue depth is tested, the drive is given up to one minute to cool off so that the higher queue depths are unlikely to be affected by accumulated heat build-up. The individual read operations are again 4kB, and cover a 64GB span of the drive.
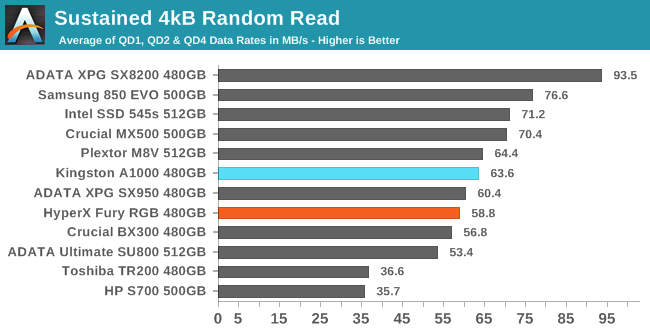
On the longer random read test with some higher queue depths involved, the Fury RGB manages to be clearly faster than the DRAMless SATA drives and is only a little bit slower than average for mainstream SATA drives.
 |
|||||||||
| Power Efficiency in MB/s/W | Average Power in W | ||||||||
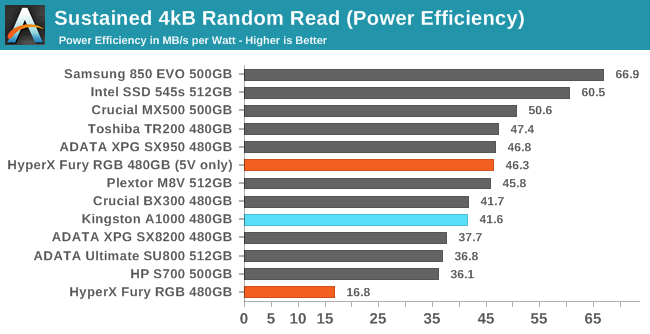
When excluding the LEDs power draw, the Fury RGB has reasonable power efficiency during low queue depth random reads since the power draw and performance are both just a bit below average.
 |
|||||||||
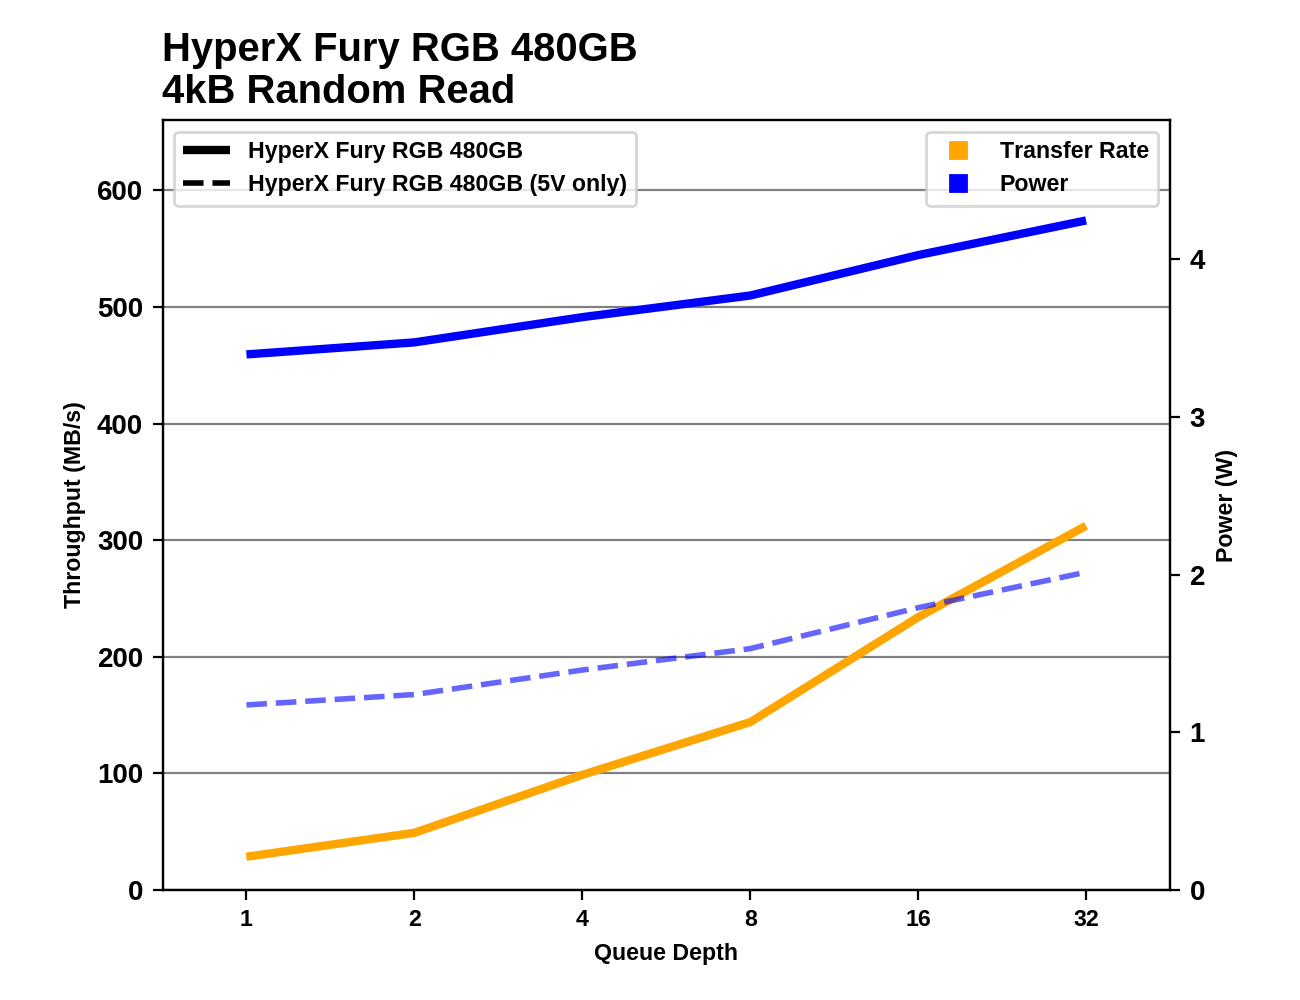
The random read performance of the Fury RGB scales up with increasing queue depth better than the DRAMless drives, but most of the other mainstream drives show at least slightly better scaling.
Random Write Performance
Our test of random write burst performance is structured similarly to the random read burst test, but each burst is only 4MB and the total test length is 128MB. The 4kB random write operations are distributed over a 16GB span of the drive, and the operations are issued one at a time with no queuing.
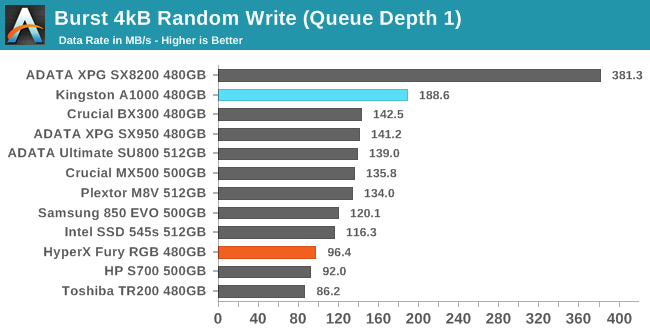
The QD1 burst random write performance of the HyperX Fury RGB is slightly better than the DRAMless SATA SSDs but is almost 30% slower than a good mainstream SATA drive.
As with the sustained random read test, our sustained 4kB random write test runs for up to one minute or 32GB per queue depth, covering a 64GB span of the drive and giving the drive up to 1 minute of idle time between queue depths to allow for write caches to be flushed and for the drive to cool down.
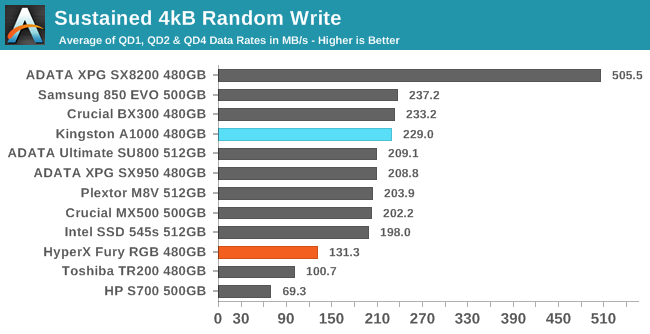
The decent burst random write performance from the Fury RGB doesn't hold up during the longer sustained random write test. The Fury RGB outperforms the DRAMless SATA drives but it is closer to their level of performance than to the typical mainstream SATA SSDs.
 |
|||||||||
| Power Efficiency in MB/s/W | Average Power in W | ||||||||
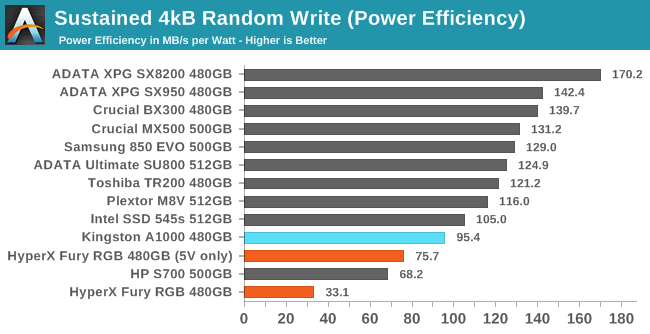
With average power consumption but sub-par performance, the Fury RGB's power efficiency rating is very low even before the LED's power draw is included.
 |
|||||||||
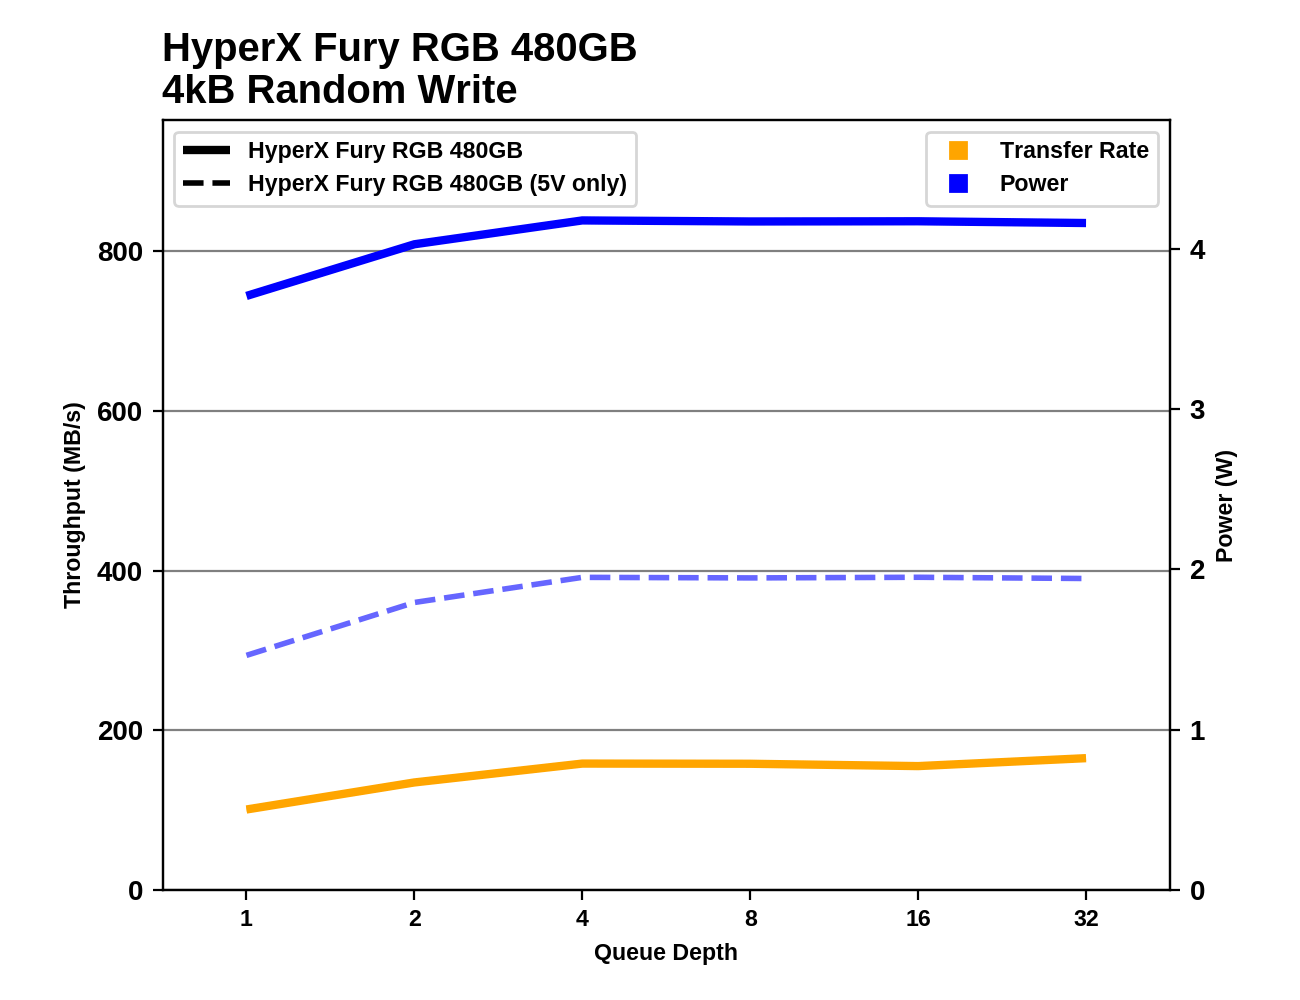
The random write performance of the HyperX Fury RGB does scale up slightly with increasing queue depths, but it plateaus at a performance level that is only slightly faster than the Toshiba TR200 DRAMless SATA SSD.
Sequential Read Performance
Our first test of sequential read performance uses short bursts of 128MB, issued as 128kB operations with no queuing. The test averages performance across eight bursts for a total of 1GB of data transferred from a drive containing 16GB of data. Between each burst the drive is given enough idle time to keep the overall duty cycle at 20%.
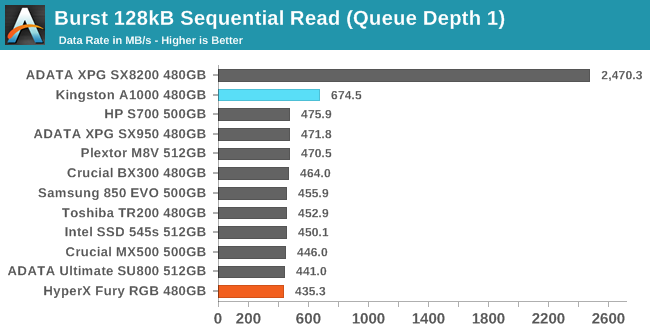
The QD1 burst sequential read performance of the HyperX Fury RGB is relatively slow for a SATA SSD, but it's less than a 10% difference relative to the fastest SATA drives in this batch.
Our test of sustained sequential reads uses queue depths from 1 to 32, with the performance and power scores computed as the average of QD1, QD2 and QD4. Each queue depth is tested for up to one minute or 32GB transferred, from a drive containing 64GB of data. This test is run twice: once with the drive prepared by sequentially writing the test data, and again after the random write test has mixed things up, causing fragmentation inside the SSD that isn't visible to the OS. These two scores represent the two extremes of how the drive would perform under real-world usage, where wear leveling and modifications to some existing data will create some internal fragmentation that degrades performance, but usually not to the extent shown here.
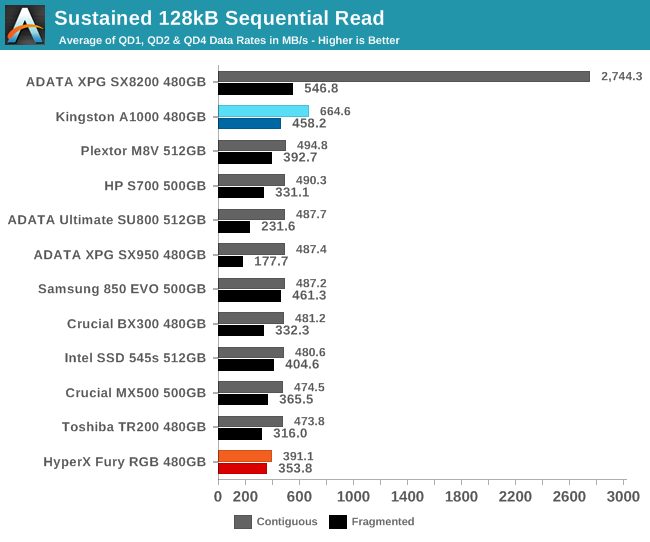
On the longer sequential read test the Fury RGB again comes in last place with substantially slower read speeds for contiguous data than any other drive in this batch, but it does handle internal fragmentation reasonably well.
 |
|||||||||
| Power Efficiency in MB/s/W | Average Power in W | ||||||||
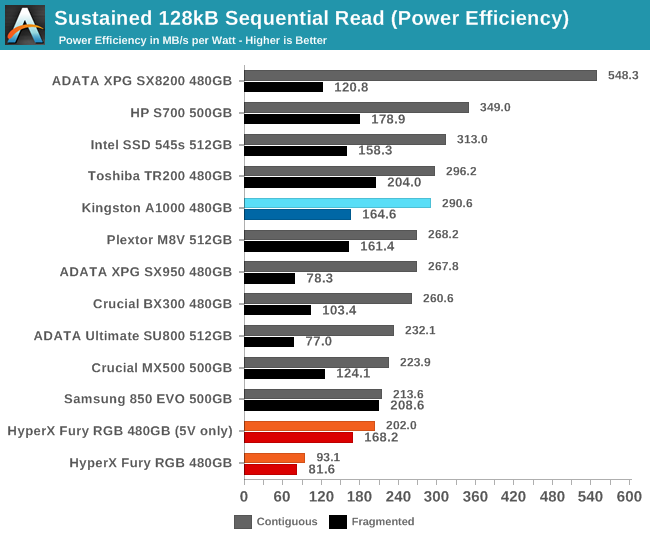
Not counting the power used for the LED lighting, the Fury RGB uses a fairly normal ~2W for the sequential read test but it doesn't score very well on the efficiency rating because of the poor performance.
 |
|||||||||
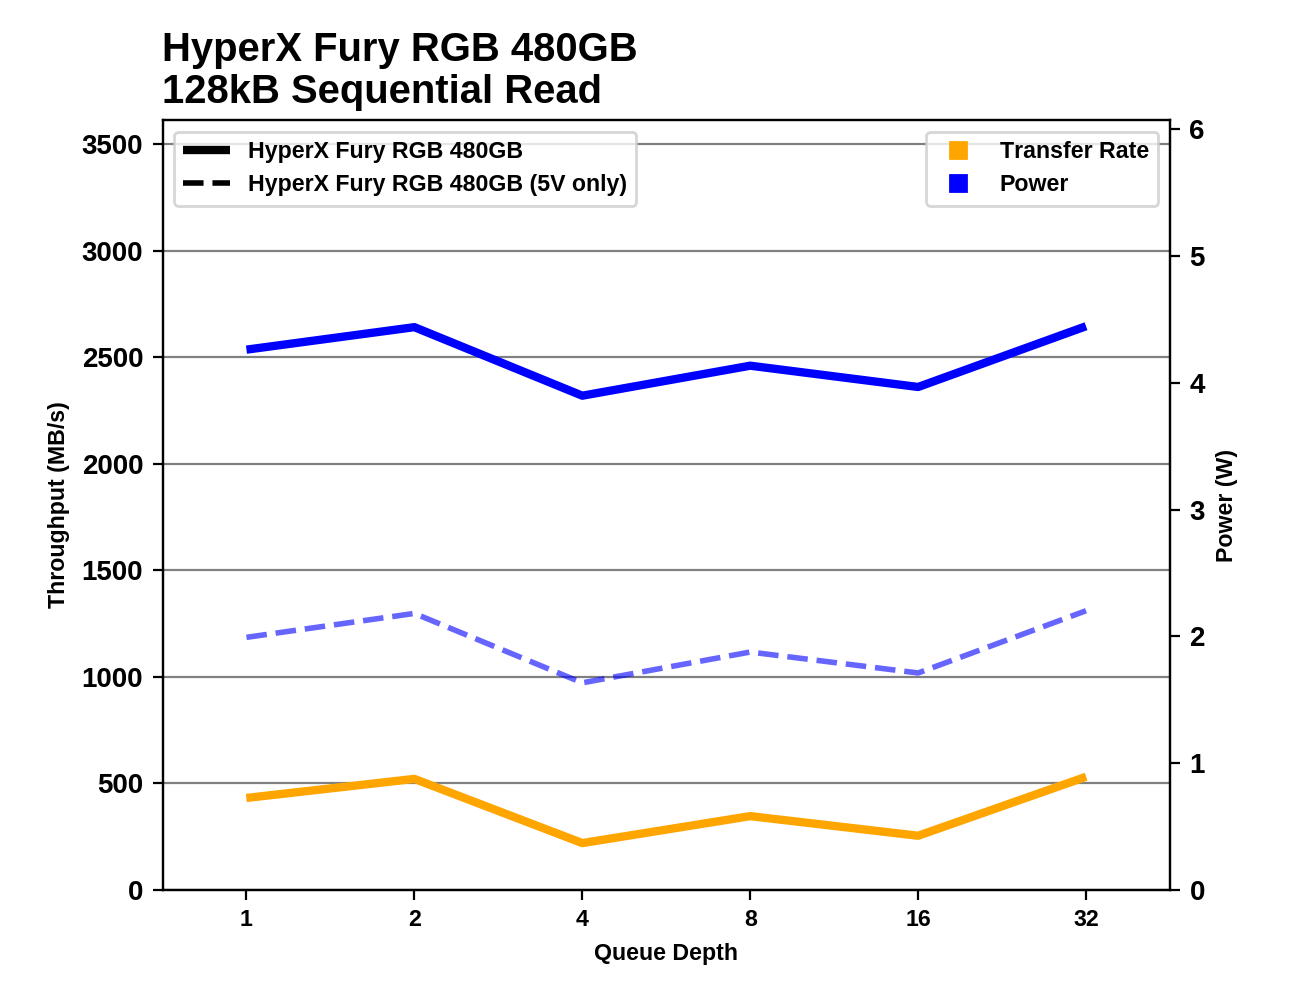
Performance on the sequential read test is unusually variable for the HyperX Fury RGB. Given that it is averaging over 4W for most of this test, I suspect we're seeing thermal throttling. SSDs without LED lighting idle at no more than 1W between phases of this test but the Fury RGB idles at over 3W under these conditions, largely defeating the purpose of the cooldown period between each phase.
Sequential Write Performance
Our test of sequential write burst performance is structured identically to the sequential read burst performance test save for the direction of the data transfer. Each burst writes 128MB as 128kB operations issued at QD1, for a total of 1GB of data written to a drive containing 16GB of data.
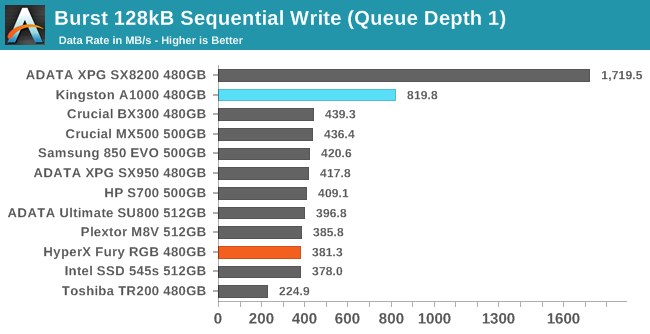
The HyperX Fury RGB SSD is slower than most SATA SSDs on the burst sequential write test but the 13% deficit relative to the fastest SATA drives is not a major problem.
Our test of sustained sequential writes is structured identically to our sustained sequential read test, save for the direction of the data transfers. Queue depths range from 1 to 32 and each queue depth is tested for up to one minute or 32GB, followed by up to one minute of idle time for the drive to cool off and perform garbage collection. The test is confined to a 64GB span of the drive.
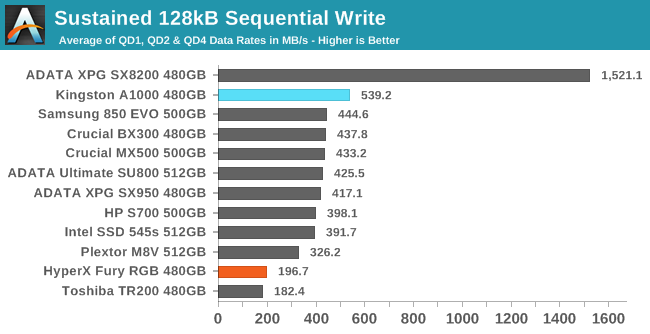
On the longer sequential write test, the Fury RGB has serious trouble: it slows down almost to the level of the DRAMless Toshiba TR200 and is averaging less than half the performance provided by most mainstream SATA SSDs.
 |
|||||||||
| Power Efficiency in MB/s/W | Average Power in W | ||||||||
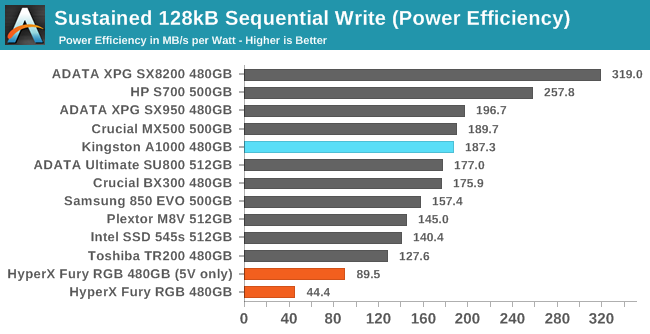
The power used by the SSD side of the Fury RGB during the sequential write test is reasonably low, but since the performance is just plain bad, the efficiency rating is in last place by a wide margin even without counting the power used by the LEDs.
 |
|||||||||
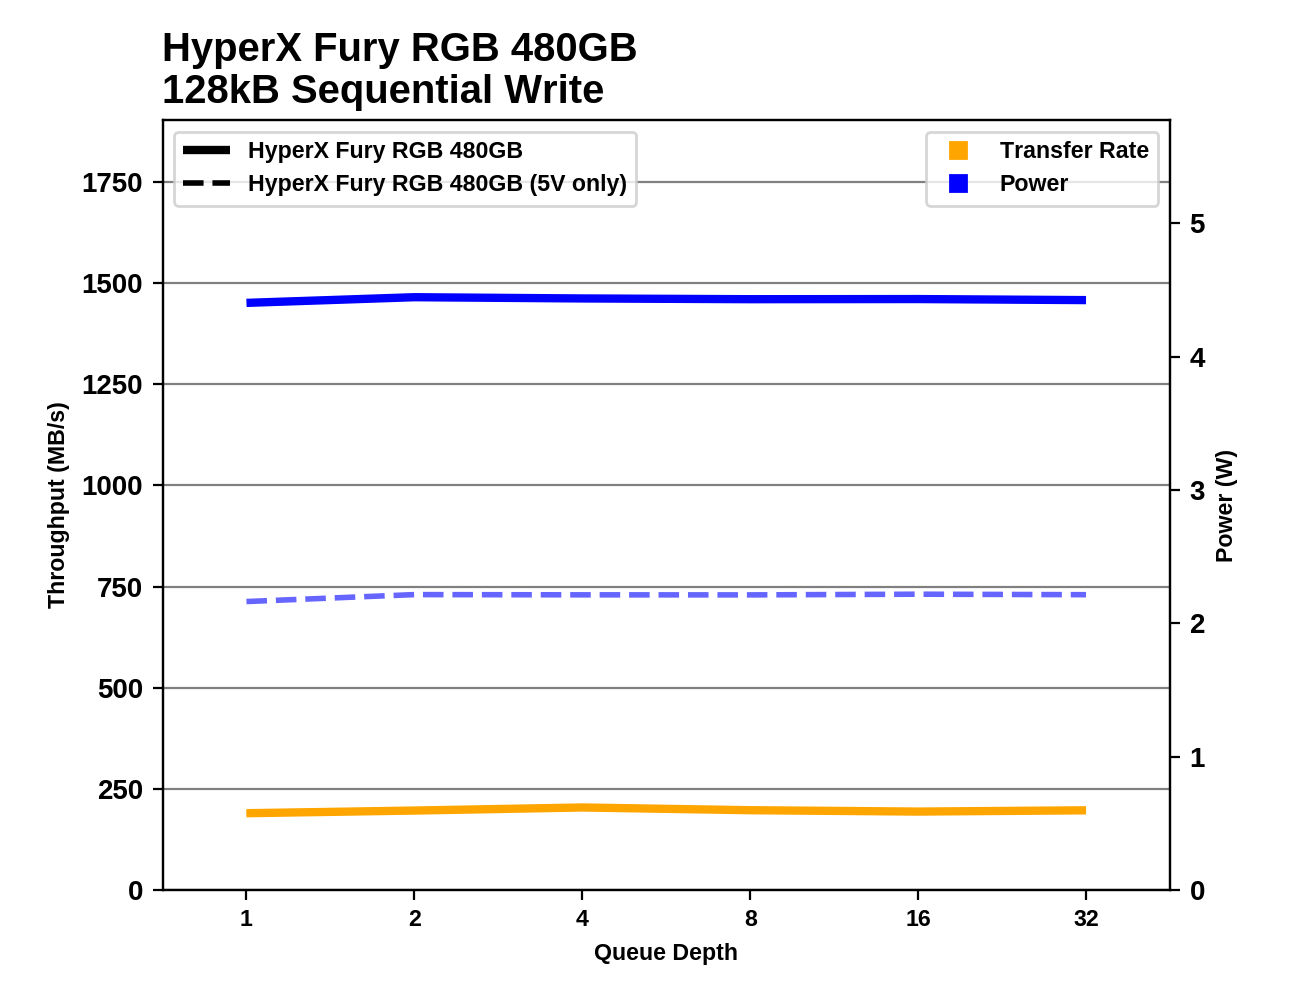
The sequential write speed of the Fury RGB is at least consistent throughout the test, but it's performing like an entry-level SATA SSD. It isn't clear whether the drive is more limited by thermals or by a SLC write cache that fills almost immediately.
Mixed Random Performance
Our test of mixed random reads and writes covers mixes varying from pure reads to pure writes at 10% increments. Each mix is tested for up to 1 minute or 32GB of data transferred. The test is conducted with a queue depth of 4, and is limited to a 64GB span of the drive. In between each mix, the drive is given idle time of up to one minute so that the overall duty cycle is 50%.
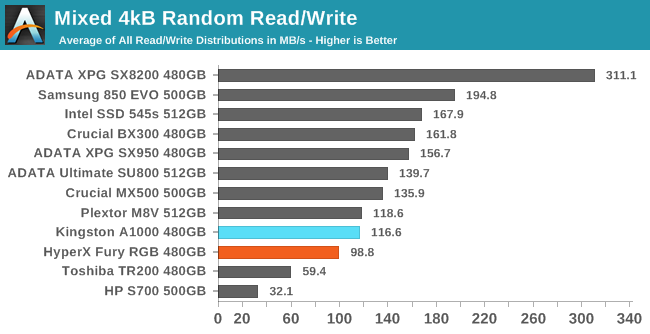
None of the drives in this batch that use Toshiba's BiCS3 3D TLC perform all that well on the mixed random I/O test. The Plextor M8V shows that the HyperX Fury RGB could do a bit better, but at least the Fury RGB is well ahead of the DRAMless Toshiba TR200 on this test.
 |
|||||||||
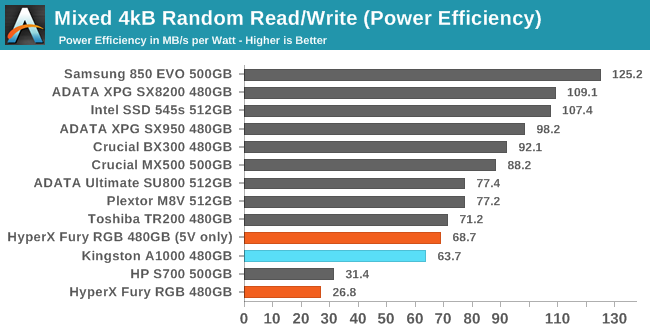
| Power Efficiency in MB/s/W | Average Power in W | ||||||||
When excluding the power used by the LEDs, the Fury RGB uses a bit less power on this test than most mainstream SATA SSDs. But the performance is low enough that the efficiency rating is still substantially lower than mainstream competition like the Crucial MX500.
 |
|||||||||
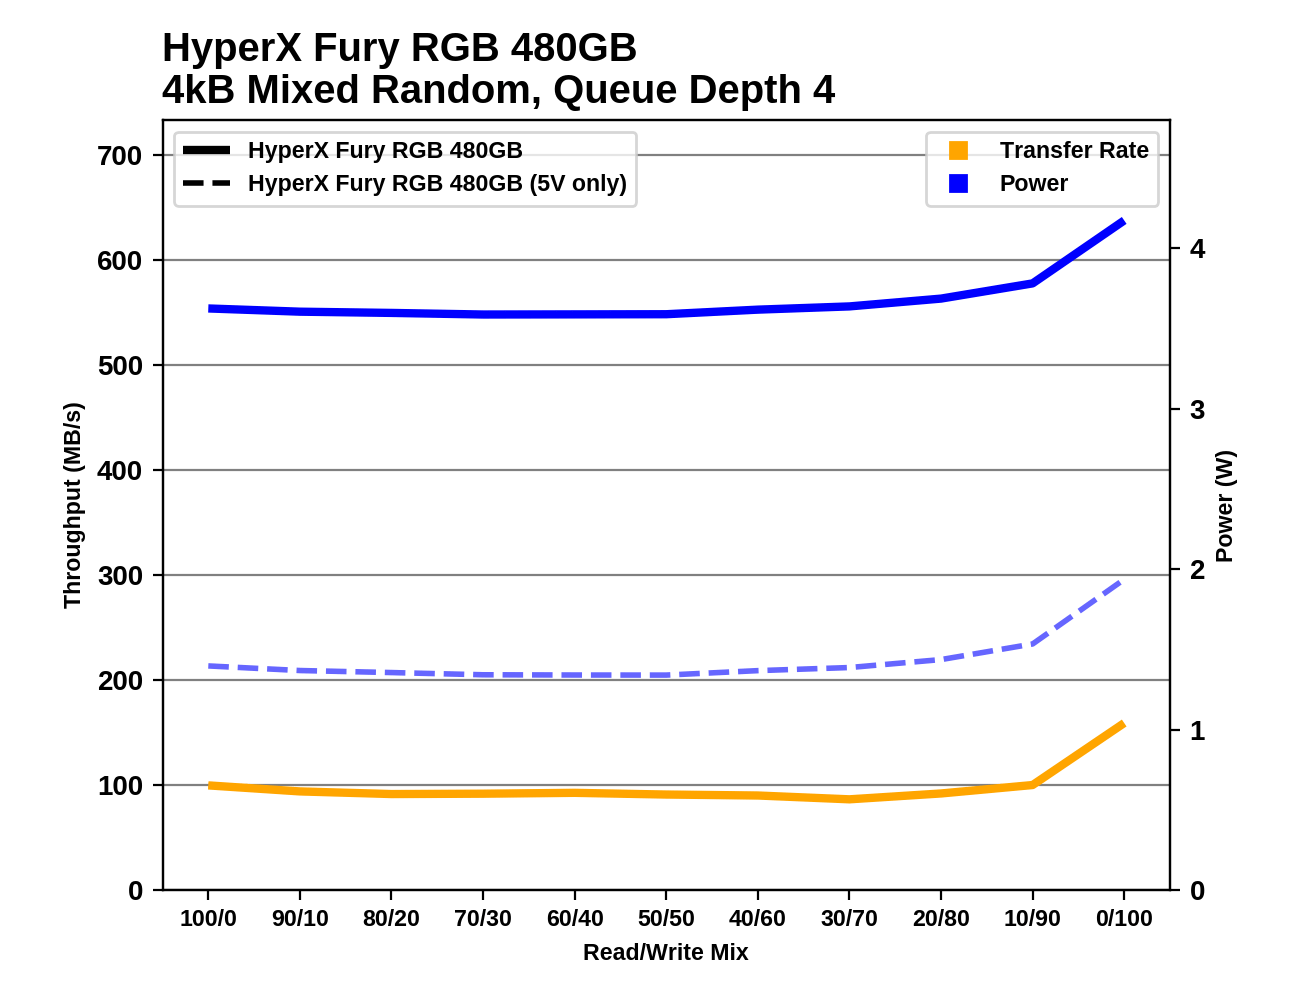
The performance and power consumption of the Fury RGB on the mixed random I/O test are both fairly steady throughout the test save for the typical jump at the end of the test when the workload shifts to pure random writes. Most mainstream drives deliver gradually increasing performance over the course of the test as the proportion of writes increases, and even some of the other BiCS3-based drives make significant gains during the last third of the test.
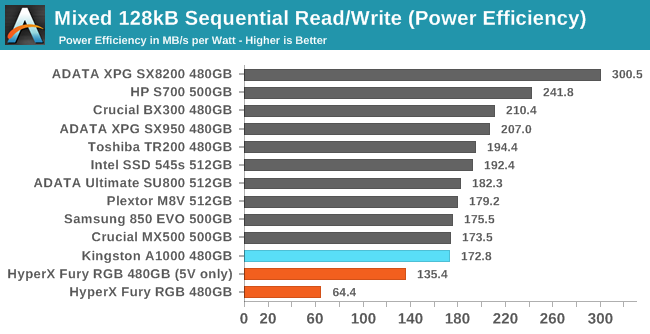
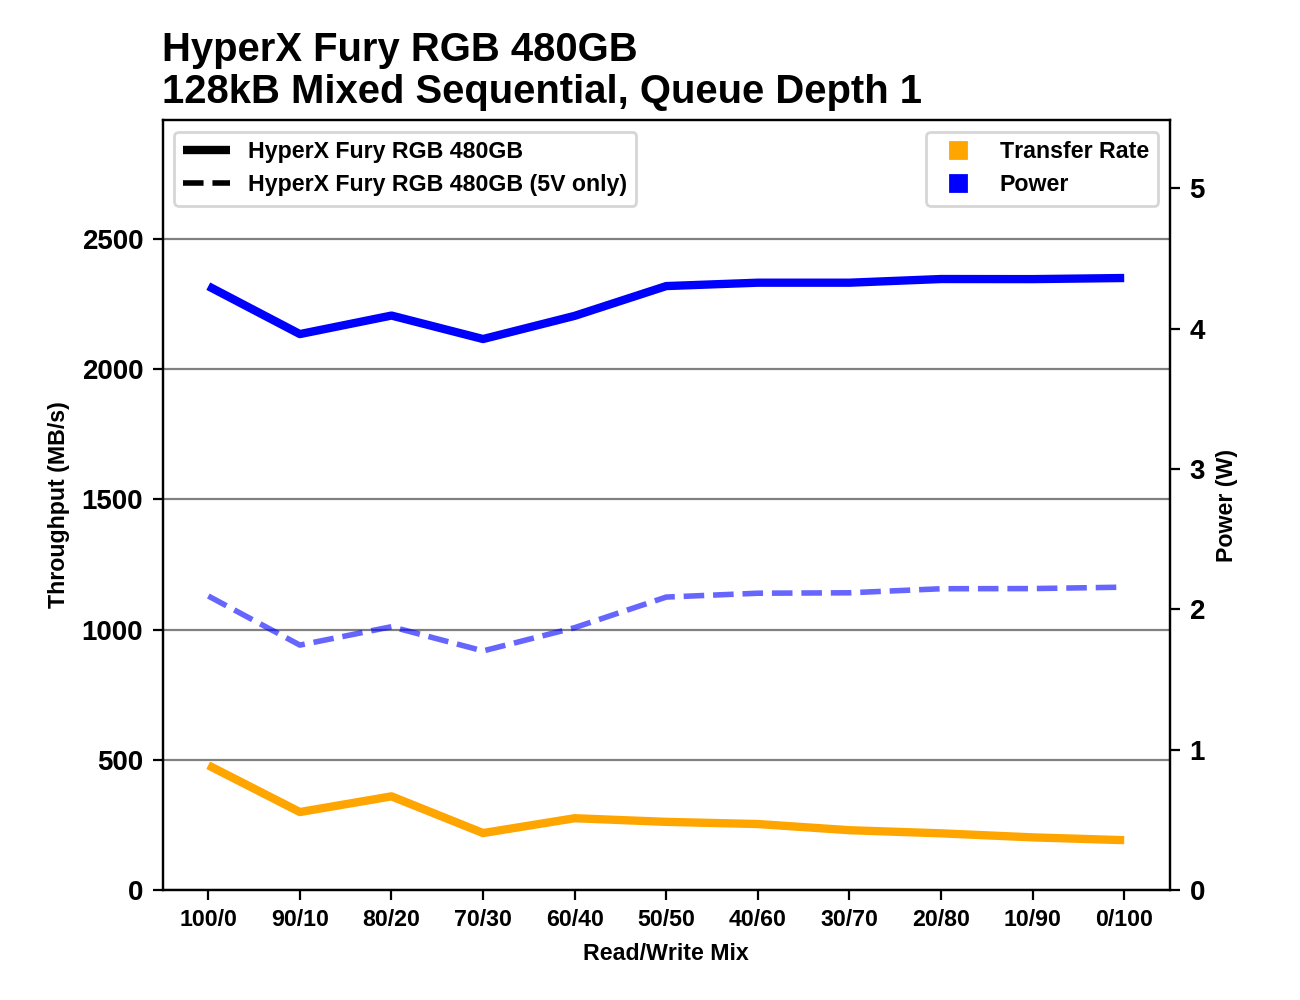
Mixed Sequential Performance
Our test of mixed sequential reads and writes differs from the mixed random I/O test by performing 128kB sequential accesses rather than 4kB accesses at random locations, and the sequential test is conducted at queue depth 1. The range of mixes tested is the same, and the timing and limits on data transfers are also the same as above.
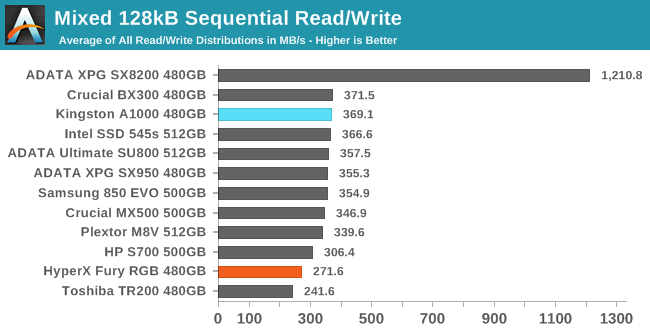
On the mixed sequential I/O test we again see the HyperX Fury RGB performing like a DRAMless SSD with at least 20% lower performance than most mainstream SATA SSDs.
 |
|||||||||
| Power Efficiency in MB/s/W | Average Power in W | ||||||||
The storage side of the Fury RGB consumes the normal amount of power for a mainstream SATA SSD on this test, so ends up with a clear last-place efficiency score. The DRAMless drives that perform similarly to the Fury RGB consume much less power and have above-average efficiency.
 |
|||||||||
During the first third of the mixed sequential I/O test the performance of the HyperX Fury RGB is inconsistent. As the proportion of writes in the workload increases, the drive settles down into a gradual decline in performance that keeps it just above the Toshiba TR200.
Idle Power Measurement
SATA SSDs are tested with SATA link power management disabled to measure their active idle power draw, and with it enabled for the deeper idle power consumption score and the idle wake-up latency test. Our testbed, like any ordinary desktop system, cannot trigger the deepest DevSleep idle state.
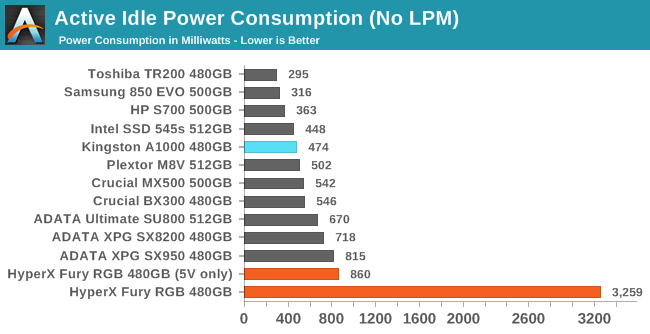
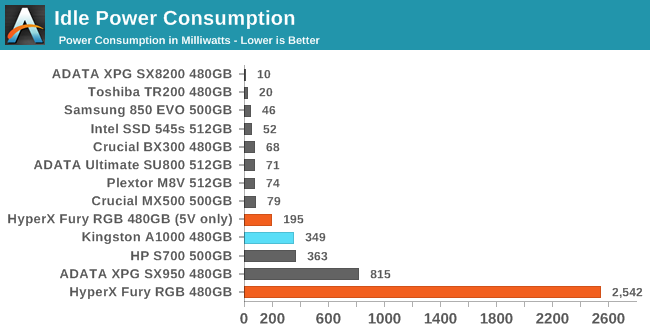
With the LEDs defaulting to red and drawing about 2.3 W on their own, the Kingston HyperX Fury RGB can't come close to matching an ordinary SATA SSD's idle power. But even excluding power on the 12V rail that is used just for the lighting, the Fury RGB has a pretty high active idle power draw and more than twice the slumber state power draw of typical SATA SSDs.
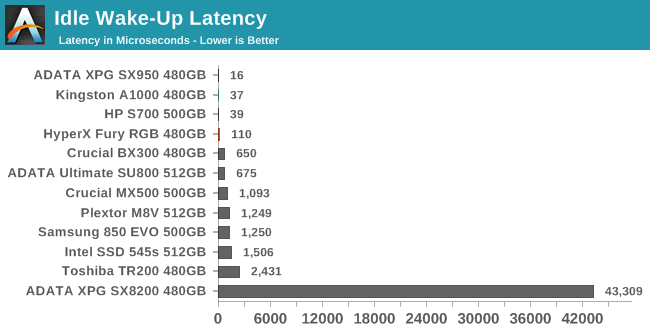
The Fury RGB has a fairly quick wake-up latency, but not as quick is typical for drives with broken power management. If the Fury RGB didn't have the lighting and as a result had lower operating temperatures and better idle power, then it might come across as having fairly decent power management that could be used quite aggressively thanks to the quick wake-up time.
Conclusion
Most users can give the HyperX Fury RGB SSD an immediate pass due to using a laptop or one of the vast majority of desktop cases that don't allow for showing off an illuminated SATA SSD. For users who are putting together a fully-illuminated build to show off, the Fury RGB's dark gray case can blend in with most surroundings and leave the drive's LEDs to add an accent to what might otherwise be a bare spot in the computer.
When it comes to actual storage duties however, the Fury RGB is not as versatile, and the LED lighting itself is responsible for most of the drive's problems. The LED lighting on the Kingston HyperX Fury RGB SSD drives up the price of this SATA SSD to NVMe levels and draws enough power to make the drive more prone to overheating than almost any M.2 NVMe SSD out there—and we tested with only one of the three color channels illuminated! Kingston's design for this drive uses probably twice as many LEDs as necessary to provide the backlit logo and narrow highlights, though a lot of light is blocked as it passes through the translucent plastic diffuser sheet and metal grating.
Kingston's inclusion of a large thermal pad between the metal case and the SSD components probably helps keep the overheating from being a catastrophic problem, but the real problem is the pile of 75 RGB LED modules on the back of the PCB. Kingston should have opted for a thicker drive case that allowed for either a better diffuser solution that blocks less light, or permitted the LEDs to be isolated and insulated from the SSD.
Since the Fury RGB uses the 12V power supply for the LEDs and the 5V supply for the SSD side of things, we are able to analyze the power efficiency of just the storage portion of the drive in isolation from the LED power draw. Even here the Fury RGB comes up short, likely due in part to increased leakage currents caused by the drive's high operating temperature.
The HyperX Fury RGB's performance on our benchmark suite is disappointing. It usually maintains a clear performance lead over entry-level DRAMless SATA SSDs, but the Fury RGB has the internals of a mainstream SATA drive and fails to perform at that level. Kingston's own entry-level NVMe SSD offers much higher performance at lower prices. The only way the HyperX Fury RGB makes sense in a high-end enthusiast build is if it is complemented by the inclusion of a faster but probably unobtrusive NVMe SSD. In a more modest build that does not need the highest performance storage, the Fury RGB does still provide a huge performance advantage over hard drives, but there are still better performing drives for the price.
| SSD Price Comparison | |||
| 240-280GB | 480-512GB | 960GB-1TB | |
| HyperX Fury RGB | $74.99 (31¢/GB) | $124.99 (26¢/GB) | $219.99 (23¢/GB) |
| Crucial MX500 | $59.99 (24¢/GB) | $89.99 (18¢/GB) | $159.99 (16¢/GB) |
| Samsung 860 EVO | $57.99 (23¢/GB) | $97.99 (20¢/GB) | $167.99 (17¢/GB) |
| Team Group Delta RGB | $74.99 (30¢/GB) | $119.99 (24¢/GB) | $209.99 (21¢/GB) |
| NVMe SSDs: | |||
| Kingston A1000 | $56.99 (24¢/GB) | $99.99 (21¢/GB) | $219.99 (23¢/GB) |
| ADATA XPG SX8200 | $72.99 (30¢/GB) | $124.99 (26¢/GB) | $249.99 (26¢/GB) |
| HP EX920 | $83.99 (33¢/GB) | $139.99 (27¢/GB) | $229.99 (22¢/GB) |
They HyperX Fury RGB is not the only SATA RGB SSD option on the market. We will have a review of the Team Group T-Force Delta RGB SSD very soon. It's a bit cheaper than the Fury RGB and takes a very different approach to the lighting. But both are still much more expensive than good mainstream SATA SSDs that outperform the Fury RGB across the board. And at the same price level as the RGB SSDs, there are some very nice NVMe options.
Ultimately the HyperX Fury RGB seems to have been designed as a lighting solution first and an SSD second. And in that respect it would seem to be doing what Kingston set out to do. But unless you really want that lighting, as an SSD there are better options out there.


