Original Link: https://www.anandtech.com/show/10674/the-toshiba-ocz-vx500-ssd-review
The Toshiba OCZ VX500 (256GB, 512GB, 1024GB) SSD Review
by Billy Tallis on September 13, 2016 9:00 AM EST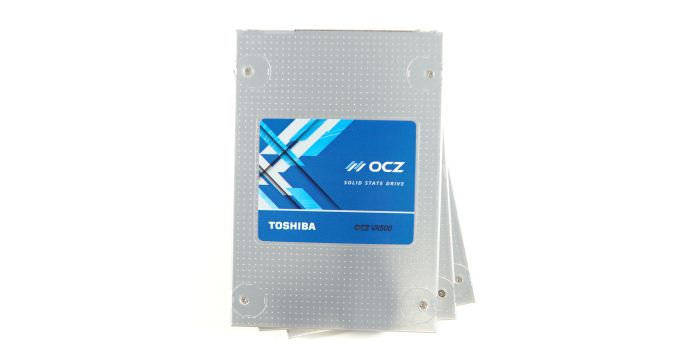
Toshiba's new OCZ VX500 is launching into what has been the quietest corner of the SSD market: SATA drives using MLC NAND flash. The fiercest competition has been among low-cost TLC SSDs and the PCIe SSD segment has seen several new entrants in recent months, but the mid- to high-end portion of the SATA SSD market has been in a holding pattern awaiting new 3D NAND. The OCZ VX500 is not a new 3D NAND SSD but a stopgap product to replace the aging OCZ Vector 180, known as the VT180 since Toshiba's overhaul of OCZ branding earlier this year.
The Barefoot 3 controller in the Vector 180 is ancient, having launched with the original OCZ Vector in 2012. At the time, it performed well enough to go up against Samsung's best in the consumer market and was viable in the enterprise market. As the market has moved on and caught up, the limitations of the Barefoot 3 controller have become increasingly awkward. Most prominently, it does not support SATA link power management and consequently products based on it have by far the worst idle power of any consumer SATA SSD on the market. It was never intended for use with TLC NAND or 3D NAND, and may not even be able to work with Toshiba's 15nm MLC NAND.
The OCZ VX500 abandons the Barefoot 3 controller and its Indilinx heritage entirely, but the controller it uses instead is also a reprise, this time of a Toshiba controller. Toshiba's TC358790 controller has been used in several products, including the Q Series Pro client SSDs and the HG6 enterprise/OEM SSD. Toshiba doesn't disclose details of their controller architectures, but we can infer a few things based on those earlier products. The TC358790 controller has previously always been limited to drive capacities of up to 512GB, and has only been used in client SSDs or read-oriented enterprise SSDs. Unlike the Barefoot 3 controller, this was never intended for a flagship high-end product. It supports the TCG Opal encryption standard and Toshiba's proprietary QSCB error correction scheme, but neither technology is mentioned in the official specifications for the VX500.
At first glance, the TC358790 controller appears to be a DRAM-less controller. However, the drive PCB it always ships on has a pad for a BGA DRAM package. The 1TB VX500 is the first product to make use of that, with the inclusion of a 256MB Micron DRAM chip, whereas the smaller capacities leave that spot empty. Modern SSDs that use a DRAM cache for NAND mapping tables typically have 1GB of DRAM for each 1TB of flash, but it is obviously possible to get by on less, and some demonstrations of the NVMe Host Memory Buffer feature have shown that access to even a little bit of DRAM can help greatly as compared with operating as a purely DRAM-less SSD.
With the knowledge that the 1TB VX500 is using at least 256MB of DRAM, we can compare its performance against the smaller models to see if it has an advantage over the smaller two capacities above and beyond what is typical for a simple capacity increase. For the most part, our test results do not show the drastic difference in behavior that we would expect between a DRAM-less SSD and a controller with a DRAM cache. Thus, it seems that the TC358790 controller may have never been DRAM-less to begin with and instead has integrated sufficient DRAM for SSDs up to 512GB. Toshiba left themselves the option of expanding on the integrated memory with external DRAM, but only now has the market reached the point of requiring a 1TB model.
| Toshiba OCZ VX500 Specifications | ||||||
| Capacity | 128GB | 256GB | 512GB | 1024GB | ||
| Controller | Toshiba TC358790 | |||||
| NAND | Toshiba 15nm MLC | |||||
| External DRAM | none | 256MB | ||||
| Sequential Read | 550MB/s | 550MB/s | 550MB/s | 550MB/s | ||
| Sequential Write | 485MB/s | 510MB/s | 515MB/s | 515MB/s | ||
| 4KB Random Read | 62k IOPS | 90k IOPS | 92k IOPS | 92k IOPS | ||
| 4KB Random Write | 49k IOPS | 58k IOPS | 64k IOPS | 65k IOPS | ||
| Idle Power | 125 mW | 260 mW | ||||
| Max Power | 3.4 W | |||||
| DEVSLP Power | 5 mW | unsupported | ||||
| Encryption | No | |||||
| Endurance (TBW) | 74 TB | 148 TB | 296 TB | 592 TB | ||
| Warranty | Five years | |||||
| MSRP | $63.99 | $92.79 | $152.52 | $337.06 | ||
One apparent downside of the use of external DRAM is a restriction of the drive's power management capabilities. The 1TB VX500 does implement the slumber power state, but it uses more than four times the power in that state. And unlike the smaller capacities, the lowest-power DEVSLP state is not implemented. The 1TB VX500 has vastly better idle power consumption than the Vector 180 at any capacity, but it's still not a great choice for mobile use.
The OCZ VX500 makes use of SLC write caching, which is a requirement for acceptable performance from TLC SSDs but rare on MLC SSDs. SLC caching on MLC SSDs can be a mixed bag; it allows for the highest peak performance, but at the cost of creating more work that needs to be done later to flush the cache. MLC drives in particular often have less spare area for the cache than a TLC drive would, so they may not be able to sustain their burst write speeds for as long. Implemented properly, SLC caching can be very helpful for client workloads which typically exhibit bursts of I/O, but many of our benchmarks are sustained tests that run long enough to fill any SLC cache.
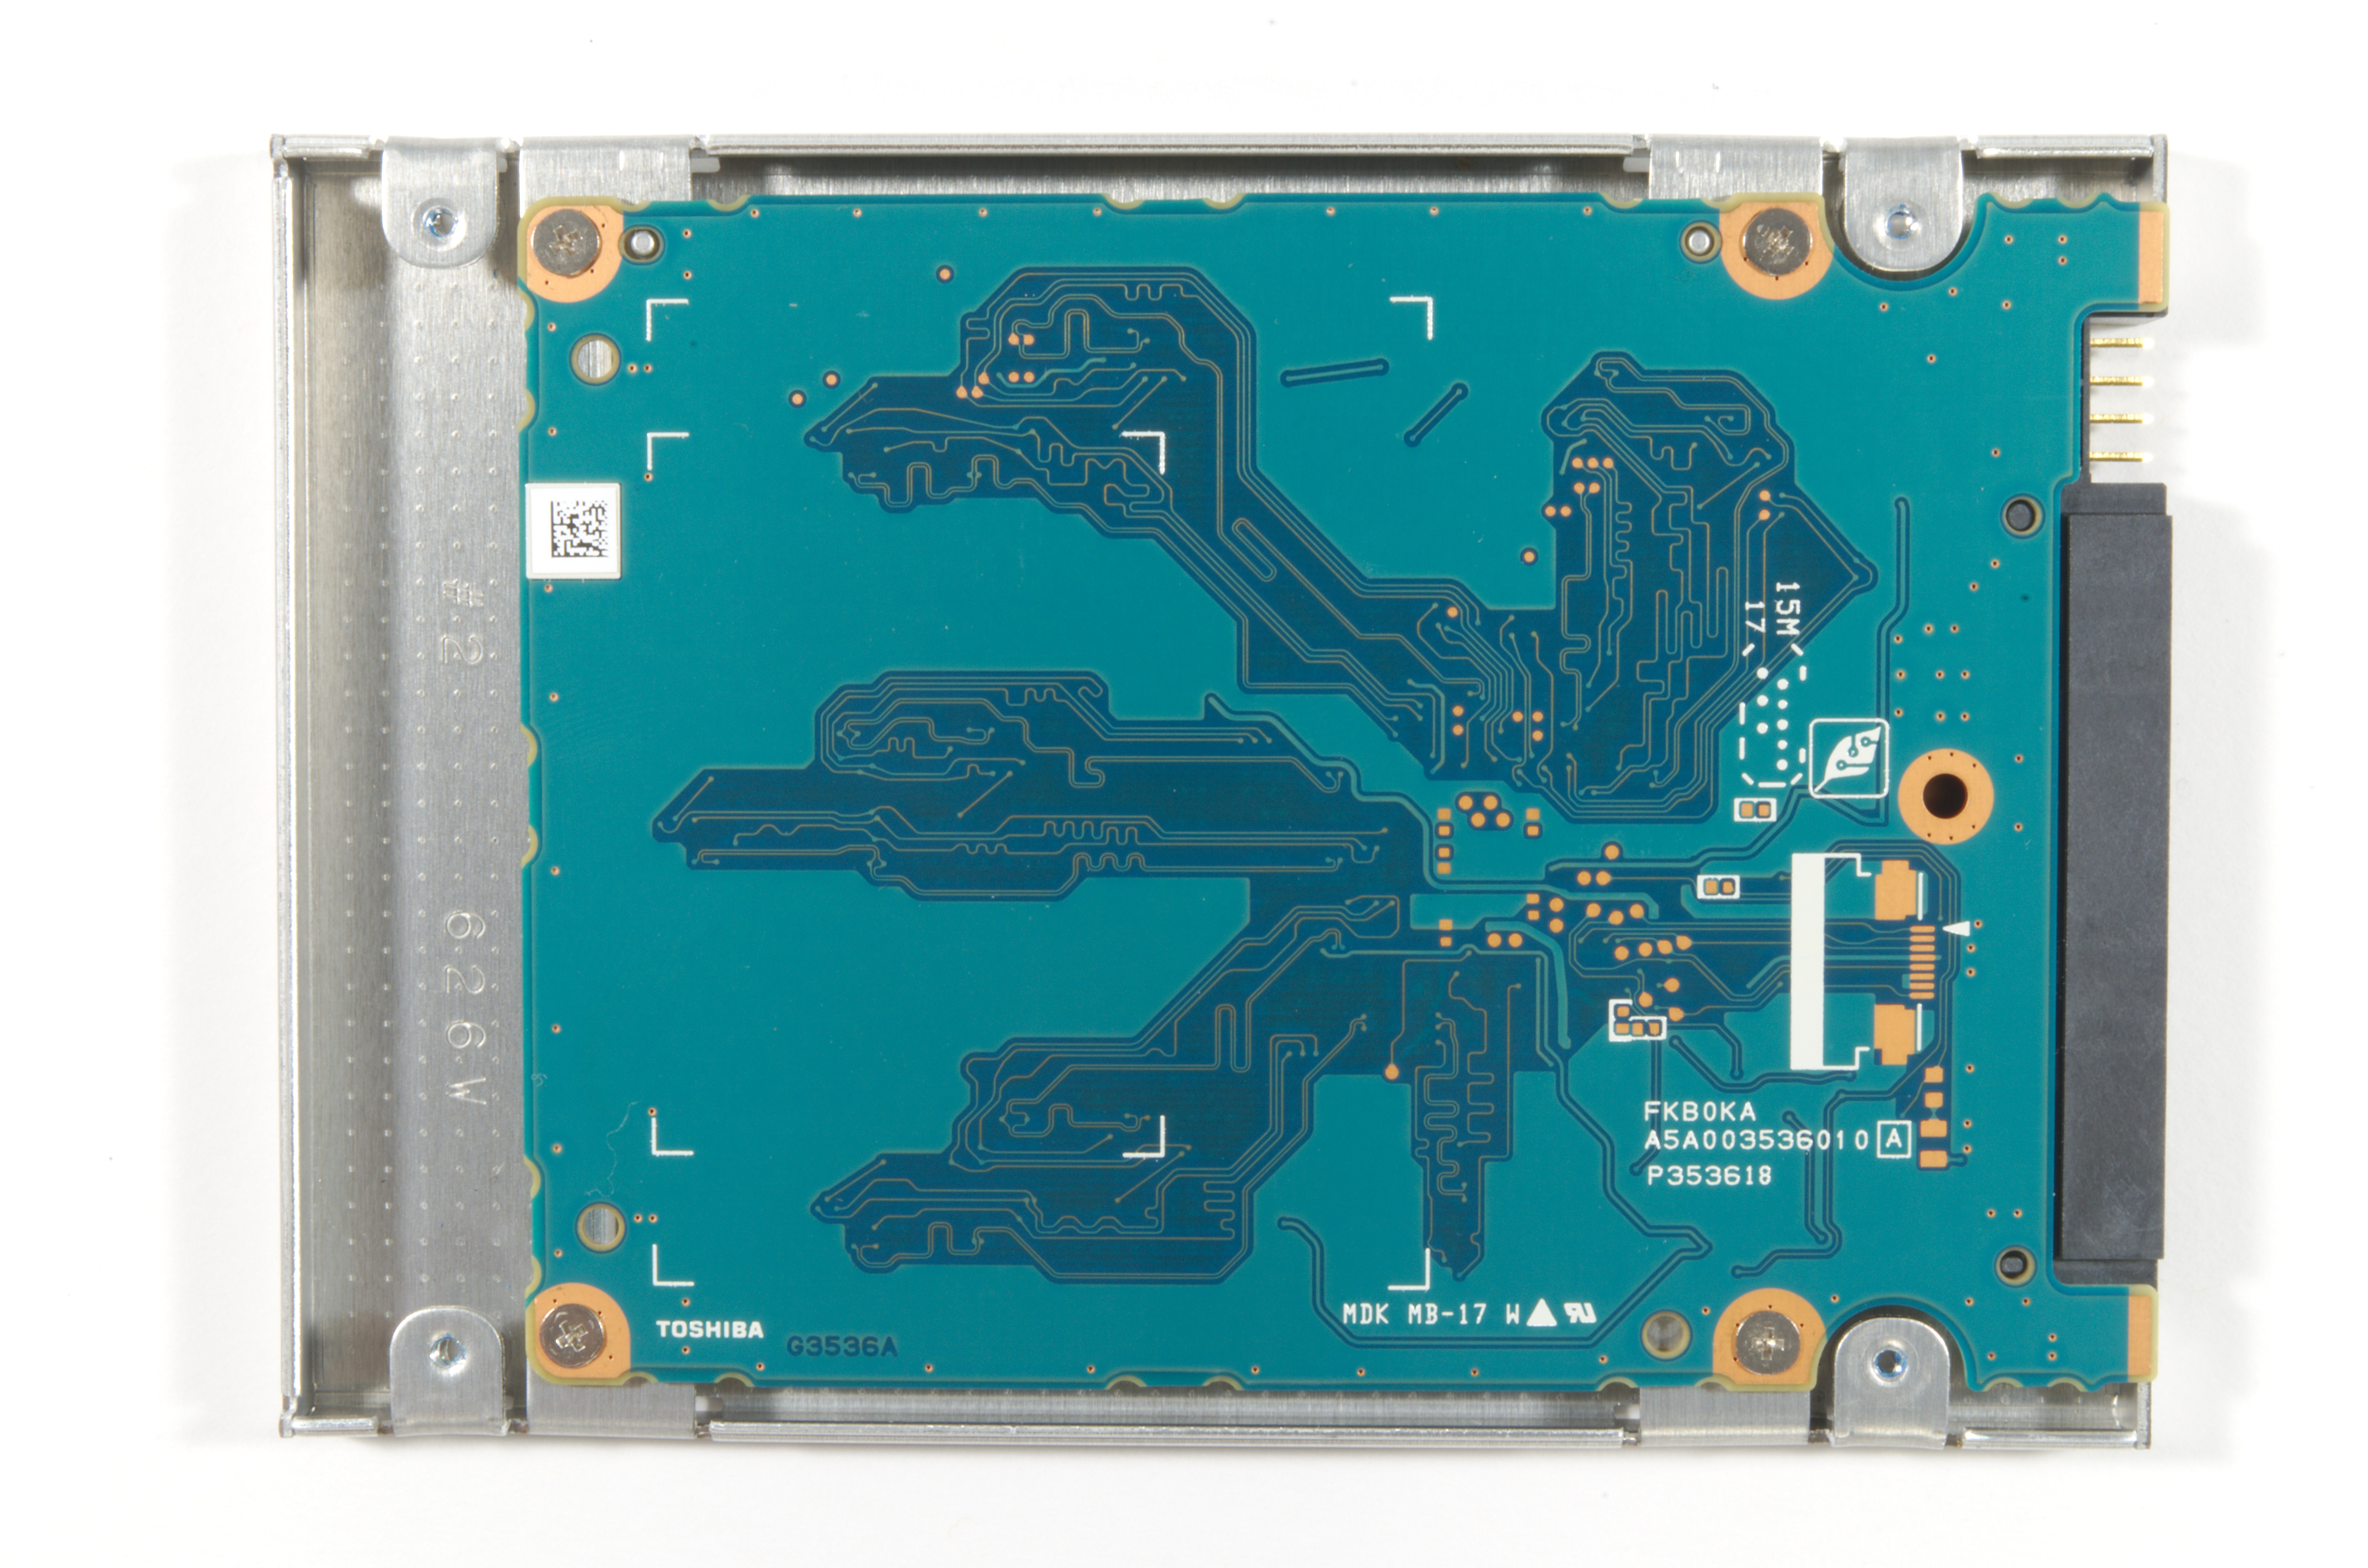


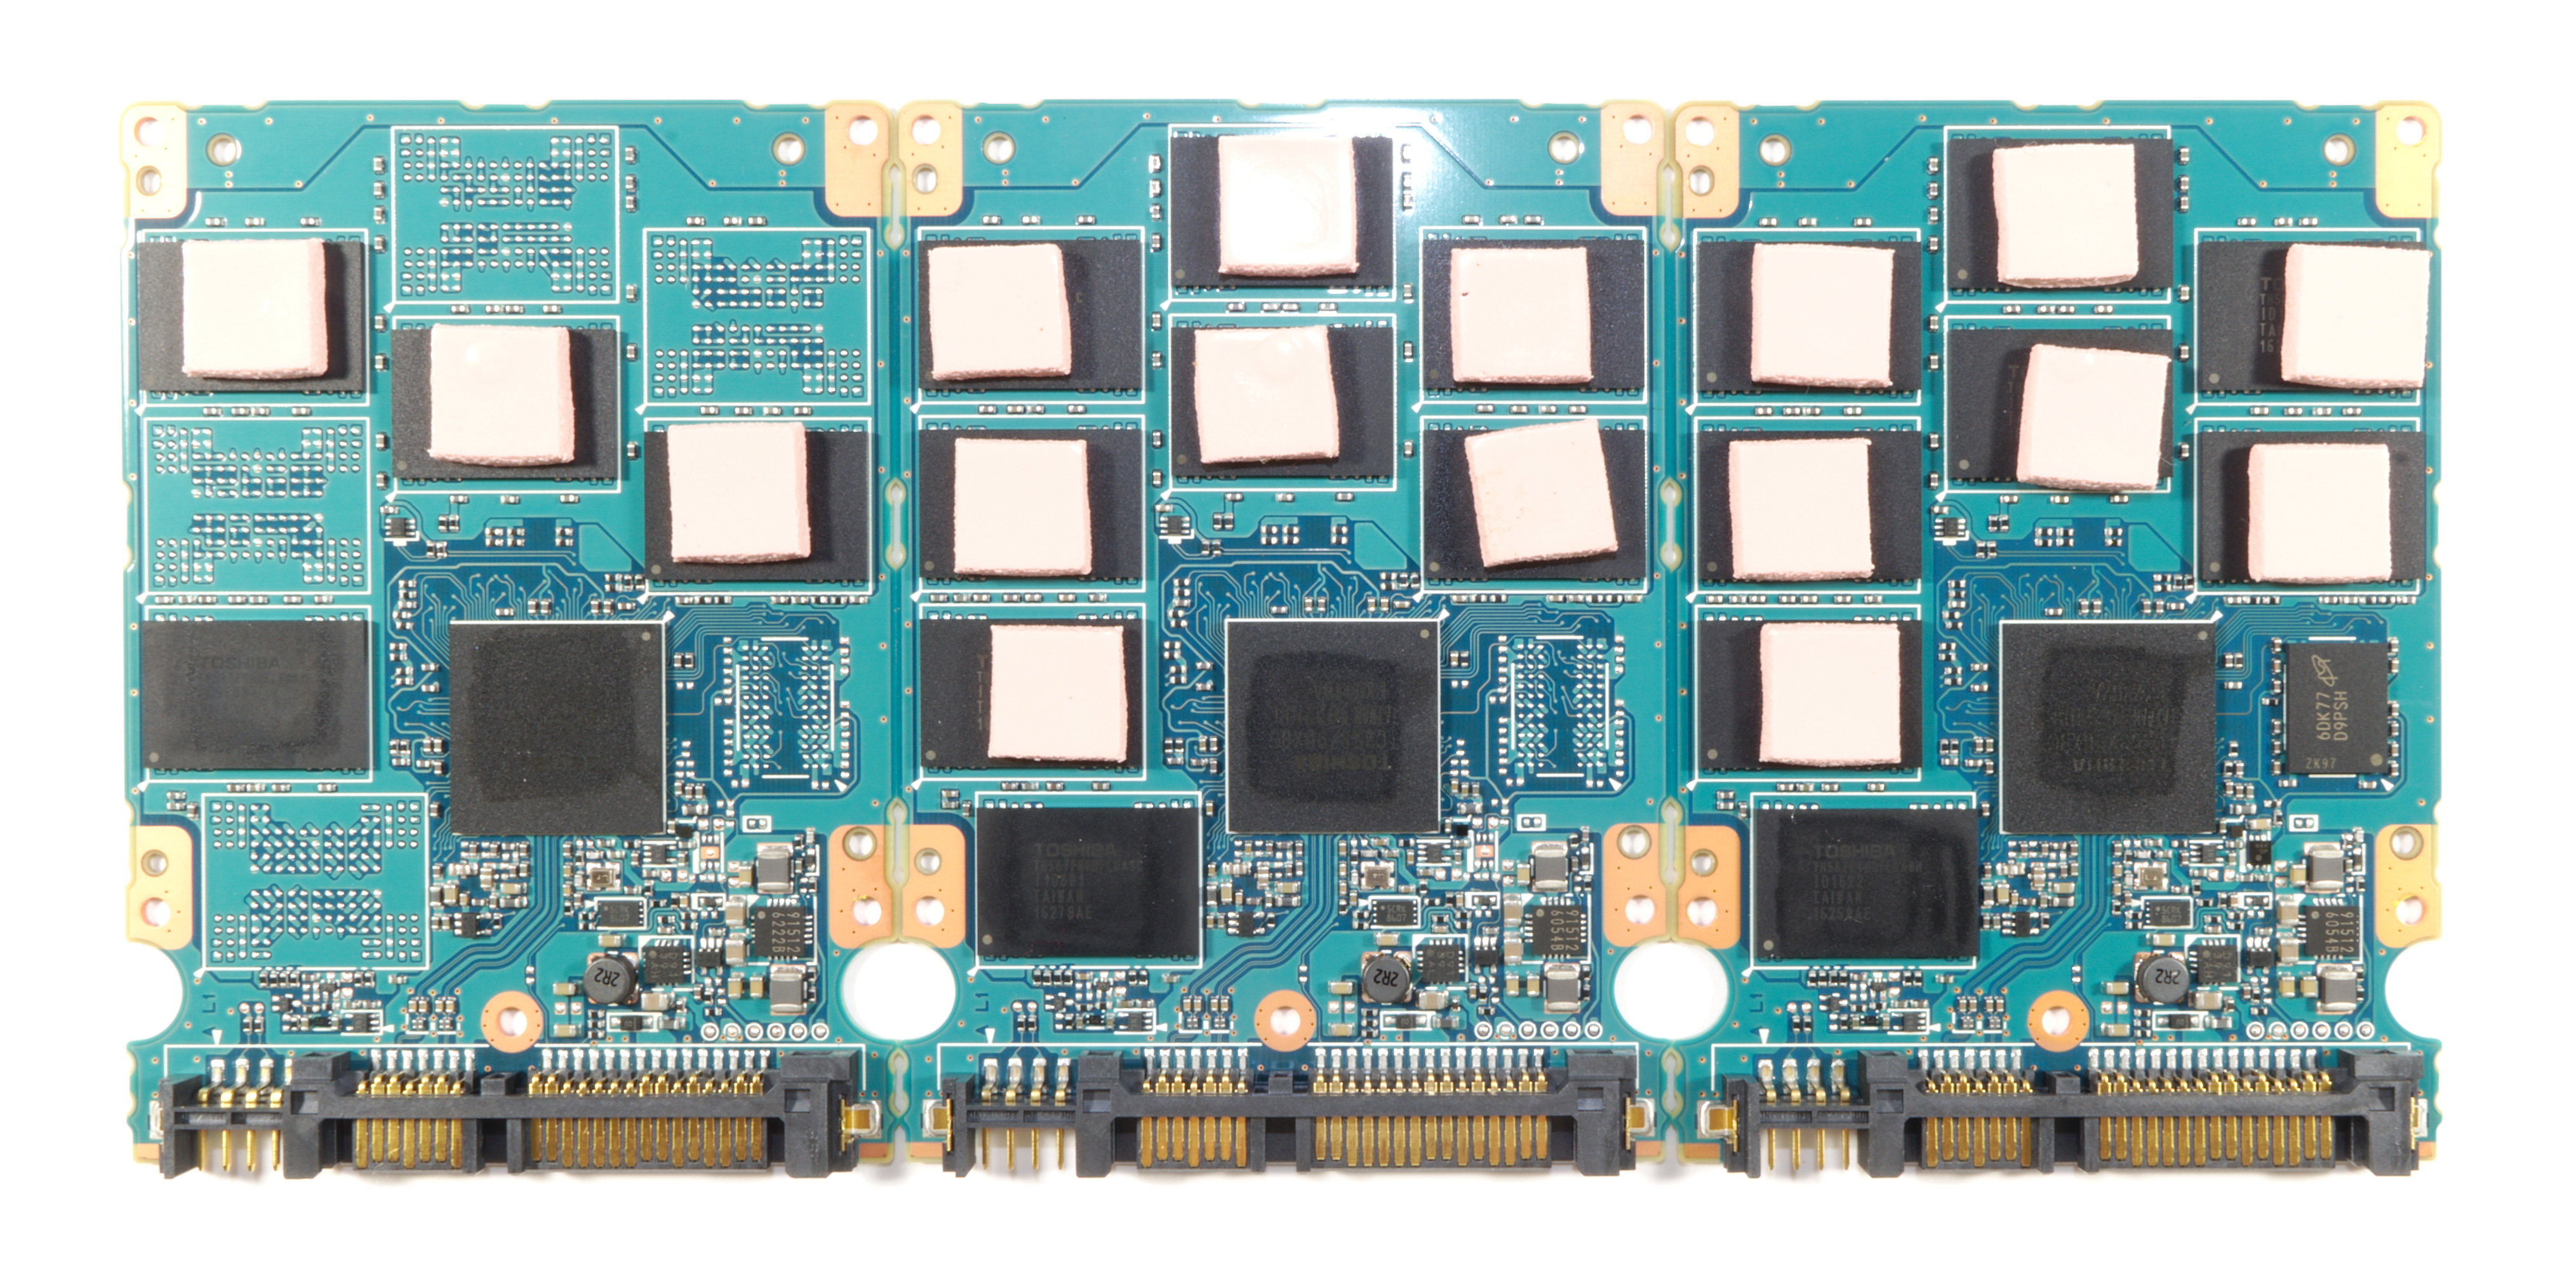
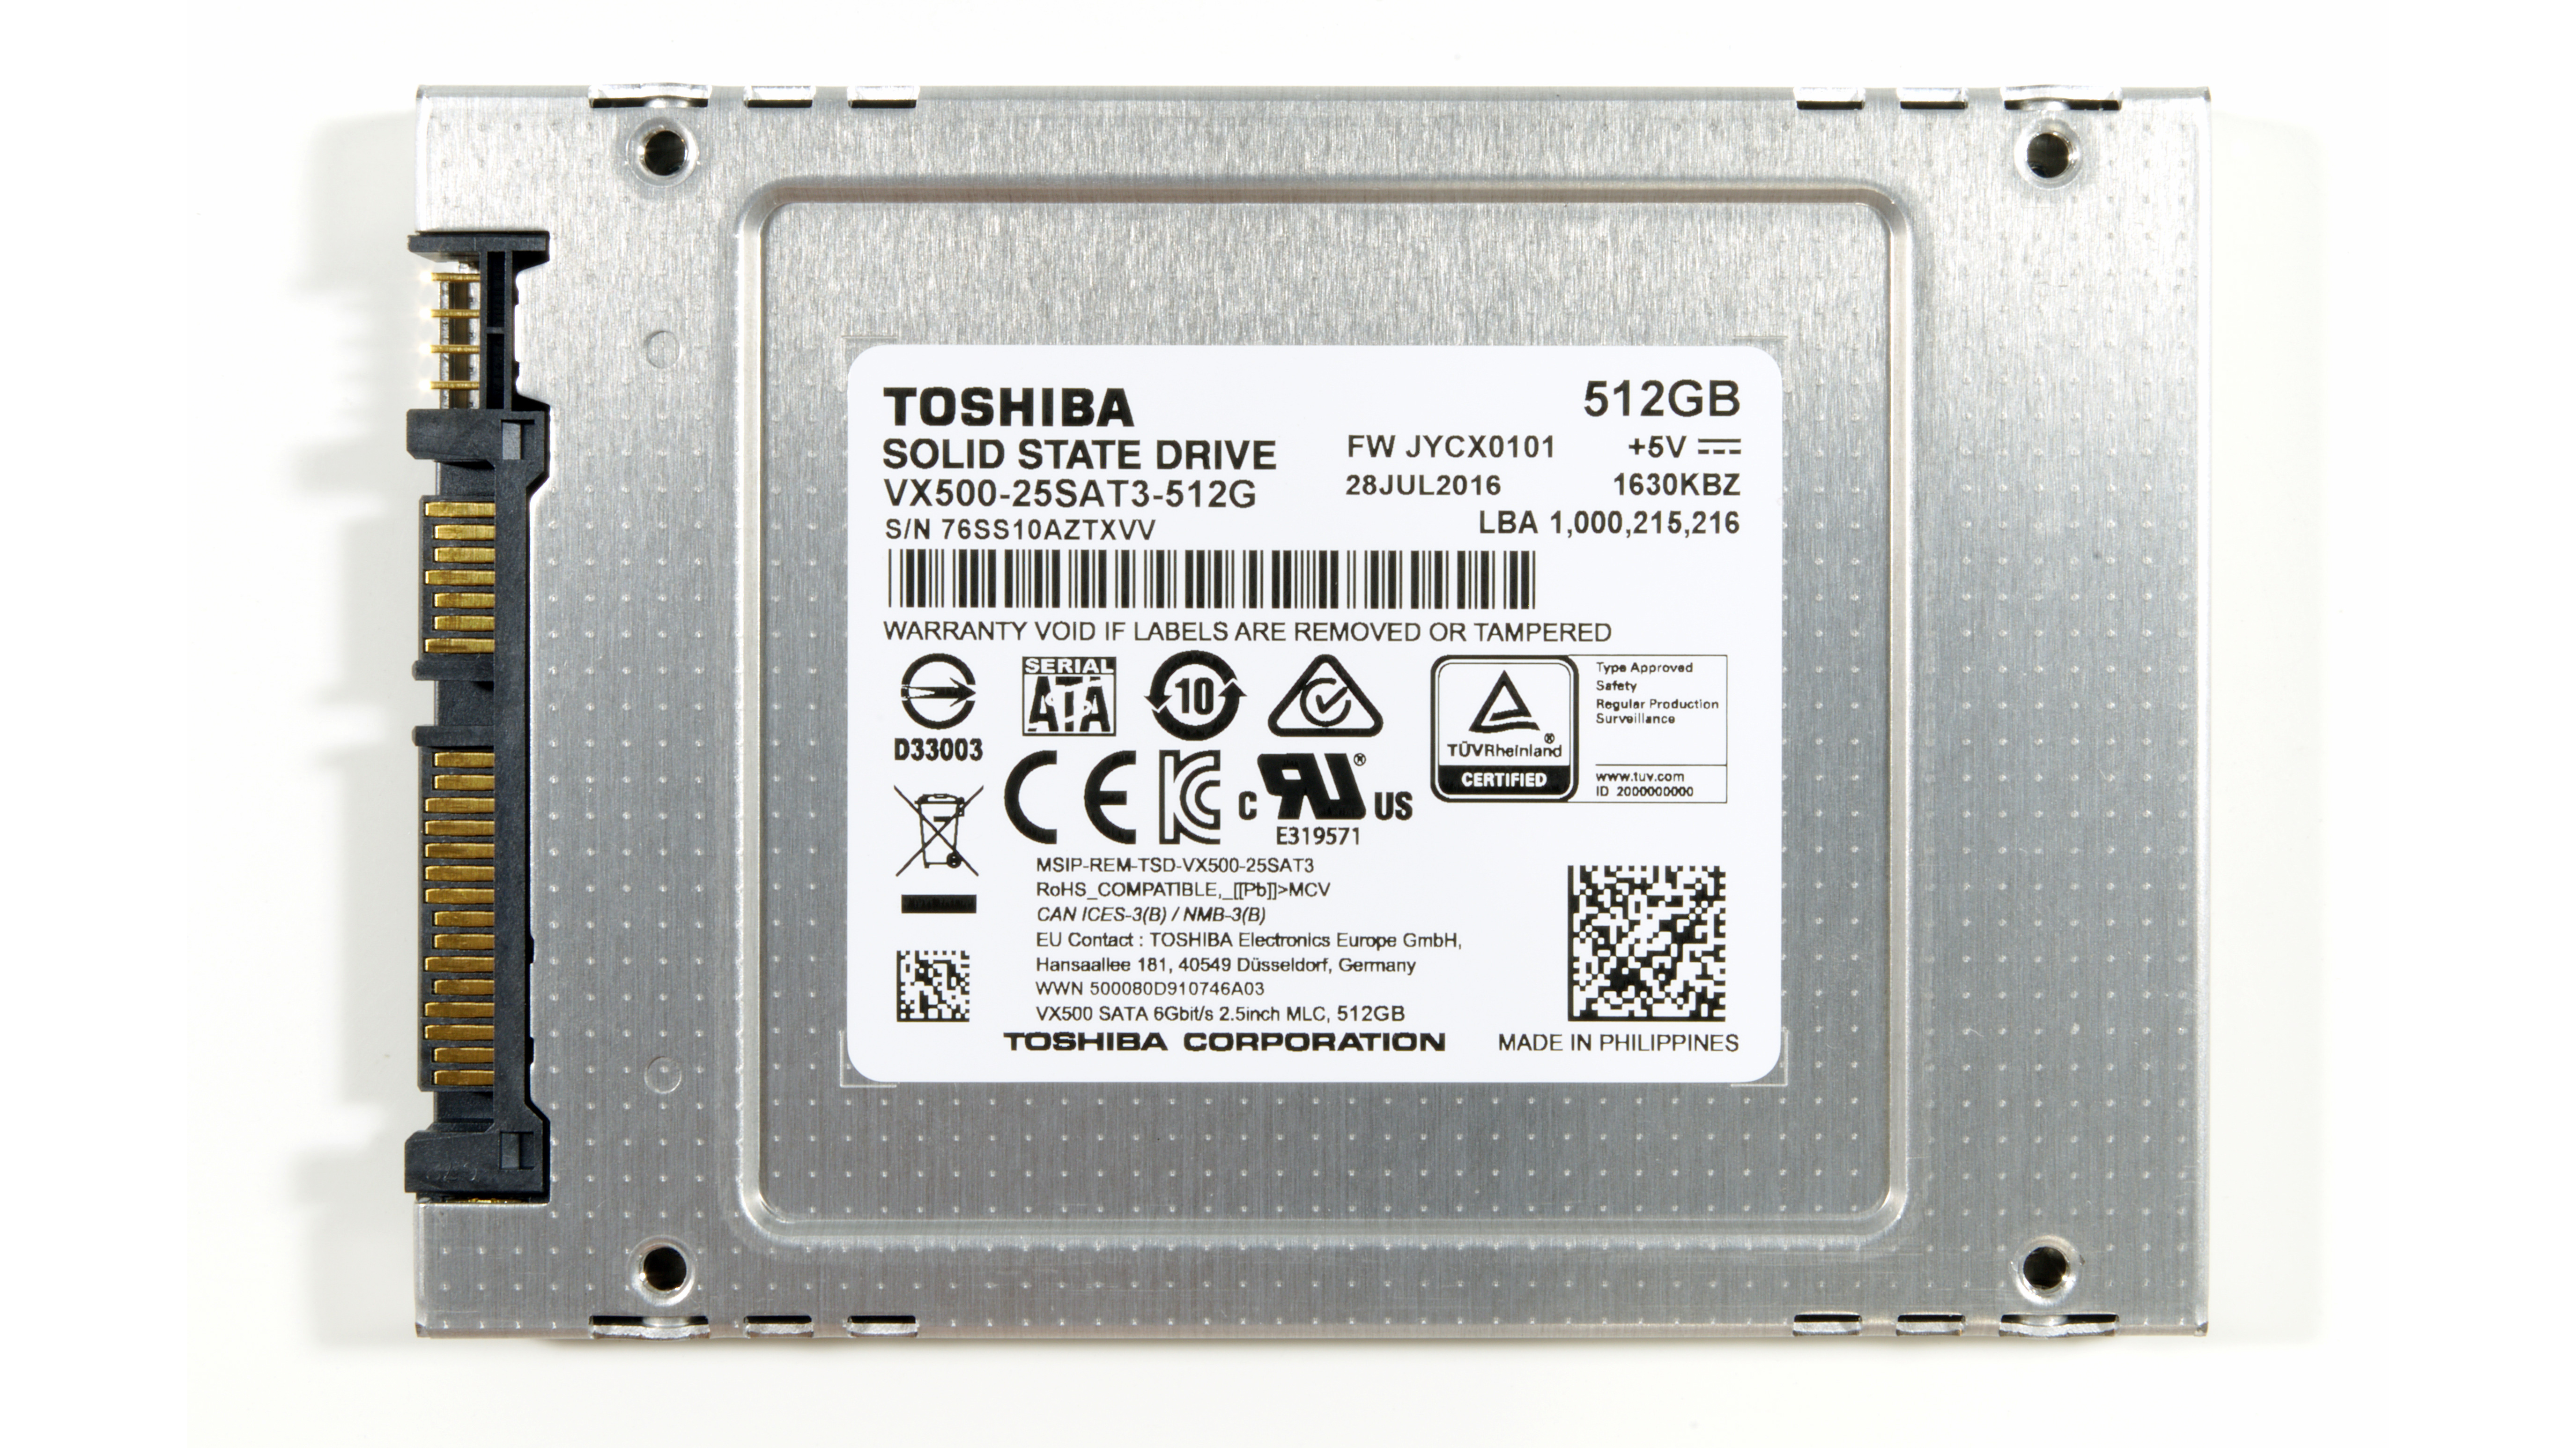
The VX500 is built with the same PCB and case as earlier products based on the same controller. I'm not a fan of the case because its rough edges and corners tend to snag on everything when hot-swapping it between tests, but it's sturdy enough and the all-metal construction ensures there won't be any thermal issues. After fighting past screws that Toshiba used a thread-locking adhesive on, we uncover a single-sided PCB with a thermal pad on the controller and every NAND package. The DRAM on the 1TB model doesn't get a thermal pad. There are no obvious large capacitors, so it appears that the VX500 sacrifices the partial power loss protection the Vector 180 had (protecting only data at rest by preventing NAND mapping table corruption, but not protecting data in flight).
The initial MSRPs Toshiba has set for the VX500 position it below the Vector 180 and just below the Samsung 850 EVO, and both of those comparisons are of the MSRP against current street prices. Toshiba isn't trying to pretend that the VX500 is anything like a flagship product, and there's a good chance it will end up being one of the cheapest planar MLC SSDs once prices settle. Toshiba will be selling a 128GB model, but it is unlikely to get much traction in the retail market, especially with such a high initial MSRP.
MLC NAND is losing popularity with manufacturers in the SATA SSD market, which limits our options for comparisons against contemporary SSDs. There is a recent crop of SSDs using the Phison S10 controller and Toshiba 15nm MLC, represented in this review by the PNY CS2211. The SanDisk Extreme Pro is still hanging around as a high-end SATA option, and the Crucial MX200 is still available but is being replaced by the MX300 based on 3D TLC. For TLC drives we are comparing against the OCZ Trion 150 (now TR150) and the Samsung 850 EVO. Our Bench database can be used to make comparisons against other drives we have tested.
| AnandTech 2015 SSD Test System | |
| CPU | Intel Core i7-4770K running at 3.5GHz (Turbo & EIST enabled, C-states disabled) |
| Motherboard | ASUS Z97 Pro (BIOS 2701) |
| Chipset | Intel Z97 |
| Memory | Corsair Vengeance DDR3-1866 2x8GB (9-10-9-27 2T) |
| Graphics | Intel HD Graphics 4600 |
| Desktop Resolution | 1920 x 1200 |
| OS | Windows 8.1 x64 |
- Thanks to Intel for the Core i7-4770K CPU
- Thanks to ASUS for the Z97 Deluxe motherboard
- Thanks to Corsair for the Vengeance 16GB DDR3-1866 DRAM kit, RM750 power supply, Carbide 200R case, and Hydro H60 CPU cooler
Performance Consistency
Our performance consistency test explores the extent to which a drive can reliably sustain performance during a long-duration random write test. Specifications for consumer drives typically list peak performance numbers only attainable in ideal conditions. The performance in a worst-case scenario can be drastically different as over the course of a long test drives can run out of spare area, have to start performing garbage collection, and sometimes even reach power or thermal limits.
In addition to an overall decline in performance, a long test can show patterns in how performance varies on shorter timescales. Some drives will exhibit very little variance in performance from second to second, while others will show massive drops in performance during each garbage collection cycle but otherwise maintain good performance, and others show constantly wide variance. If a drive periodically slows to hard drive levels of performance, it may feel slow to use even if its overall average performance is very high.
To maximally stress the drive's controller and force it to perform garbage collection and wear leveling, this test conducts 4kB random writes with a queue depth of 32. The drive is filled before the start of the test, and the test duration is one hour. Any spare area will be exhausted early in the test and by the end of the hour even the largest drives with the most overprovisioning will have reached a steady state. We use the last 400 seconds of the test to score the drive both on steady-state average writes per second and on its performance divided by the standard deviation.
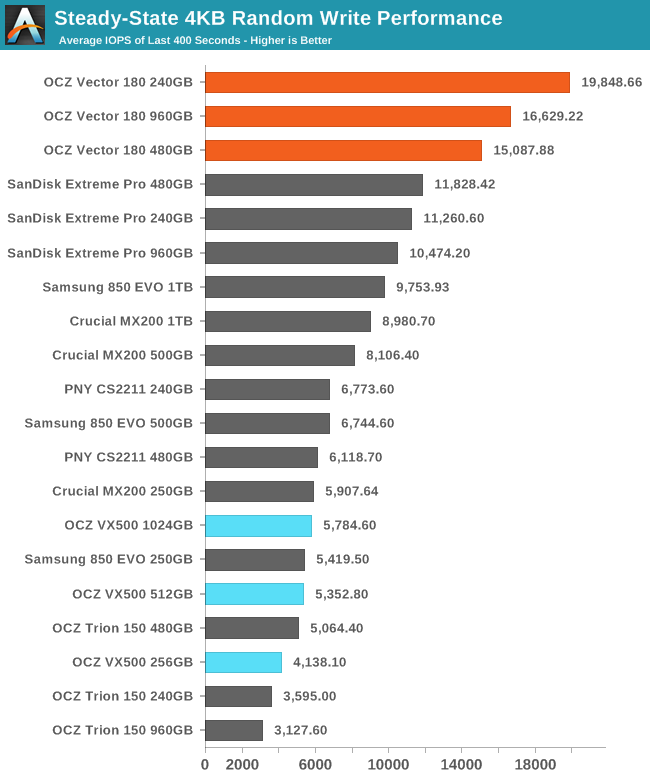
No consumer SATA drive sustains better random write IOPS than the Vector 180, while the VX500 is slower than most MLC drives.
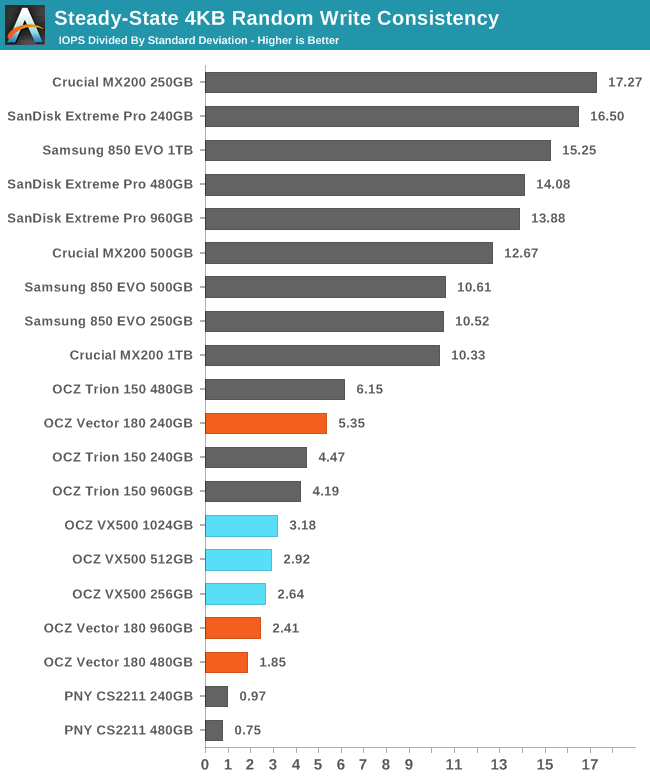
The Barefoot 3 controller wasn't great for consistency in spite of its high overall performance, so the Vector 180 and VX500 end up with relatively similar scores, and both have lots of room for improvement.
 |
|||||||||
| Default | |||||||||
| 25% Over-Provisioning | |||||||||
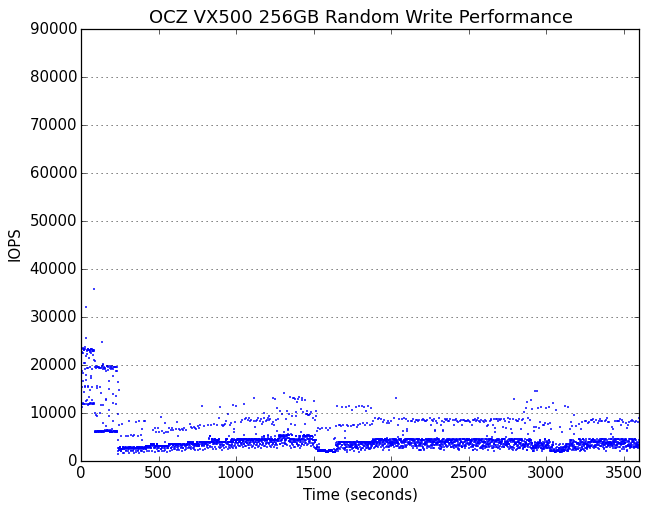
The VX500 goes through two distinct performance phases before reaching steady-state. During those early phases it maintains relatively good minimum performance, in stark contrast to the severe stuttering the Vector 180 showed throughout this test, especially for the larger capacities.
With extra manual overprovisioning, the VX500 goes through several more phase transitions but always maintains decent performance.
 |
|||||||||
| Default | |||||||||
| 25% Over-Provisioning | |||||||||
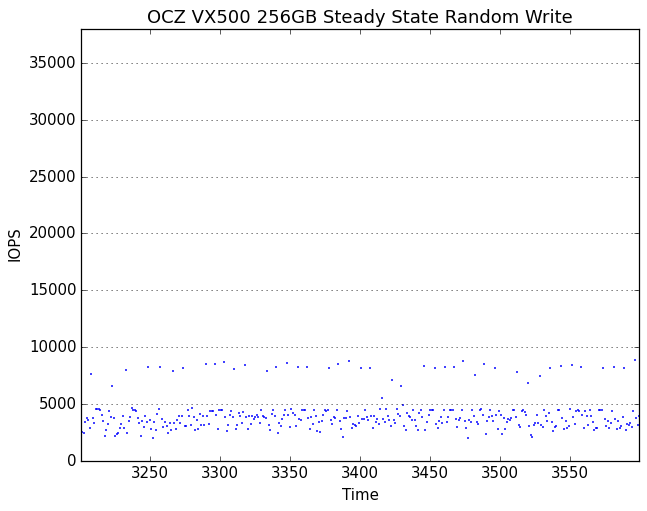
The steady state write performance of the VX500 is confined mostly to a band around 3k-5k IOPS with frequent outliers up to about twice that speed. With extra overprovisioning, the steady state is clearly better than that of the Phison-based PNY CS2211 but not as fast or consistent as the flagship MLC drives from Samsung and SanDisk.
AnandTech Storage Bench - The Destroyer
The Destroyer is an extremely long test replicating the access patterns of very IO-intensive desktop usage. A detailed breakdown can be found in this article. Like real-world usage and unlike our Iometer tests, the drives do get the occasional break that allows for some background garbage collection and flushing caches, but those idle times are limited to 25ms so that it doesn't take all week to run the test.
We quantify performance on this test by reporting the drive's average data throughput, a few data points about its latency, and the total energy used by the drive over the course of the test.
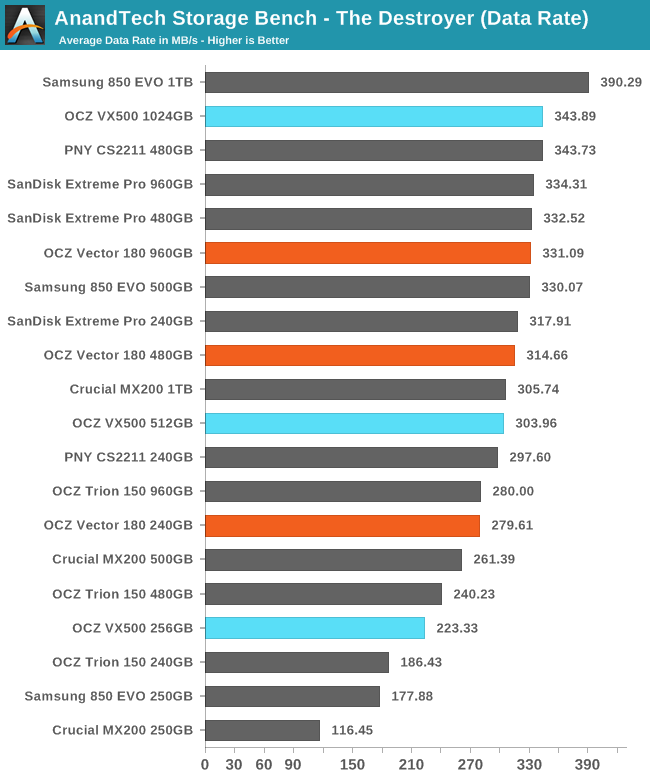
The 1TB VX500 delivers a slightly better average data rate than the Vector 180, but is still significantly slower than Samsung's 850 EVO, let alone the 850 Pro. The smaller two capacities of the VX500 are slower than the Vector 180, with the 256GB VX500 about 20% slower than the 240GB Vector 180.
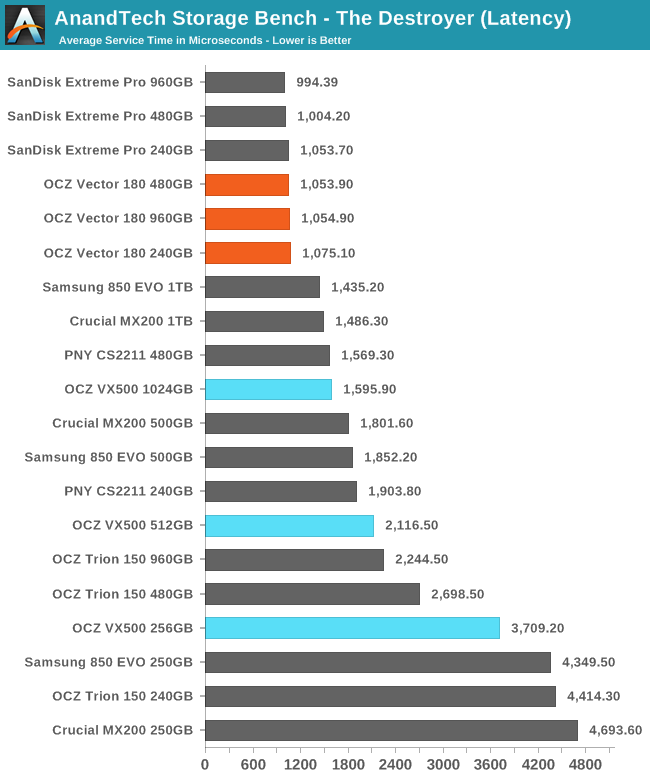
The average service time of the VX500 is relatively poor for an MLC drive, but still significantly better than planar TLC drives. The Vector 180 had top-notch latency with little dependence on capacity.
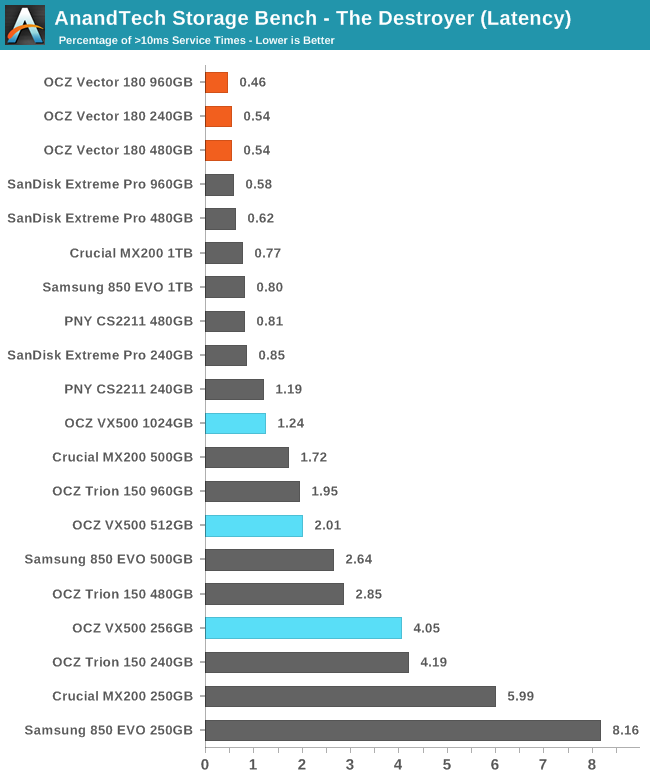
The number of latency outliers above the 10ms threshold ranks the VX500 below almost all MLC drives. The Crucial MX200 also performed poorly here; in both cases it is likely due to the use of an SLC cache (which is relatively rare for MLC drives) that is swamped by this long-duration test.
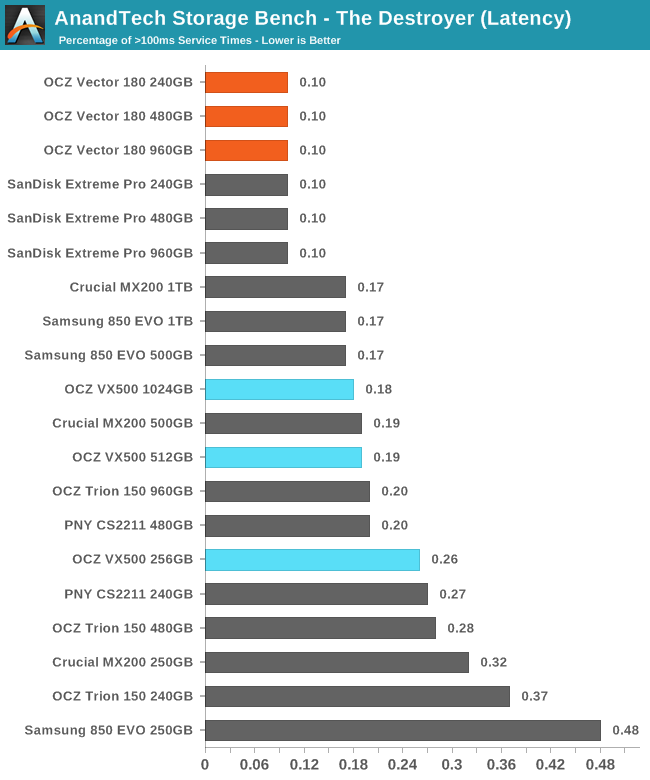
At the 100ms threshold the VX500 has a typical number of latency outliers for a budget MLC drive, but this is a significant step back from what the Vector 180 could do.
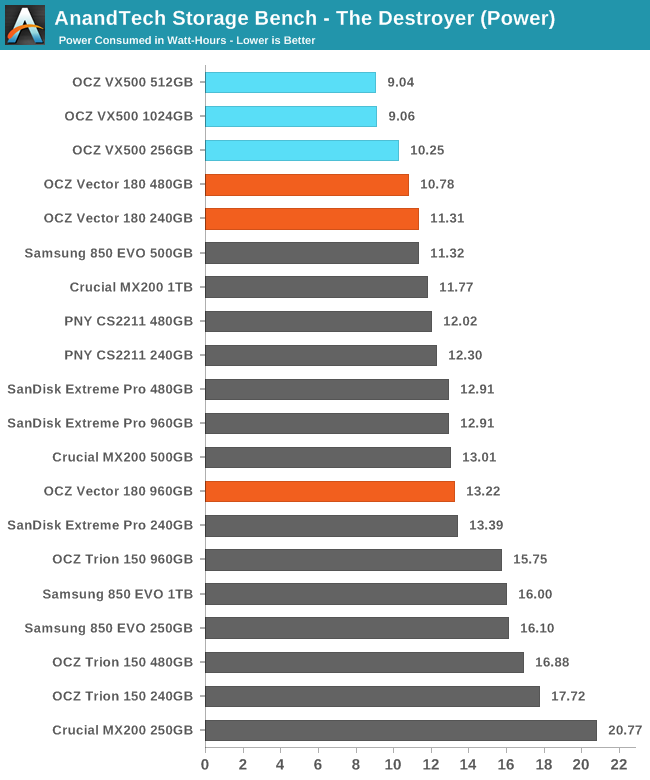
In spite of mediocre performance, the VX500 has great energy efficiency that is competitive with 3D NAND and close to the record set by the Crucial BX100.
AnandTech Storage Bench - Heavy
Our Heavy storage benchmark is proportionally more write-heavy than The Destroyer, but much shorter overall. The total writes in the Heavy test aren't enough to fill the drive, so performance never drops down to steady state. This test is far more representative of a power user's day to day usage, and is heavily influenced by the drive's peak performance. The Heavy workload test details can be found here.
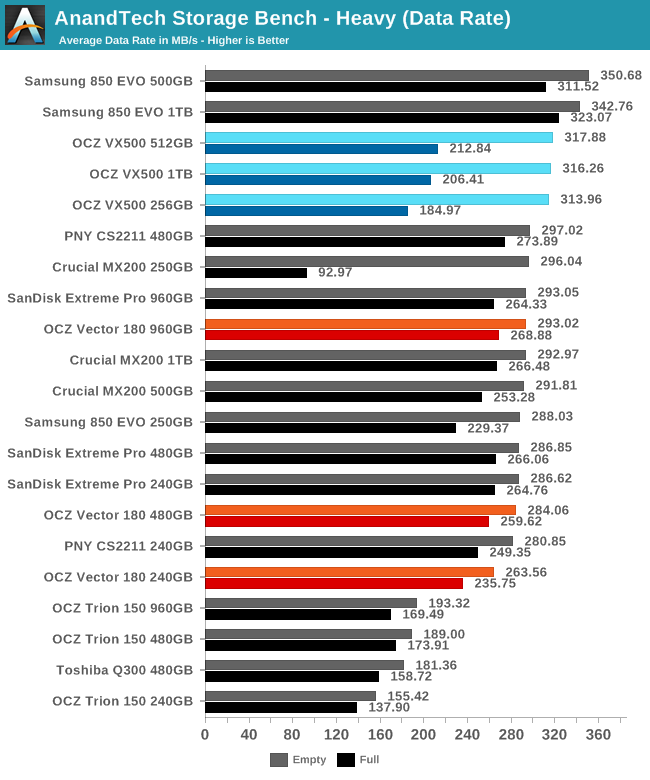
When starting from an empty drive, the VX500 delivers a great average data rate on the Heavy test, second only to Samsung's 850 EVO and 850 Pro. When starting from a full drive, the VX500 suffers greatly as its SLC caching is not well-tuned for this kind of abuse.
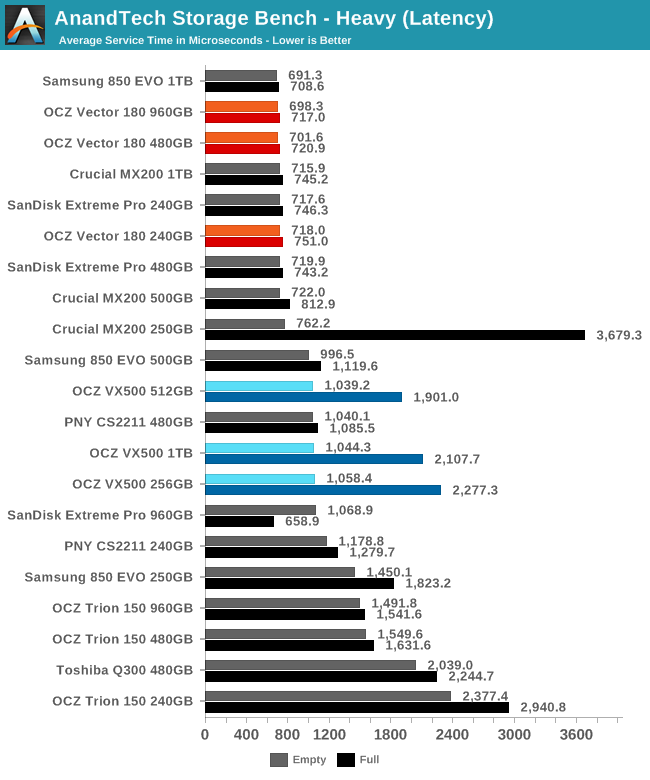
The average service times of the VX500 aren't the best in the empty-drive case, but aren't anything to complain about. The penalty from running the test on a full drive is extremely clear as latency is roughly doubled.
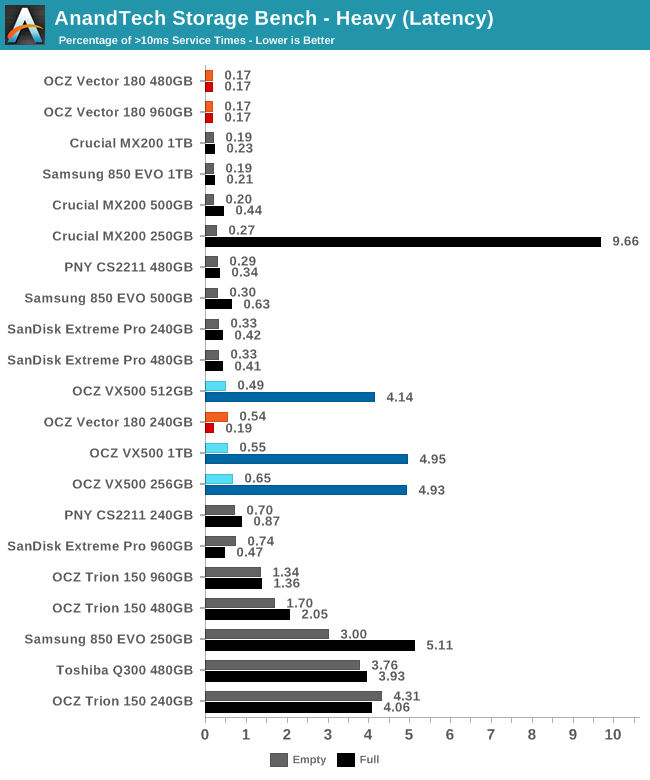
The percentage of high-latency operations shows once again that stressing the SLC cache and garbage collection with a full drive causes trouble, but the performance for the more common case of a lightly-used drive with ample spare area is fine.
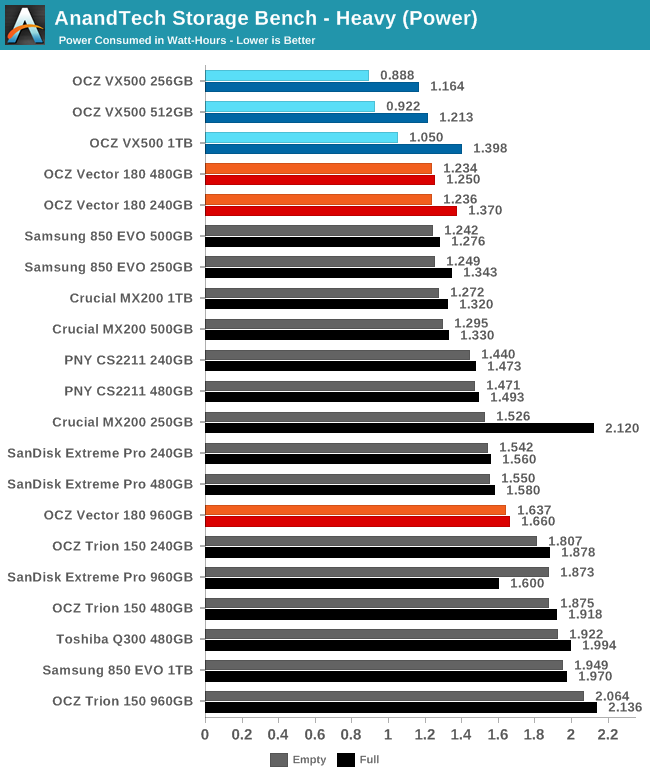
Energy efficiency is once again a strength of the VX500, even for the full-drive tests—it runs slower in that case, but doesn't drag out the test for so long that the faster but higher power drives come out ahead for total energy.
AnandTech Storage Bench - Light
Our Light storage test has relatively more sequential accesses and lower queue depths than The Destroyer or the Heavy test, and it's by far the shortest test overall. It's based largely on applications that aren't highly dependent on storage performance, so this is a test more of application launch times and file load times. This test can be seen as the sum of all the little delays in daily usage, but with the idle times trimmed to 25ms it takes less than half an hour to run. Details of the Light test can be found here.
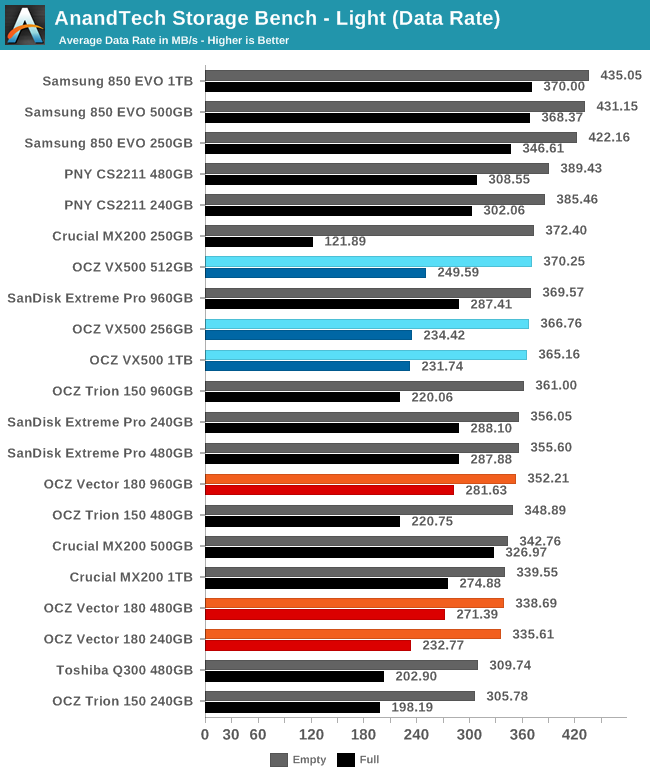
As compared with the Heavy test, more drives are able to offer peak performance that makes them competitive. The VX500 is not only slower than Samsung's 850 EVO and Pro, but it is also slightly slower than the Phison S10-based PNY CS2211. On the other hand, the full-drive penalty doesn't look as egregious in this test and is less severe than what most TLC drives suffer.
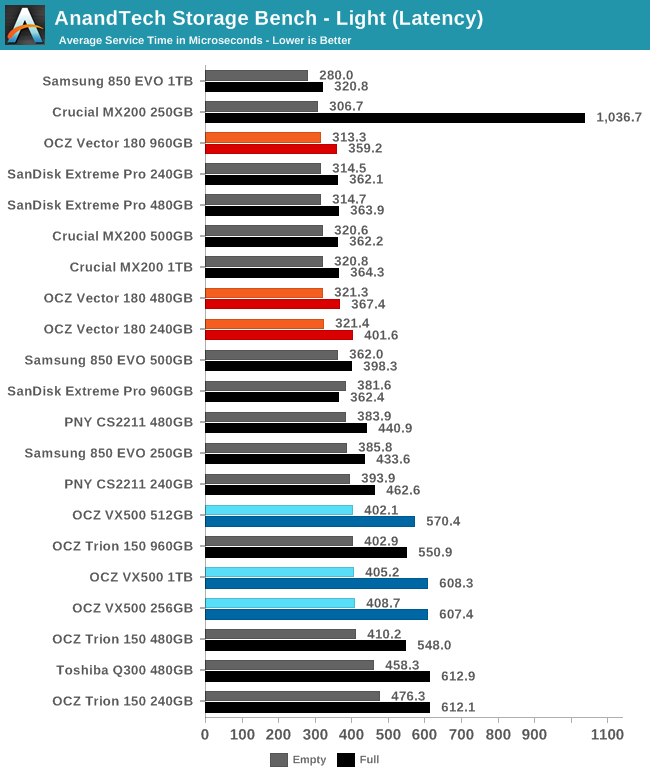
The spread of average service time scores is narrow, so the fact that the VX500 lands near the bottom of the chart isn't saying much. The full-drive average service time ends up less than twice that of the best drive's score.
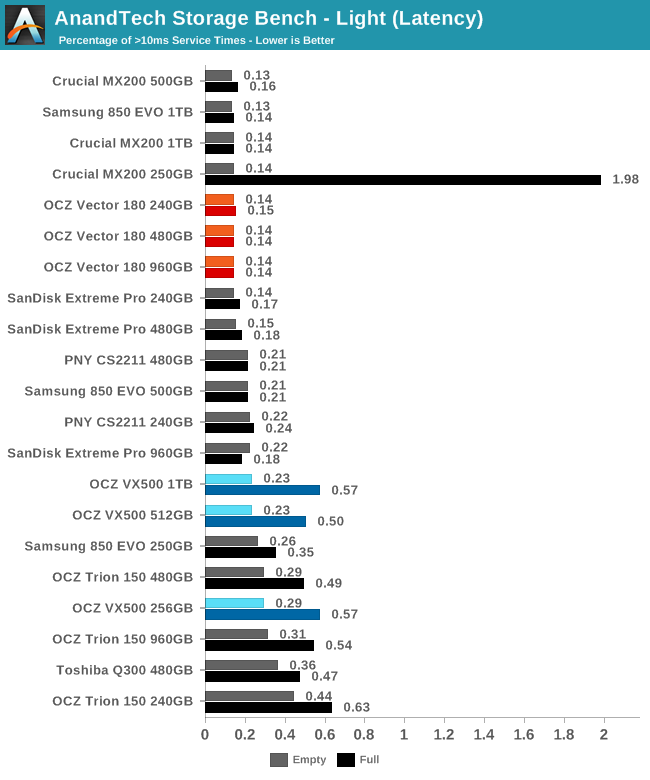
The number of latency outliers could be better in the full-drive case, but it's not a big problem. The 250GB Crucial MX200 showed that SLC caching can backfire much worse, while the VX500 simply degrades down to the level of a budget TLC SSD.
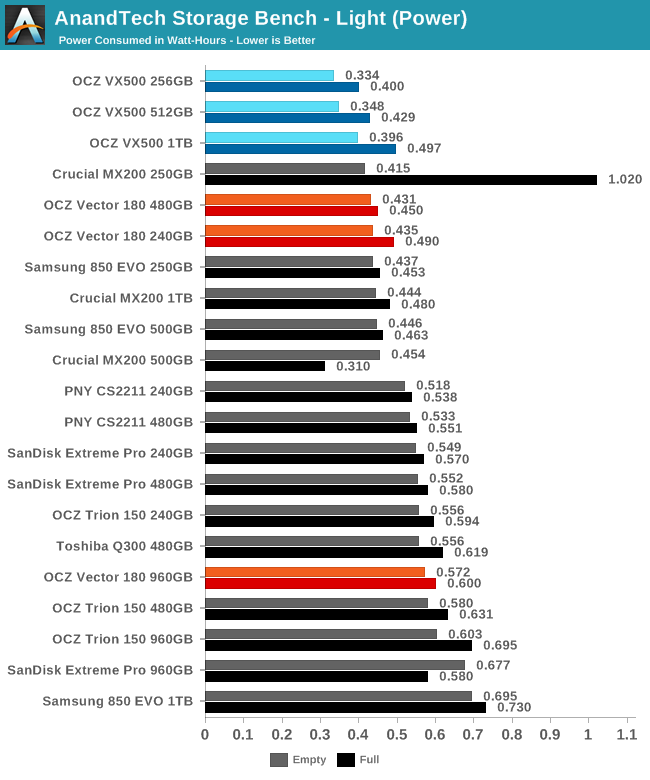
Power efficiency of the VX500 continues to be great even when it is not performing at its best.
Random Read Performance
The random read test requests 4kB blocks and tests queue depths ranging from 1 to 32. The queue depth is doubled every three minutes, for a total test duration of 18 minutes. The test spans the entire drive, which is filled before the test starts. The primary score we report is an average of performances at queue depths 1, 2 and 4, as client usage typically consists mostly of low queue depth operations.
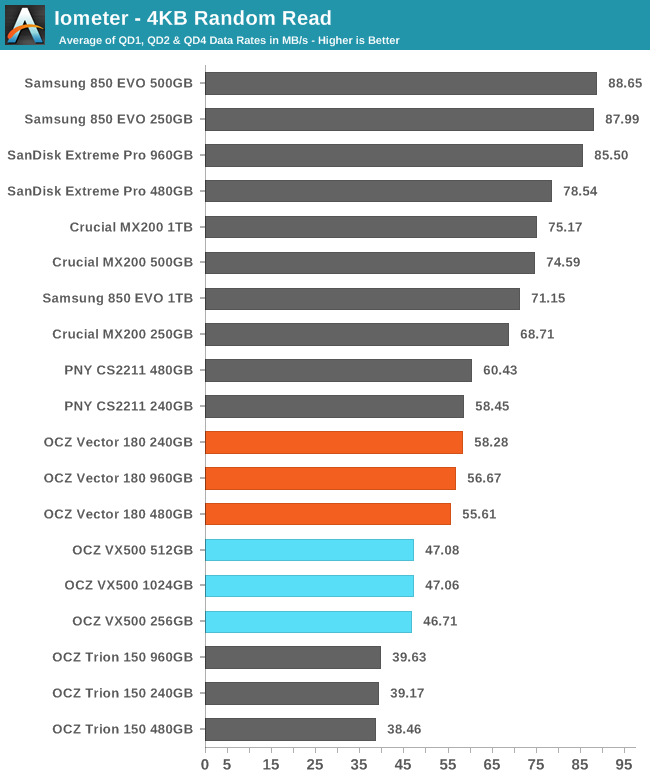
The random read speed of the VX500 is significantly slower than the Vector 180, to the point that some planar TLC SSDs are slightly faster, but it is still ahead of the Trion 150.
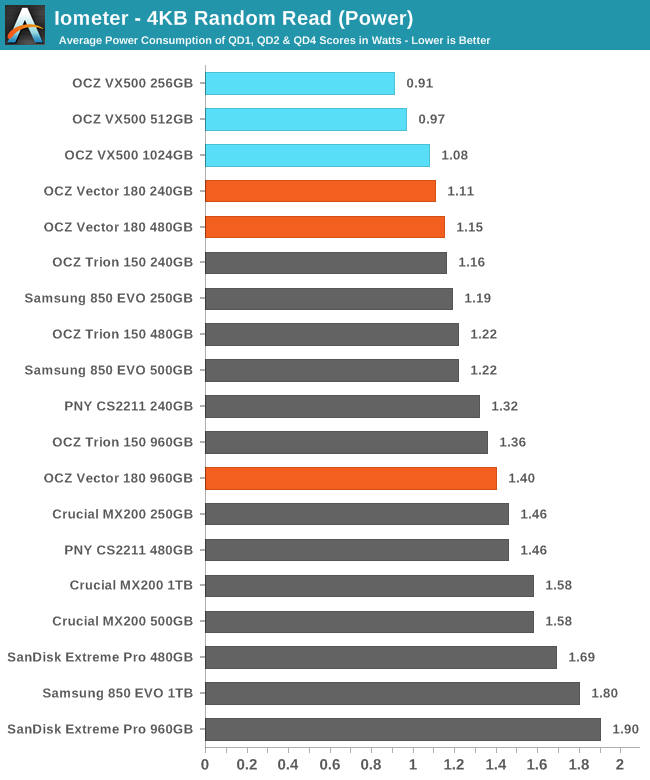
Power consumption during random reads is low enough that the VX500 maintains approximately the same load efficiency of the Vector 180 despite the speed disadvanatge.
 |
|||||||||
The VX500's performance scales well with queue depth but doesn't quite hit the level the Samsung 850 EVO and a few other drives top out at.
Random Write Performance
The random write test writes 4kB blocks and tests queue depths ranging from 1 to 32. The queue depth is doubled every three minutes, for a total test duration of 18 minutes. The test is limited to a 16GB portion of the drive, and the drive is empty save for the 16GB test file. The primary score we report is an average of performances at queue depths 1, 2 and 4, as client usage typically consists mostly of low queue depth operations.
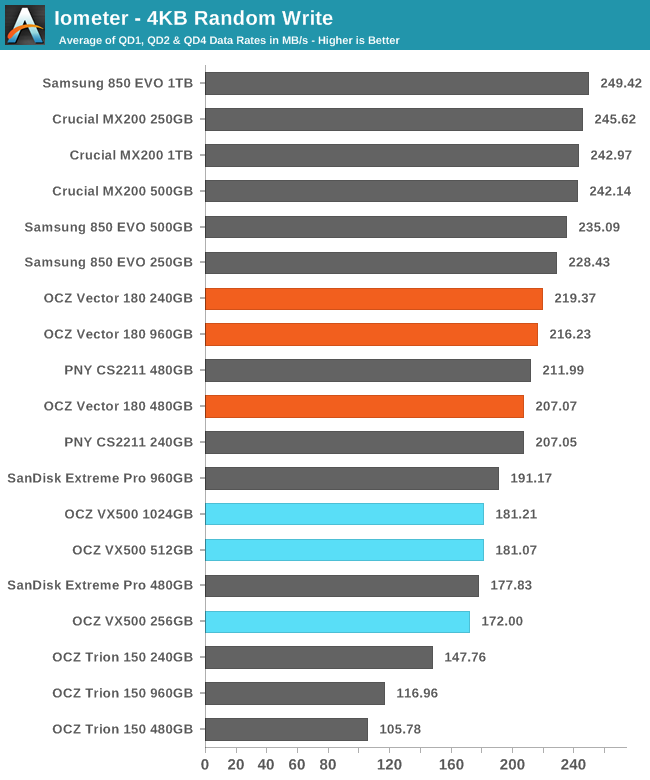
While the Vector 180 dominated the hour-long random write consistency test, it is only average on this shorter test of lower queue depths. The VX500 falls behind, but is still in the typical range for MLC SSDs.
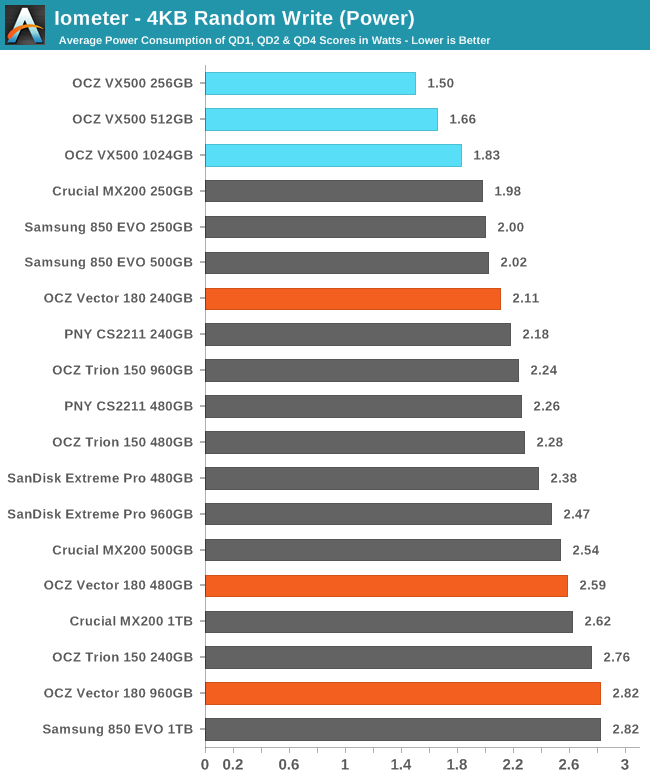
Power consumption of the VX500 is once again quite low, representing a significant improvement in efficiency over the Vector 180 and a good overall efficiency score.
 |
|||||||||
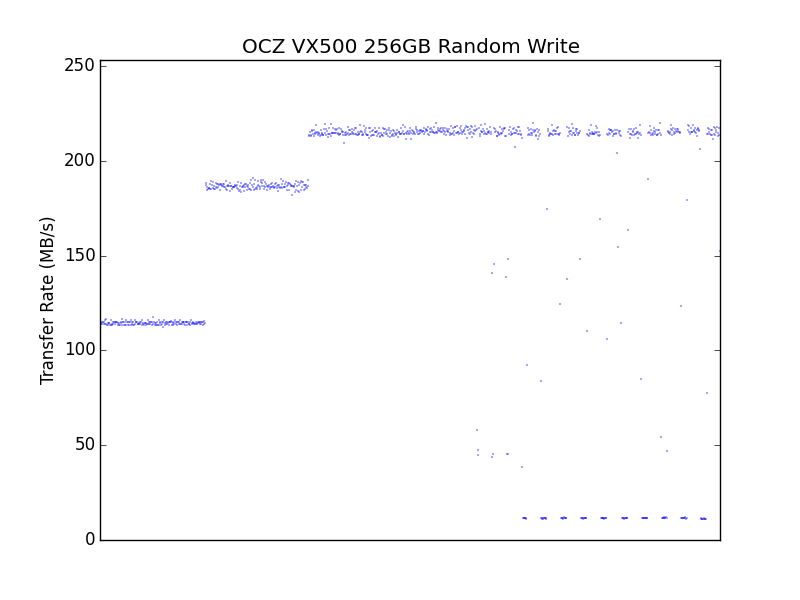
The VX500 random write performance plateaus at queue depth 4 instead of continuing toward high peak numbers, but this hardly matters for typical client workloads. The 256GB model also begins its transition from burst performance toward steady state before the test is complete and begins to stutter:
Sequential Read Performance
The sequential read test requests 128kB blocks and tests queue depths ranging from 1 to 32. The queue depth is doubled every three minutes, for a total test duration of 18 minutes. The test spans the entire drive, and the drive is filled before the test begins. The primary score we report is an average of performances at queue depths 1, 2 and 4, as client usage typically consists mostly of low queue depth operations.
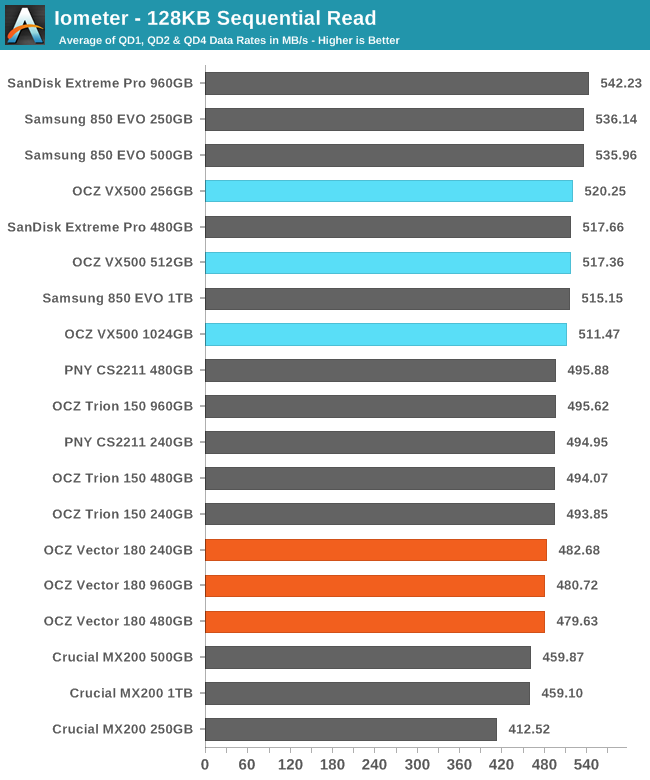
The VX500 delivers very good sequential read performance, in the same league as the Samsung 850 EVO and SanDisk Extreme Pro. Because the spread of scores on this test is so small, this only represents a slight improvement over the Vector 180.
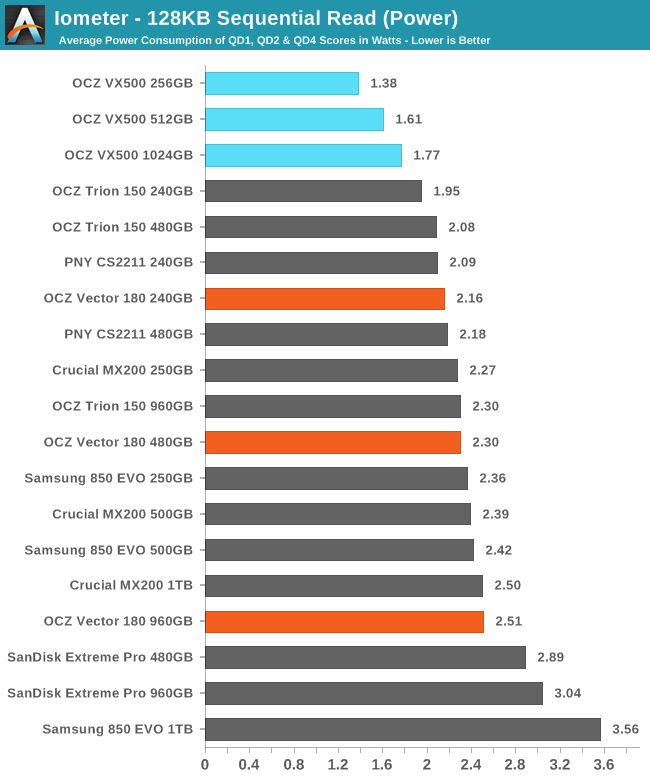
Power consumption is quite a bit lower than the competition and efficiency is again near record levels.
 |
|||||||||
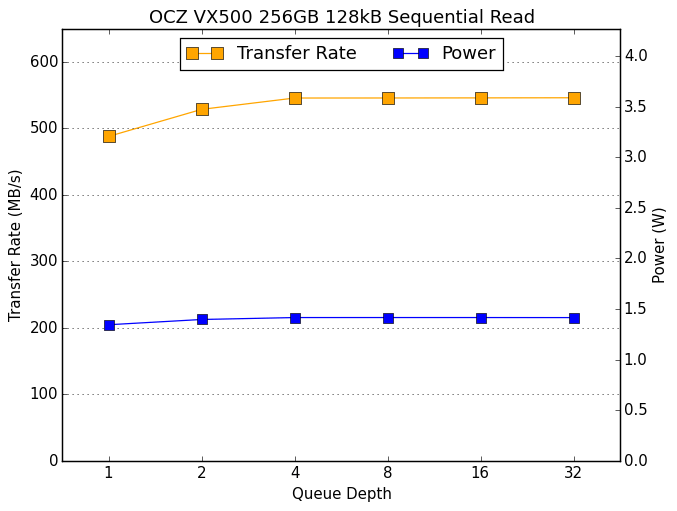
The VX500 starts out with very good QD1 performance and very little room for improvement. It reaches the limit of the SATA interface by QD4, and power consumption is nearly constant across the whole test.
Sequential Write Performance
The sequential write test writes 128kB blocks and tests queue depths ranging from 1 to 32. The queue depth is doubled every three minutes, for a total test duration of 18 minutes. The test spans the entire drive, and the drive is filled before the test begins. The primary score we report is an average of performances at queue depths 1, 2 and 4, as client usage typically consists mostly of low queue depth operations.
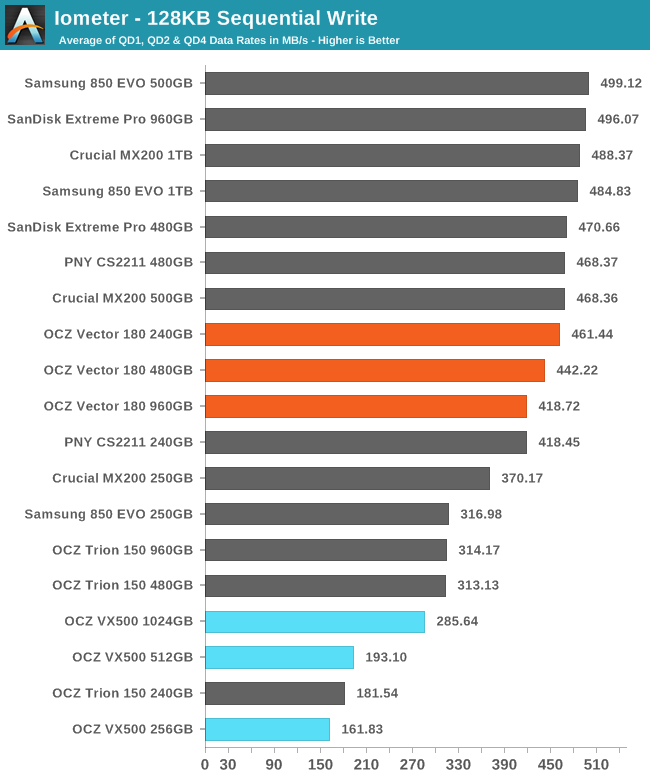
The OCZ VX500 fares very poorly on this test. The drive is filled before the test is run, and apparently the VX500 did not finish flushing the SLC cache before the performance measurement began. These numbers thus represent the worst-case write performance for the VX500, while some TLC SSDs will continue to degrade under a longer write load.
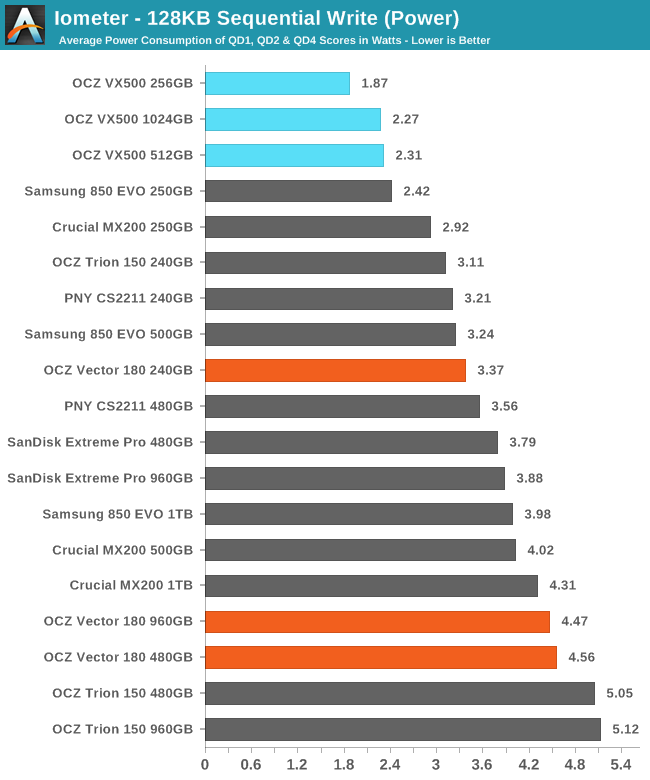
In spite of the extra background work during this test as the VX500 copes with an already full SLC cache, it maintains very low power consumption. Efficiency is still a regression relative to the Vector 180 for the smaller two sizes, but the 1TB model manages a slight improvement.
 |
|||||||||
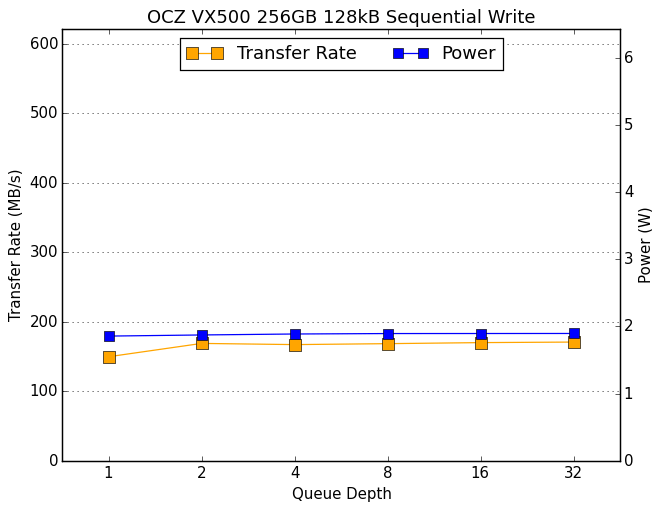
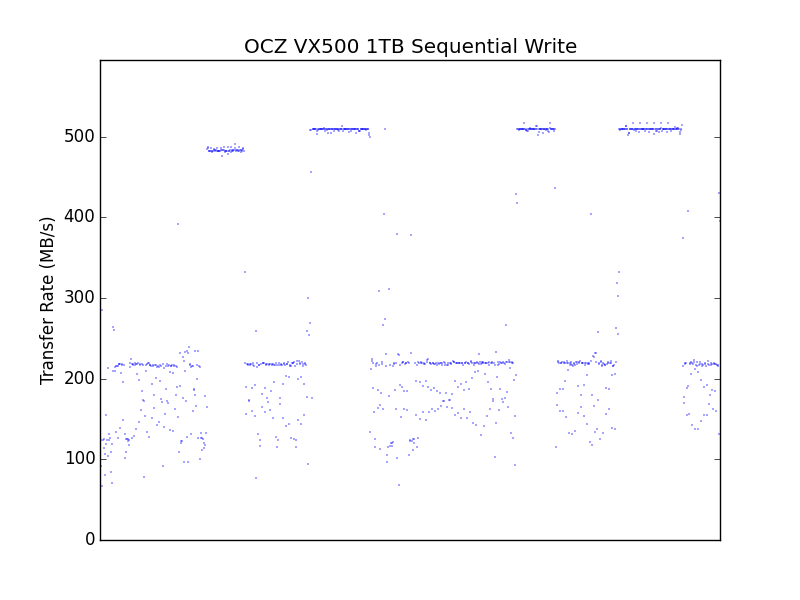
Most drives exhibit little or no scaling with queue depth, and the smaller two VX500s follow this pattern. The above plot of the 1TB model's behavior looks very odd, but an inspection of the second-by-second performance data (below) reveals that it it periodically escaping from the low-performance state and delivering write speeds near the limit of the SATA interface. On a shorter test with less data written beforehand, the smaller models would likely also have shown their good side for some or all of the test.
Mixed Random Read/Write Performance
The mixed random I/O benchmark starts with a pure read test and gradually increases the proportion of writes, finishing with pure writes. The queue depth is 3 for the entire test and each subtest lasts for 3 minutes, for a total test duration of 18 minutes. As with the pure random write test, this test is restricted to a 16GB span of the drive, which is empty save for the 16GB test file.
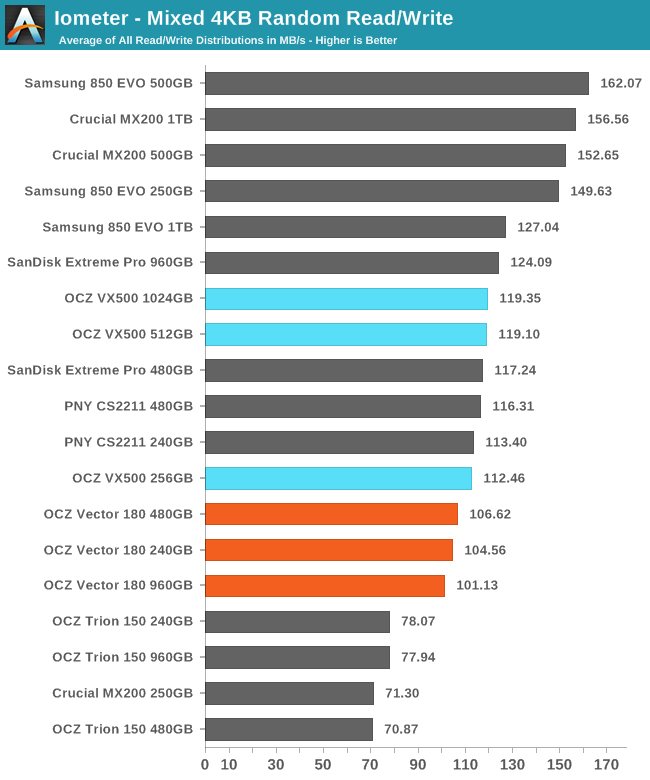
The OCZ VX500 delivers slightly better mixed random I/O performance than the Vector 180, but both are still about average for mainstream drives and significantly behind the top performers.
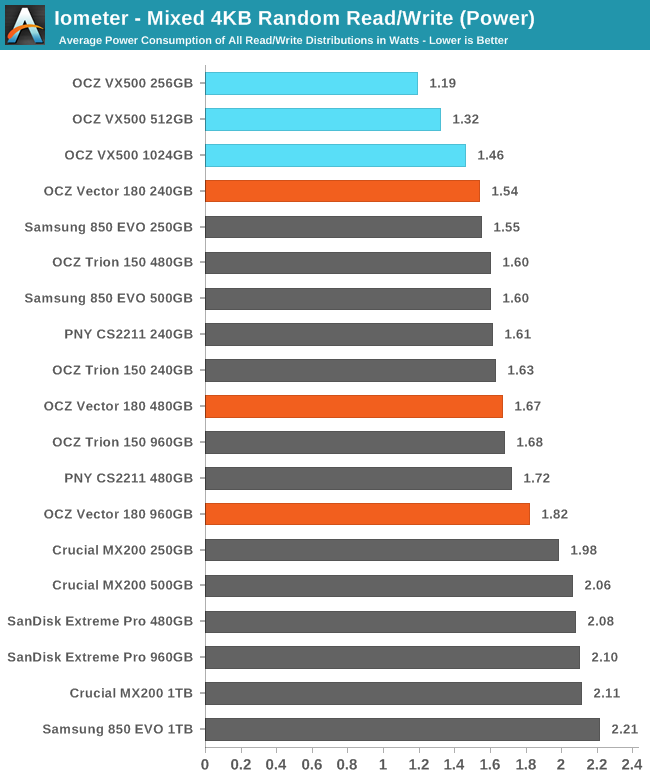
As usual, the VX500 uses very little power and thus has great efficiency, competitive with the much higher-performing Samsung 850 EVOs.
 |
|||||||||
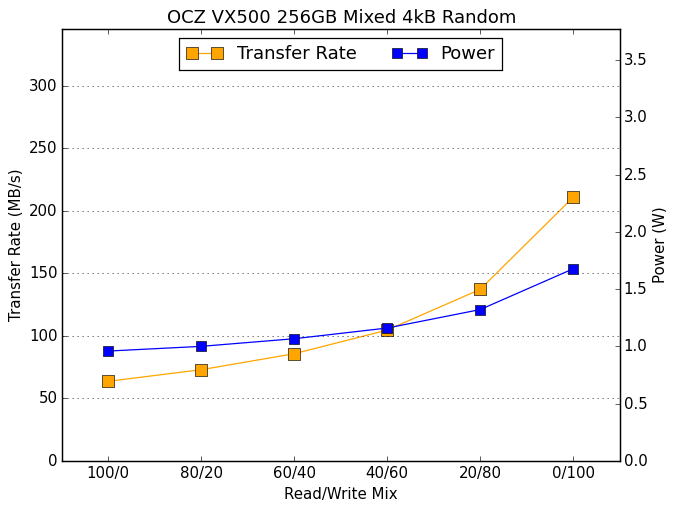
The VX500 starts out at a bit of a disadvantage with a low random read speed, but it never drops in performance as more writes are added to the mix. It does not benefit from the significant spike in performance some drives achieve once the workload shifts to pure writes.
Mixed Sequential Read/Write Performance
The mixed sequential access test covers the entire span of the drive and uses a queue depth of one. It starts with a pure read test and gradually increases the proportion of writes, finishing with pure writes. Each subtest lasts for 3 minutes, for a total test duration of 18 minutes. The drive is filled before the test starts.
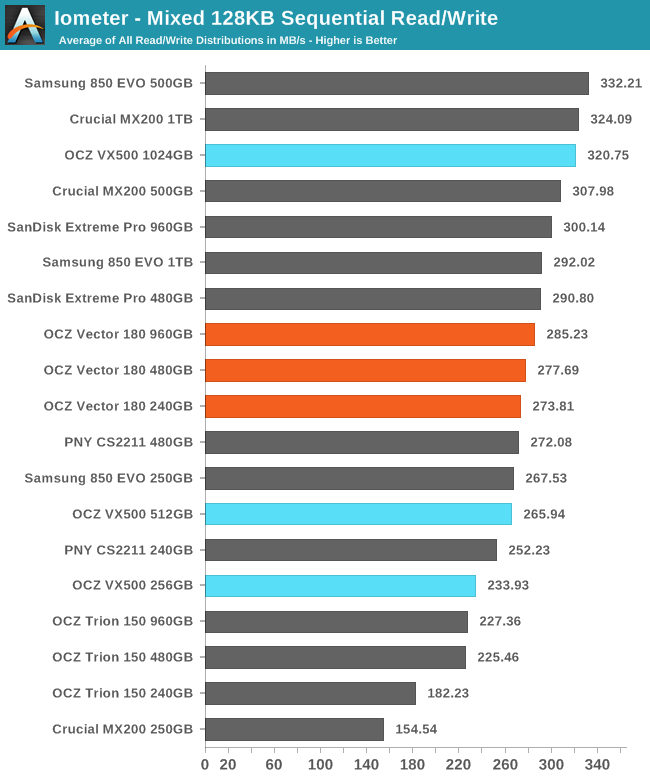
The 1TB OCZ VX500 lands near the top of the chart on this test, but the smaller two capacities are slightly slower than the Vector 180 they are replacing.
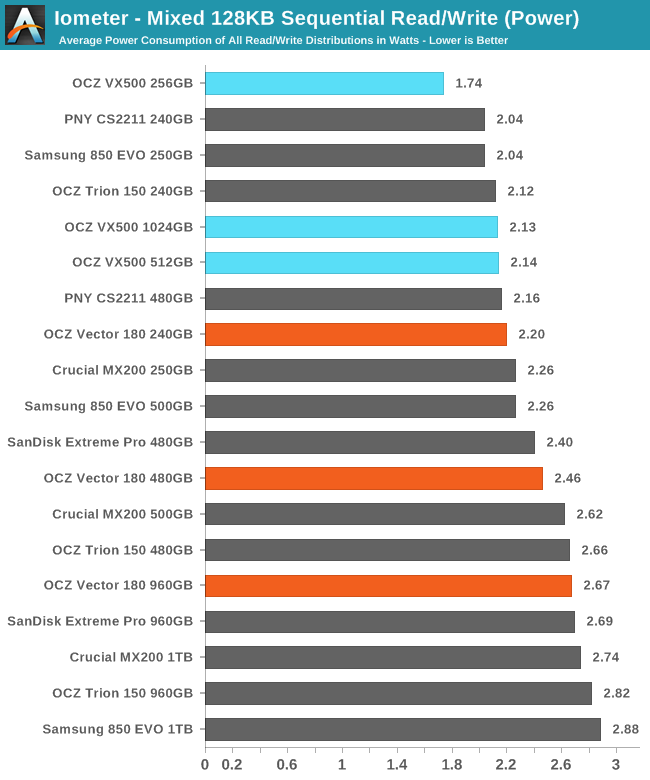
Power consumption is good, but only the 256GB VX500 uses significantly less than any of the competition. Efficiency is still very good for all three capacities and competitive with the best drives with planar or 3D NAND.
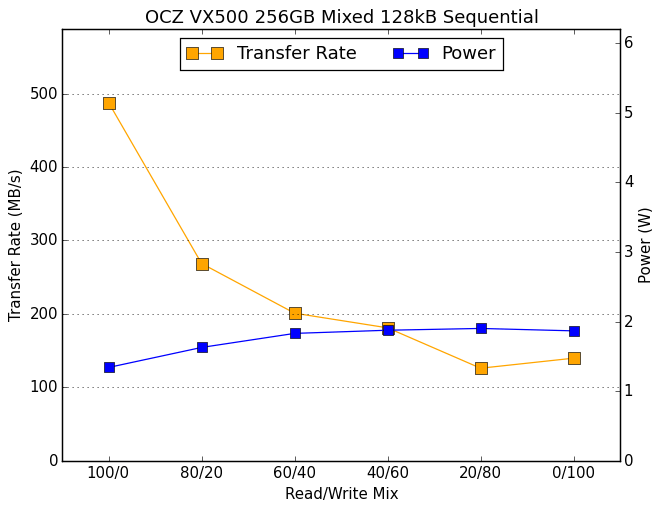 |
|||||||||
Once again, due to the drive being filled before the test the smaller two VX500s do not handle the write-heavy portions of the test well. The 1TB model is able to deliver peak write performance during parts of the test, allowing its average transfer rate to recover some in the second half.
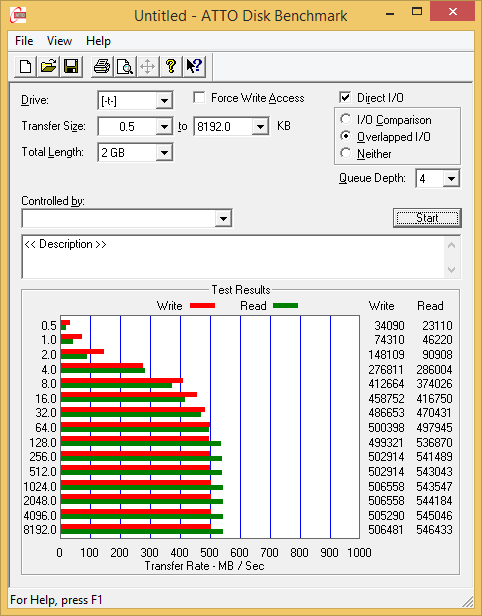
ATTO
ATTO's Disk Benchmark is a quick and easy freeware tool to measure drive performance across various transfer sizes.
 |
|||||||||
At small transfer sizes, the OCZ VX500 has better read speed but worse write speed than the Vector 180. Unlike the Vector 180, the VX500 maintains steady performance through the second half of the test with solid read and write speeds.
AS-SSD
AS-SSD is another quick and free benchmark tool. It uses incompressible data for all of its tests, making it an easy way to keep an eye on which drives are relying on transparent data compression. The short duration of the test makes it a decent indicator of peak drive performance.
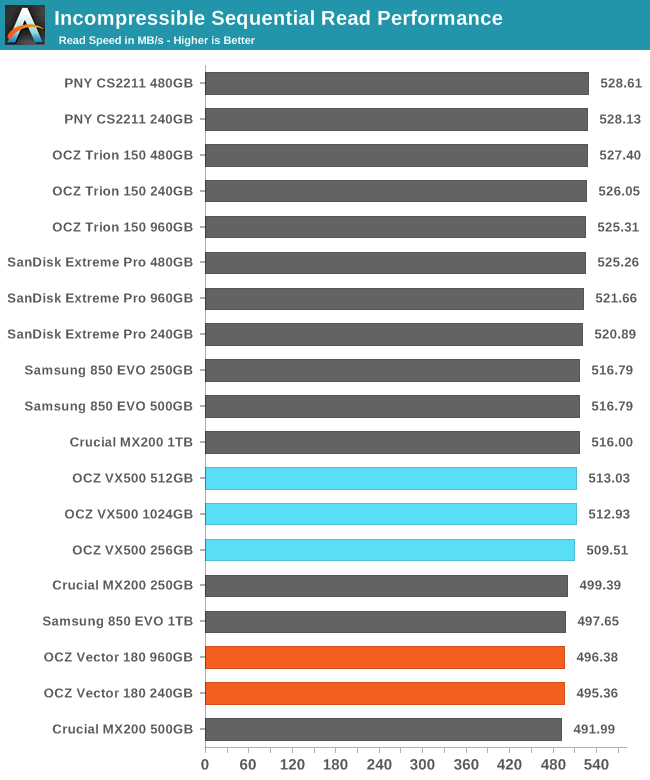
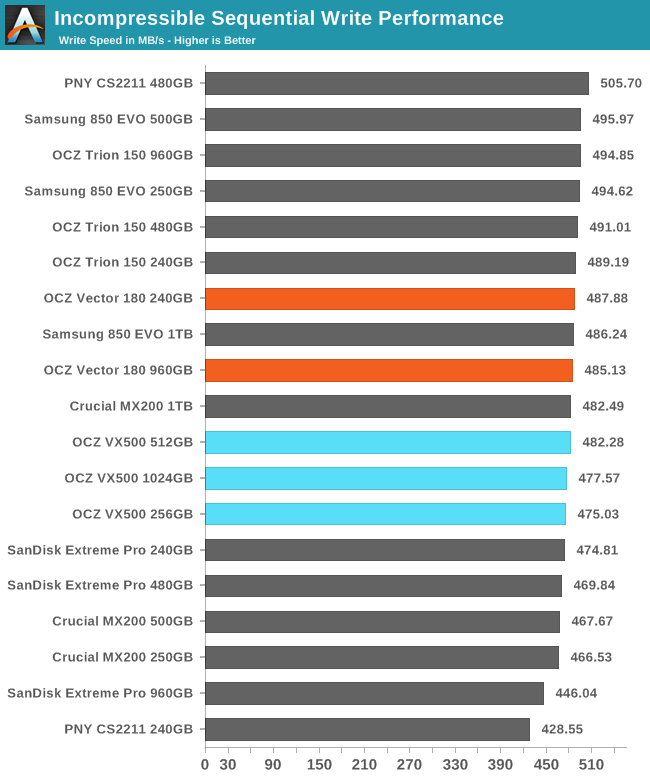
Peak read speeds for the VX500 are good and a slight but ultimately meaningless improvement over the Vector 180. Peak sequential write speeds are confirmed to be fine despite the poor showing on the more intense IOmeter test.
Idle Power Consumption
Since the ATSB tests based on real-world usage cut idle times short to 25ms, their power consumption scores paint an inaccurate picture of the relative suitability of drives for mobile use. During real-world client use, a solid state drive will spend far more time idle than actively processing commands. Our testbed doesn't support the deepest DevSlp power saving mode that SATA drives can implement, but we can measure the power usage in the intermediate slumber state where both the host and device ends of the SATA link enter a low-power state and the drive is free to engage its internal power savings measures.
We also report the drive's idle power consumption while the SATA link is active and not in any power saving state. Drives are required to be able to wake from the slumber state in under 10 milliseconds, but that still leaves plenty of room for them to add latency to a burst of I/O. Because of this, many desktops default to either not using SATA Aggressive Link Power Management (ALPM) at all or to only enable it partially without making use of the device-initiated power management (DIPM) capability. Additionally, SATA Hot-Swap is incompatible with the use of DIPM, so our SSD testbed usually has DIPM turned off during performance testing.
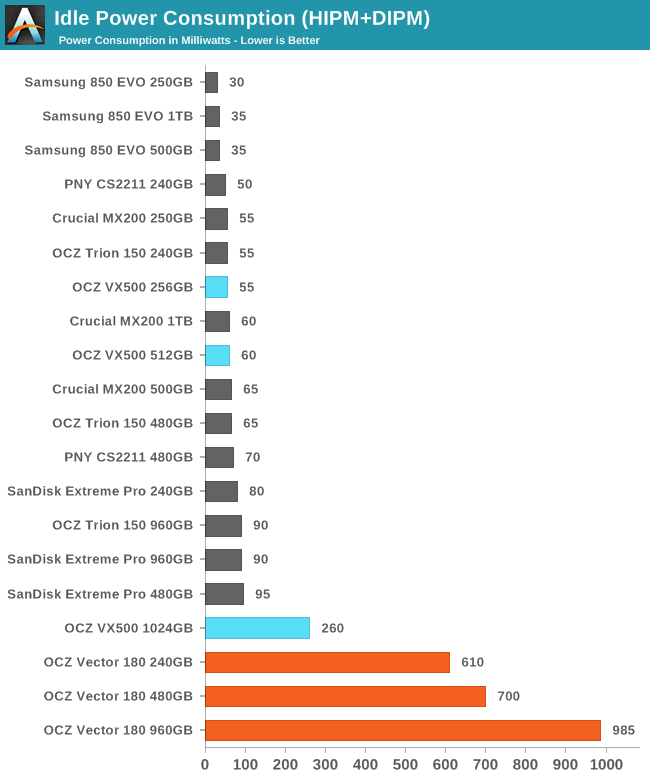
With no SATA ALPM support from the Barefoot 3 controller, the Vector 180 distorts the scale of the slumber power graph. The smaller capacities of the VX500 are fine, but the 1TB is using an extra 200mW, most likely because the external DRAM interface is remaining active.
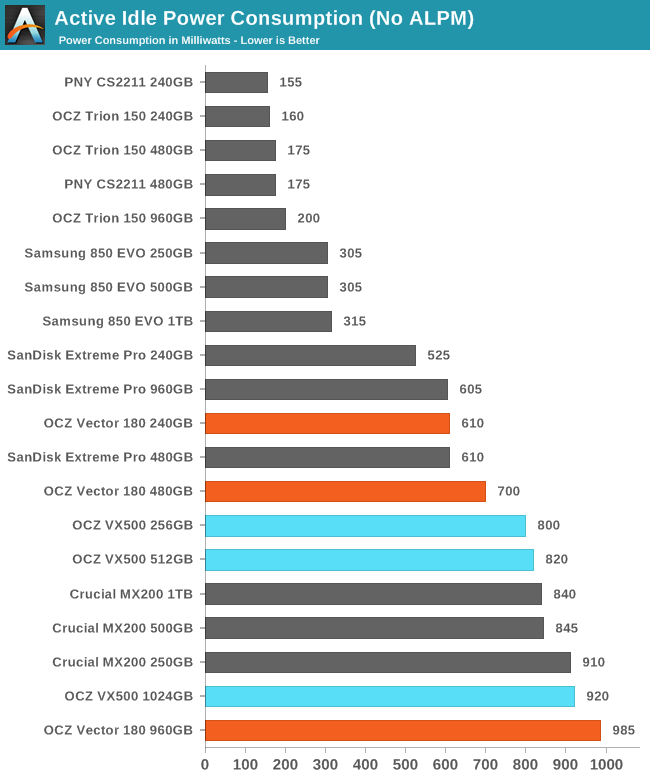
Active idle power consumption is not great and only the 1TB manages to be an improvement over the Vector 180, but most mobile systems make proper use of the slumber state and are thus unaffected by this.
Final Words
The VX500 has a very different performance profile from the Vector 180 it replaces. This isn't always a bad thing: in many ways, the Vector 180 behaved more like an enterprise SSD with an emphasis on sustained performance. The VX500 by contrast is very clearly focused on peak performance for client workloads. It is one of the few drives that uses SLC caching on MLC NAND, and this allows it to deliver very good burst performance by the standards of a mid-range SATA drive. But as we saw with the Crucial MX200, SLC caching on an MLC drive has a downside for sustained workloads. Once the SLC cache fills up, the drive has to divide its time between flushing the cache and serving new requests. This produces a noticeable drop in performance, though not as severe as for the MX200 or many TLC drives that are even more dependent on their caches.
The impact this has on benchmark performance varies widely depending on the drive and the test, and often unpredictably because there is currently no mechanism to directly monitor the state of a drive's internal caches or the progress of flushing that data from SLC to MLC (or TLC). The 256GB VX500 suffered toward the end of the random write test due to its SLC cache suddenly filling up, while the 1024GB VX500 occasionally sped up significantly during the sequential write test due to the background garbage collection process catching up enough to allow a few minutes of writes into cache. These oddities are unlikely to be encountered during ordinary use. Based on the VX500's strong performance on our trace-based ATSB tests that play back real-world I/O patterns but with shortened idle periods, it appears that the VX500 only needs a little bit of idle time to maintain good performance. That means that the most important performance shortcoming is probably the low random read speed, which is almost as slow as planar TLC SSDs.
The VX500 is also very energy efficient, in many cases rivaling the record-setting Crucial BX100. This is a huge change from the Vector 180, which has no support for SATA link power management and significantly higher load power consumption. The one exception is the idle power management of the 1TB VX500; most likely due to its use of an external DRAM buffer, it does not power down as much when entering the slumber state and does not support the deepest DEVSLP state.
The end result is a drive that is well suited for use as a mainstream SATA SSD. Technologically, it's a stopgap product using off the shelf components, but it addresses the most relevant weaknesses of the Vector 180. Otherwise the VX500 will probably have a relatively short life in the market before being replaced by a 3D NAND product with a completely different and far more modern controller.
| Mid-Range SATA SSD Price Comparison | ||||||
| 120/128GB | 240-275GB | 480-525GB | 960-1050GB | |||
| OCZ VX500 (MSRP) | $63.99 (50¢/GB) | $92.79 (36¢/GB) | $152.52 (30¢/GB) | $337.06 (33¢/GB) | ||
| OCZ Vector 180 | $81.54 (68¢/GB) | $114.95 (48¢/GB) | $154.11 (32¢/GB) | $322.81 (34¢/GB) | ||
| SanDisk X400 | $49.99 (39¢/GB) | $81.99 (32¢/GB) | $135.19 (26¢/GB) | $238.88 (23¢/GB) | ||
| SanDisk Extreme Pro | $110.78 (46¢/GB) | $195.99 (41¢/GB) | $353.21 (37¢/GB) | |||
| PNY CS2211 | $79.99 (33¢/GB) | $139.99 (29¢/GB) | $279.99 (29¢/GB) | |||
| Samsung 850 EVO | $99.99 (40¢/GB) | $157.99 (32¢/GB) | $305.99 (31¢/GB) | |||
| Crucial MX200 | $83.99 (34¢/GB) | $144.00 (29¢/GB) | $309.00 (31¢/GB) | |||
| Crucial MX300 | $72.99 (27¢/GB) | $129.99 (25¢/GB) | $259.99 (25¢/GB) | |||
The initial MSRPs put the VX500 near the top of the price band for mainstream SSDs, but it could come down significantly. The OCZ Trion 150 debuted early this year with a relatively high price for a budget planar TLC drive, but has now become one of the cheapest options and a good value for that segment. If the VX500 can similarly come down a bit from MSRP then it may enjoy some time as a decent mainstream option while the 3D NAND choices are still limited. At MSRP, the OCZ VX500 would be too close to the Samsung 850 EVO in price, and the latter drive is a much better all-around performer. Below that price point, the closest competitor in performance would be MLC+Phison S10 products like the PNY CS2211, given that the rest of the MLC options are either being phased out or are already more expensive. The CS2211 is faster than the VX500 on enough tests to make it a slight favorite, but the VX500 is the better pick where battery life is a concern.


