Original Link: https://www.anandtech.com/show/10944/msi-cubi-2-kaby-lake-ucff-pc-review
MSI Cubi 2 Kaby Lake UCFF PC Review
by Ganesh T S on December 30, 2016 3:30 PM EST
The Kaby Lake-U (KBL-U) series with 15W TDP CPUs was introduced along with the 4.5W Kaby Lake-Y ones in Q3 2016. The first set of products with Kaby Lake-U were ultrabooks. However, ultra-compact form-factor (UCFF) PCs were not long behind. There are already three vendors in the market with Kaby Lake UCFF PCs - ASRock (Beebox-S), GIGABYTE (BRIX), and MSI (Cubi 2). MSI was the first to launch KBL-U UCFF PCs in the North American market under the Cubi 2 tag. This review focuses on the build and performance of the Cubi2-005B - the KBL-U UCFF PC from MSI featuring the Core i7-7500U.
Introduction
Ultra-compact form factor (UCFF) PCs have become quite popular after Intel introduced the NUCs. They have become powerful enough to be the primary computing platform for many households. In addition to the Intel NUCs, many system vendors have come up with their own approach to UCFF PCs. These include ASRock (with the Beebox series), ECS (LIVA), GIGABYTE (BRIX), and MSI (Cubi) amongst others.
Kaby Lake-U, as per Intel's claims, is fabricated on a much more mature 14nm process and brings about a 11% improvement in performance for the same power consumption. The GPU's media engine has also been updated. On the whole, the performance improvements look good for UCFF PCs - particularly for those upgrading from the first or second-generation systems.
MSI's take on the UCFF PC market with the Cubi an Cubi 2 is interesting from two perspectives - Rather than having separate SKUs for units with / without support for 2.5" drives (like the GIGABYTE BRIX) or compromising on the thickness of the system to include 2.5" drives (like the ASRock Beebox), MSI allows for interchangeable bottom plates. The default one doesn't come with 2.5" drive support and results in a system thickness of 3.7 cm (while the extension bay / thicker bottom plate version makes the system 4.9 cm thick). The extension bay is also included with the Cubi 2 package. The second aspect is that MSI is targeting the Cubi 2 towards effectiveness for the average consumer. While a M.2 NVMe SSD can do wonders in terms of performance, the reality is that the high-performance versions come in the M.2 2280 form-factor. Rather than sacrificing the size of the unit, MSI has decided only to have a M.2 2242 slot in the PC. Even though it is connected to the PCIe lanes from the PCH, we believe it is likely that consumers will be using M.2 2242 SATA SSDs in that slot, or, end up using a 2.5" drive with the extension bay.
Similar to other UCFF PCs in the market, the Cubi 2 also comes in a version without memory or storage. The Cubi 2 can take up to two DDR4 SO-DIMMs (operating at 2133 MHz) and a 2.5" drive and/or a M.2 2242 SATA / PCIe SSD. We completed the hardware build to result in the following specifications for our MSI Cubi2-005B review configuration.
| MSI Cubi2-005B Specifications | |
| Processor | Intel Core i7-7500U Kaby Lake, 2C/4T, 2.7 GHz (up to 3.5 GHz), 14nm PLUS, 4MB L2, 15W TDP |
| Memory | Micron 16ATF1G64HZ-2G1A2 DDR4 15-15-15-36 @ 2133 MHz 2x8 GB |
| Graphics | Intel HD Graphics 620 |
| Disk Drive(s) | Crucial MX200 CT500MX200SSD1 (500 GB; 2.5in SATA 6Gb/s; 16nm; MLC) |
| Networking | Intel Dual Band Wireless-AC 3168 (1x1 802.11ac - 433 Mbps) 1x Realtek RTL8168 Gigabit LAN |
| Display | 1x mini-Display Port 1.2 (3840x2160 @ 60 Hz) 1x HDMI 1.4b (4096x2160 @ 24 Hz) |
| Audio | 3.5mm Headphone Jack, 3.5mm Microphone Jack Capable of 5.1/7.1 digital output with HD audio bitstreaming (HDMI) |
| Miscellaneous I/O Ports | 3x USB 3.0 (Type-A) 1x USB 3.1 Gen 1 (Type-C) |
| Operating System | Retail unit is barebones, but we installed Windows 10 Pro x64 |
| Pricing | $499 (barebones) / $787 (as configured) |
| Full Specifications | MSI Cubi2-005BUS Specifications |
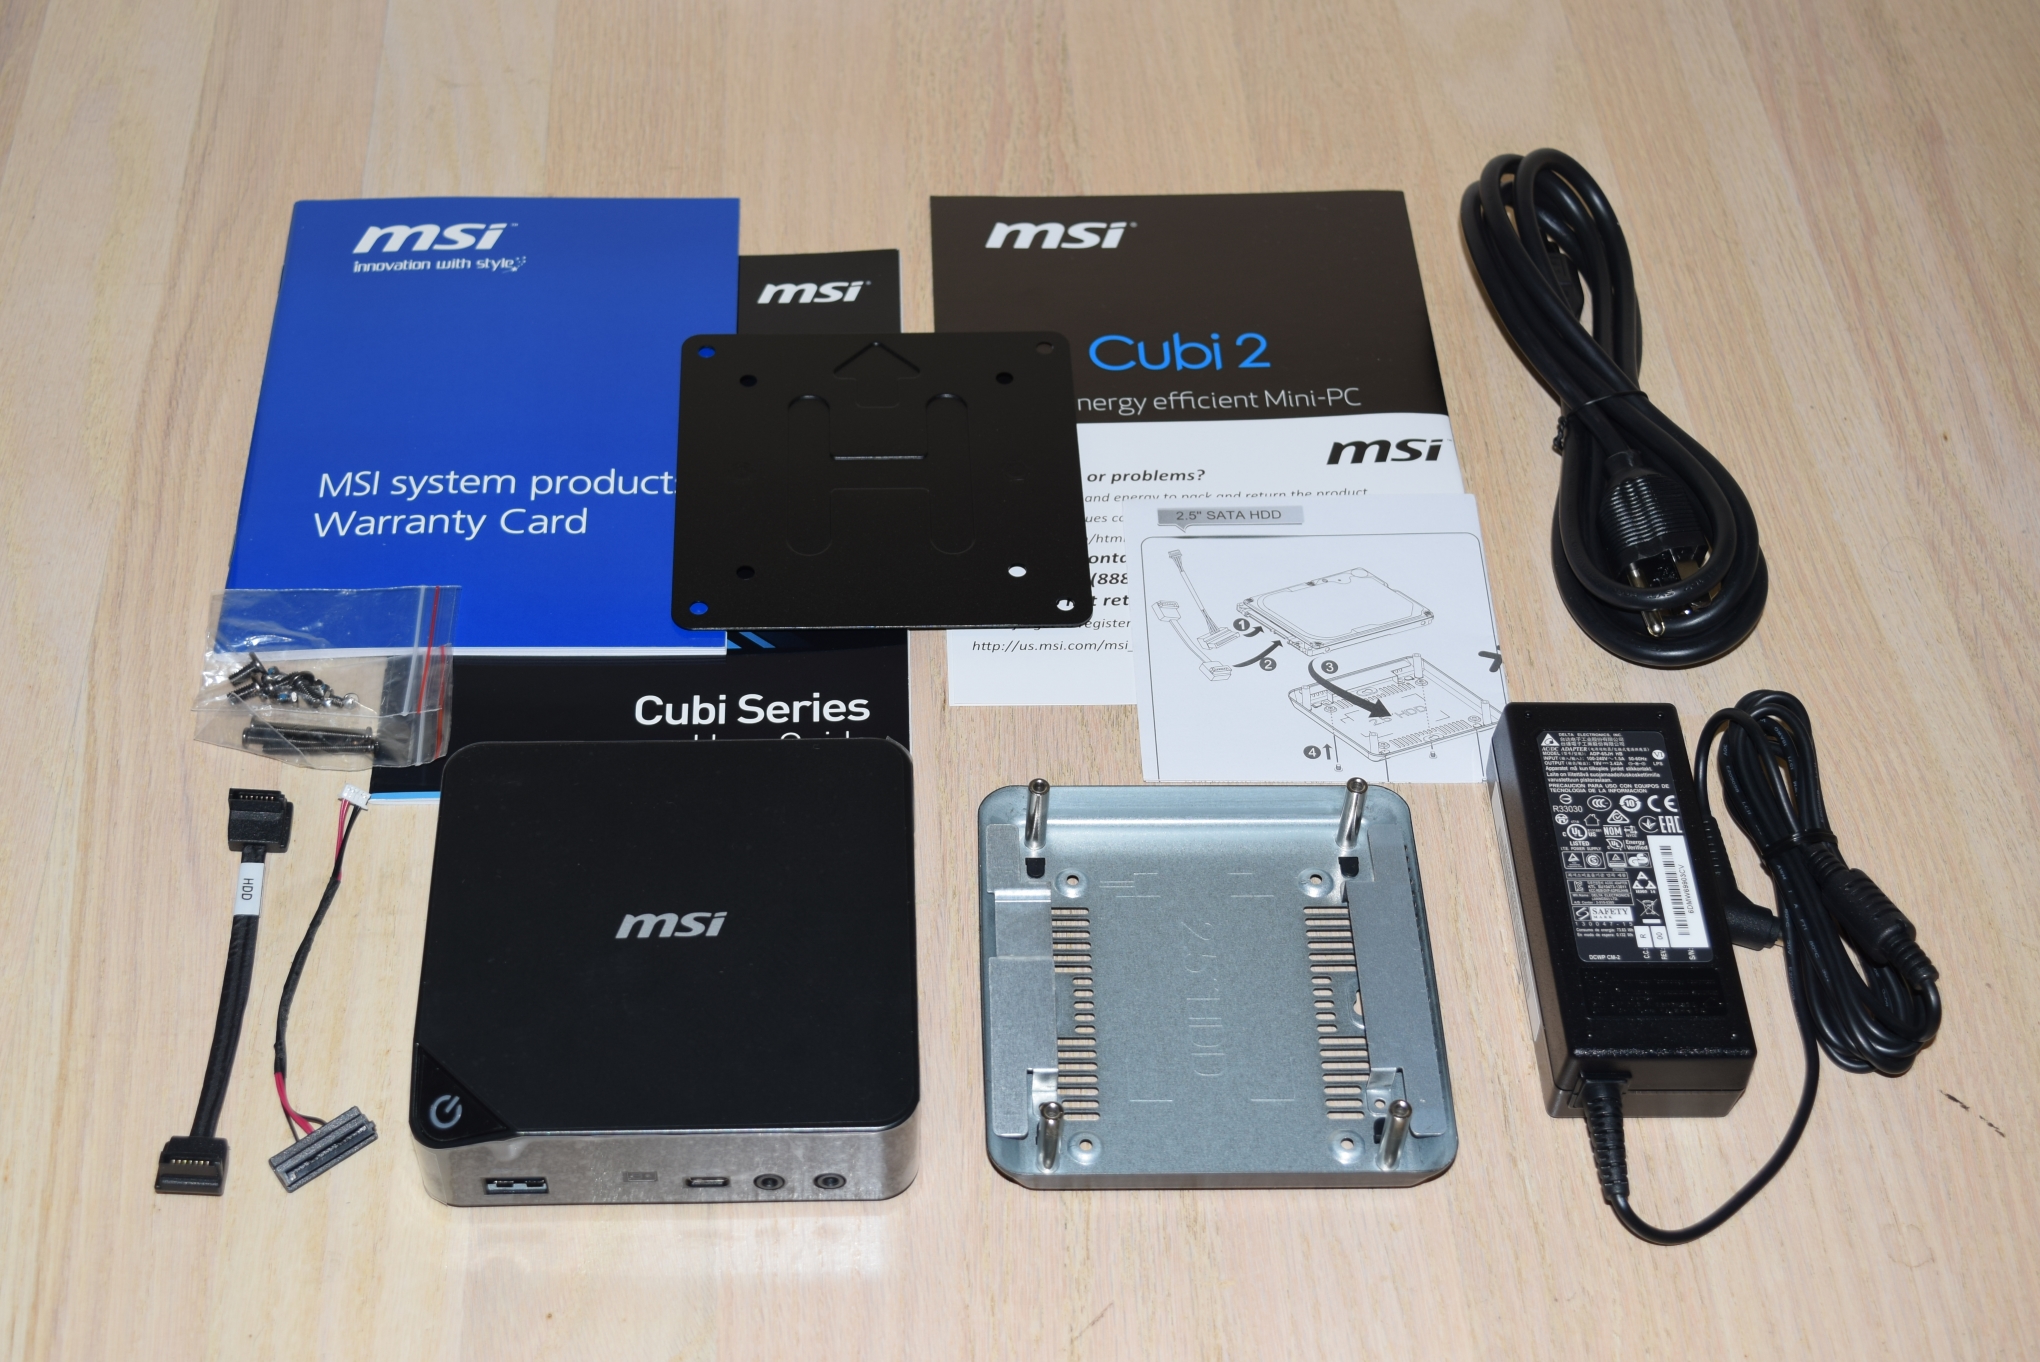
The MSI Cubi2-005B kit doesn't come with any pre-installed OS, but does come with a CD containing the drivers. In any case, we ended up installing the latest drivers downloaded off the component vendors' product support page. In addition to the main unit, the other components of the package include a 65 W (19V @ 3.42A) adapter, a US power cord, a VESA mount (along with the necessary screws), a 2.5" drive extension bay, SATA data and power cables, user's manual and a quick-start guide.
The gallery below takes us around the various chassis features.


The PCIe lanes in our review configuration of the MSI Cubi2-005BUS are distributed as follows:
- PCI-E 3.0 x2 port #3 In Use @ x1 (Realtek RTL8168 PCIe Gigabit Ethernet Adapter)
- PCI-E 3.0 x1 port #4 In Use @ x1 (Intel Dual Band Wireless-AC 3168 WiFi Adapter)
- PCI-E 3.0 x4 port #9 Not In Use @ x4 (M.2 NVMe Slot)
In the table below, we have an overview of the various systems that we are comparing the MSI Cubi2-005B against. Note that they may not belong to the same market segment. The relevant configuration details of the machines are provided so that readers have an understanding of why some benchmark numbers are skewed for or against the MSI Cubi2-005B when we come to those sections.
| Comparative PC Configurations | ||
| Aspect | MSI Cubi2-005B | |
| CPU | Intel Core i7-7500U | Intel Core i7-7500U |
| GPU | Intel HD Graphics 620 | Intel HD Graphics 620 |
| RAM | Micron 16ATF1G64HZ-2G1A2 DDR4 15-15-15-36 @ 2133 MHz 2x8 GB |
Micron 16ATF1G64HZ-2G1A2 DDR4 15-15-15-36 @ 2133 MHz 2x8 GB |
| Storage | Crucial MX200 CT500MX200SSD1 (500 GB; 2.5in SATA 6Gb/s; 16nm; MLC) |
Crucial MX200 CT500MX200SSD1 (500 GB; 2.5in SATA 6Gb/s; 16nm; MLC) |
| Wi-Fi | Intel Dual Band Wireless-AC 3168 (1x1 802.11ac - 433 Mbps) |
Intel Dual Band Wireless-AC 3168 (1x1 802.11ac - 433 Mbps) |
| Price (in USD, when built) | $499 (barebones) $787 (as configured) |
$499 (barebones) $787 (as configured) |
Performance Metrics - I
The MSI Cubi2-005B was evaluated using our standard test suite for low power desktops / industrial PCs. Not all benchmarks were processed on all the machines due to updates in our testing procedures. Therefore, the list of PCs in each graph might not be the same. In the first section, we will be looking at SYSmark 2014 SE, as well as some of the Futuremark benchmarks.
BAPCo SYSmark 2014 SE
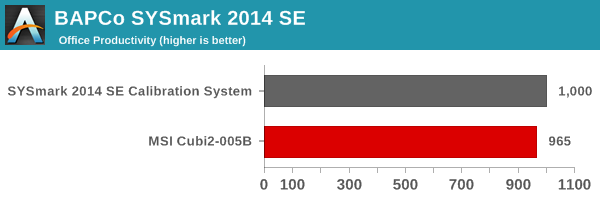
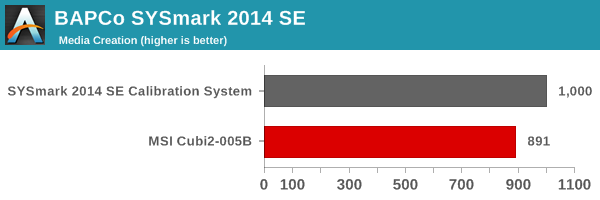
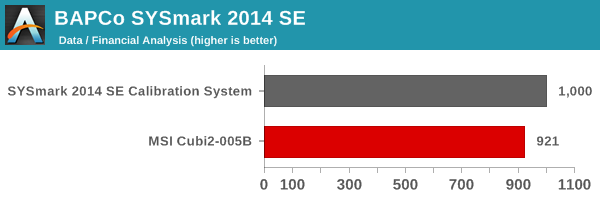
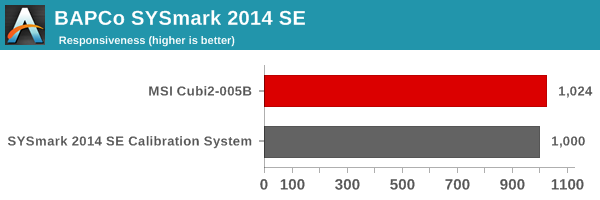
BAPCo's SYSmark 2014 SE is an application-based benchmark that uses real-world applications to replay usage patterns of business users in the areas of office productivity, media creation and data/financial analysis. In addition, it also addresses the responsiveness aspect which deals with user experience as related to application and file launches, multi-tasking etc. Scores are meant to be compared against a reference desktop (the SYSmark 2014 SE calibration system in the graphs below). While the SYSmark 2014 benchmark used a Haswell-based desktop configuration, the SYSmark 2014 SE makes the move to a Lenovo ThinkCenter M800 (Intel Core i3-6100, 4GB RAM and a 256GB SATA SSD). The calibration system scores 1000 in each of the scenarios. A score of, say, 2000, would imply that the system under test is twice as fast as the reference system.

SYSmark 2014 SE also adds energy measurement to the mix. A high score in the SYSmark benchmarks might be nice to have, but, potential customers also need to determine the balance between power consumption and the efficiency of the system. For example, in the average office scenario, it might not be worth purchasing a noisy and power-hungry PC just because it ends up with a 2000 score in the SYSmark 2014 SE benchmarks. In order to provide a balanced perspective, SYSmark 2014 SE also allows vendors and decision makers to track the energy consumption during each workload. In the graphs below, we find the total energy consumed by the PC under test for a single iteration of each SYSmark 2014 SE workload and how it compares against the calibration systems.
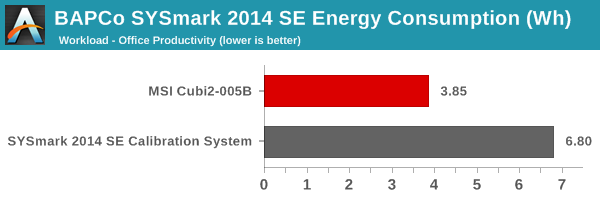
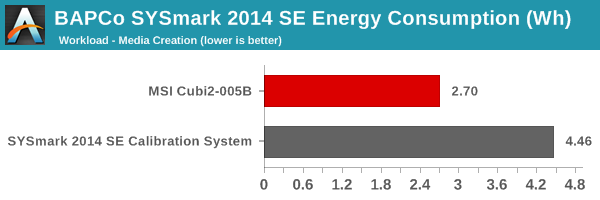
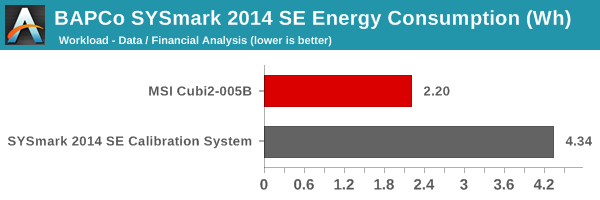
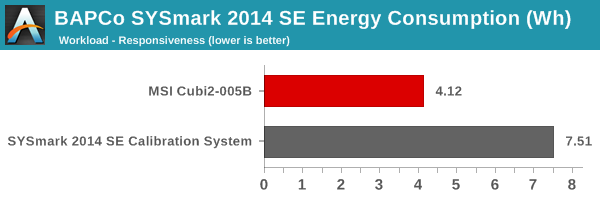
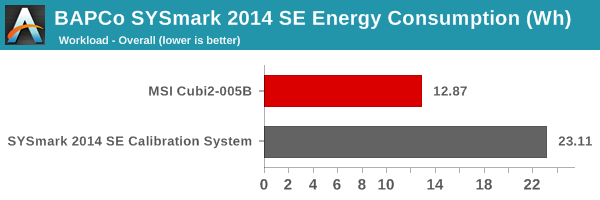
The Cubi2-005BUS is almost as good as the Skylake Core i3 desktop (in terms of scores), but, consumes about half the energy to provide that performance. This shows the energy efficiency provided by the Kaby Lake platform.
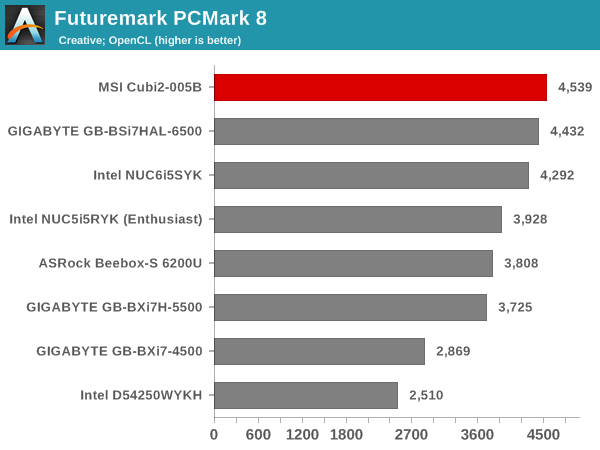
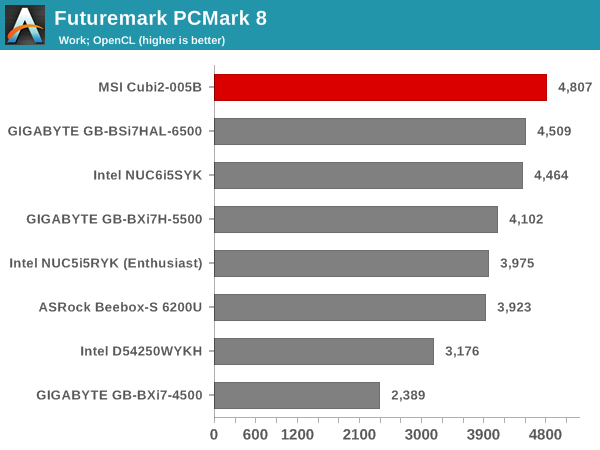
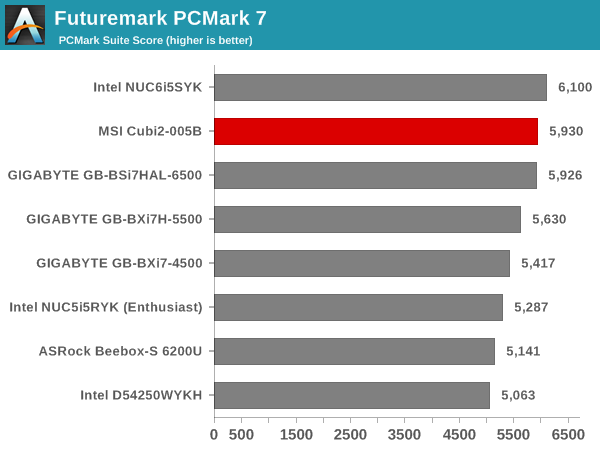
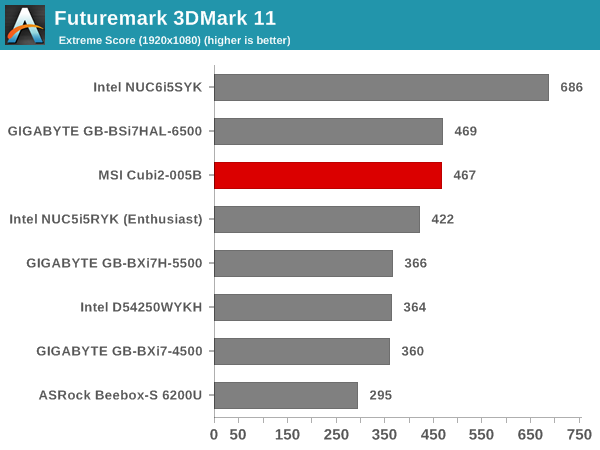
Futuremark PCMark 8
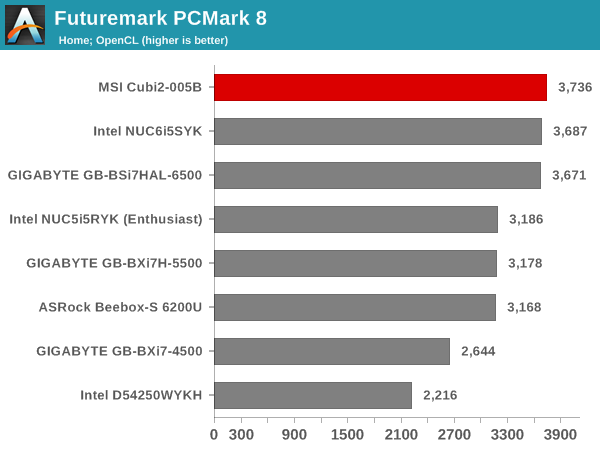
PCMark 8 provides various usage scenarios (home, creative and work) and offers ways to benchmark both baseline (CPU-only) as well as OpenCL accelerated (CPU + GPU) performance. We benchmarked select PCs for the OpenCL accelerated performance in all three usage scenarios. These scores are heavily influenced by the CPU in the system. The Cubi2-005BUS is equipped with the highest-end KBL-U CPU, and the power of the Core i7-7500U enables it to easily outscore all the UCFF PCs from the previous generations. In the GPU-related bechmarks, the Skylake Iris graphics-enabled SKU (Intel NUC65SYK) comes out on top.
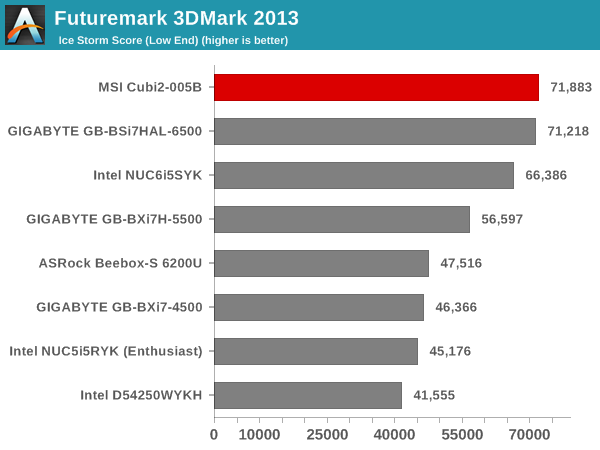
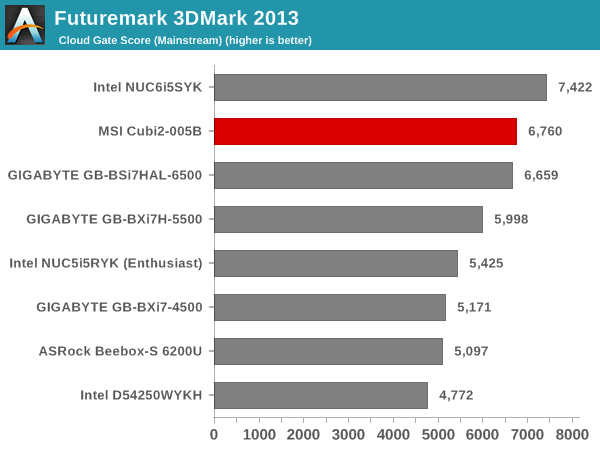
Miscellaneous Futuremark Benchmarks
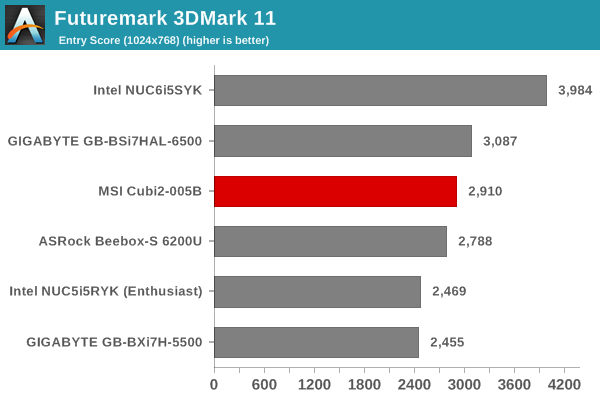
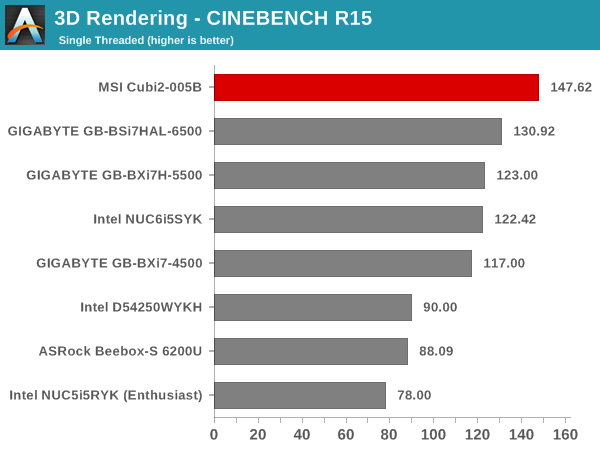
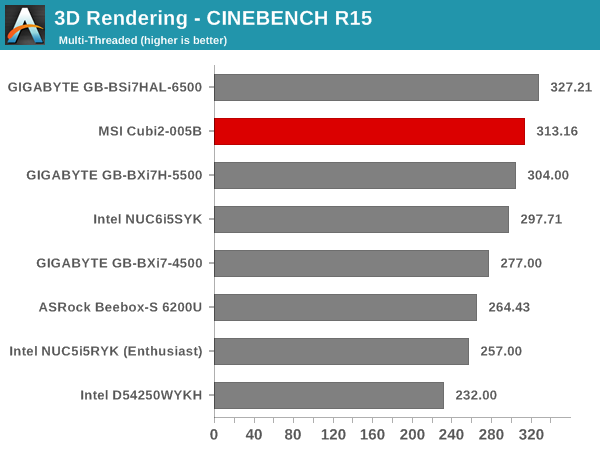
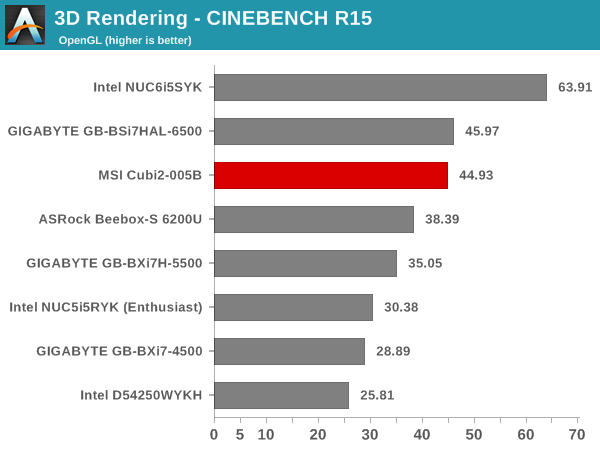
3D Rendering - CINEBENCH R15
We have moved on from R11.5 to R15 for 3D rendering evaluation. CINEBENCH R15 provides three benchmark modes - OpenGL, single threaded and multi-threaded. Evaluation of select PCs in all three modes provided us the following results. These results show that the higher configurable TDP (cTDP-Up) of the Core i7-6500U in the GIGABYTE GB-BSi7HAL-6500 enables it to outscore the Cubi2-005BUS in the multi-threaded and OpenGL runs. The NUC65SYK also comes out on top in the OpenGL case because of the Iris GPU.
Performance Metrics - II
In this section, we mainly look at benchmark modes in programs used on a day-to-day basis, i.e, application performance and not synthetic workloads.
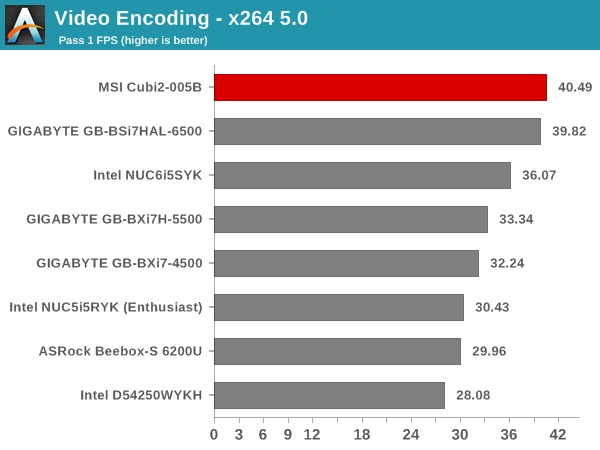
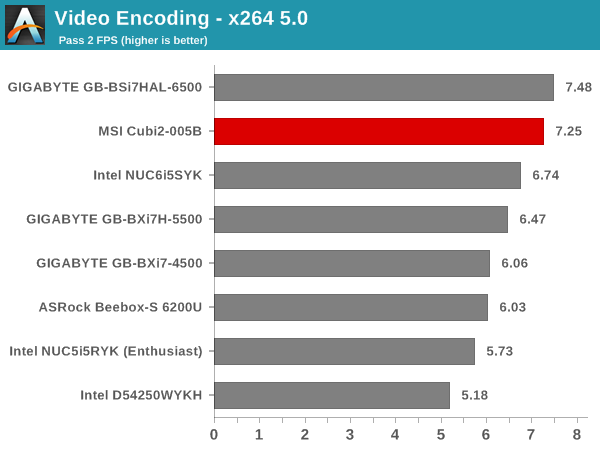
x264 Benchmark
First off, we have some video encoding benchmarks courtesy of x264 HD Benchmark v5.0. This is simply a test of CPU performance. The cTDP-Up of the Skylake BRIX enables it to to get slightly higher numbers in the second pass when compared to the Kaby Lake Cubi2-005BUS. Actual x264 encoding performance with the Kaby Lake processors and using the latest x264 releases (with AVX512 AVX2 support) is bound to be even better compared to the numbers below.
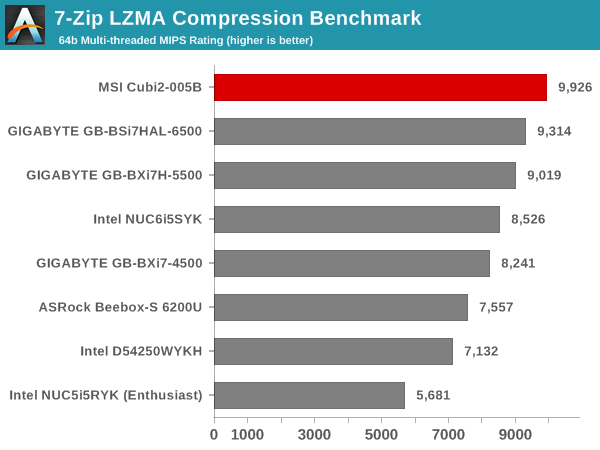
7-Zip
7-Zip is a very effective and efficient compression program, often beating out OpenCL accelerated commercial programs in benchmarks even while using just the CPU power. 7-Zip has a benchmarking program that provides tons of details regarding the underlying CPU's efficiency. In this subsection, we are interested in the compression and decompression MIPS ratings when utilizing all the available threads.

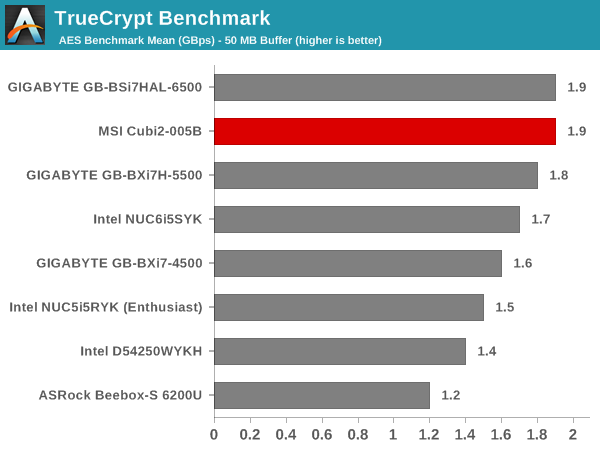
TrueCrypt
As businesses (and even home consumers) become more security conscious, the importance of encryption can't be overstated. Almost all modern CPUs support AES-NI for acceleration of the cryptographic processes. The Core i7-7500U in the Cubi2-005BUS does have AES-NI support. TrueCrypt, a popular open-source disk encryption program can take advantage of the AES-NI capabilities. In the graph below, we can get an idea of how fast a TrueCrypt volume would behave in the MSI Cubi2-005BUS and how it would compare with other select PCs. This is a purely CPU feature / clock speed / TDP-based test.
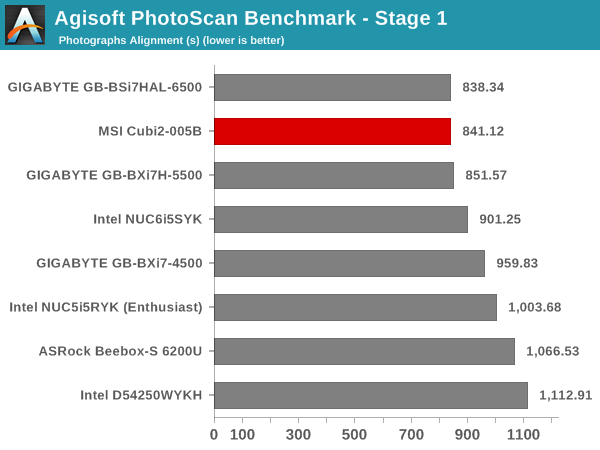
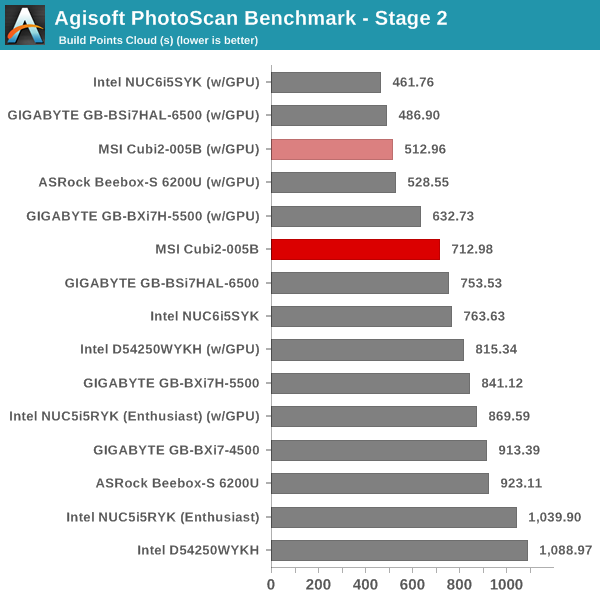
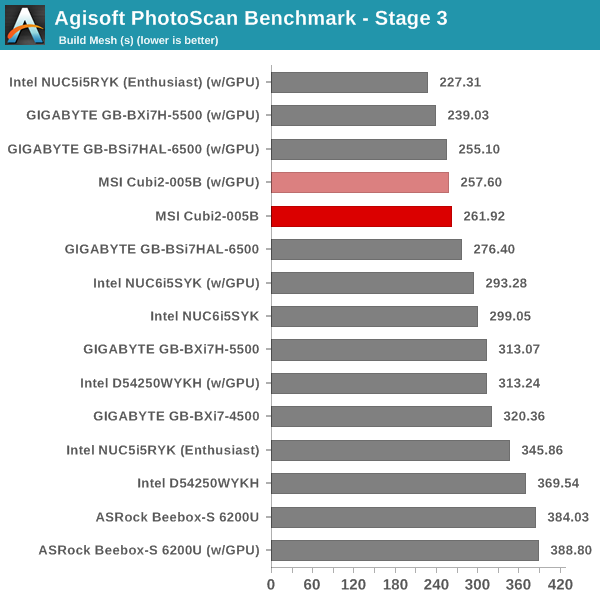
Agisoft Photoscan
Agisoft PhotoScan is a commercial program that converts 2D images into 3D point maps, meshes and textures. The program designers sent us a command line version in order to evaluate the efficiency of various systems that go under our review scanner. The command line version has two benchmark modes, one using the CPU and the other using both the CPU and GPU (via OpenCL). The benchmark takes around 50 photographs and does four stages of computation:
- Stage 1: Align Photographs
- Stage 2: Build Point Cloud (capable of OpenCL acceleration)
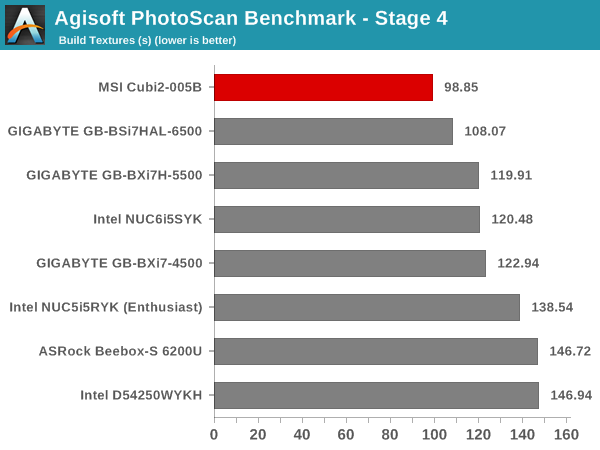
- Stage 3: Build Mesh
- Stage 4: Build Textures
We record the time taken for each stage. Since various elements of the software are single threaded, others multithreaded, and some use GPUs, it is interesting to record the effects of CPU generations, speeds, number of cores, DRAM parameters and the GPU using this software.
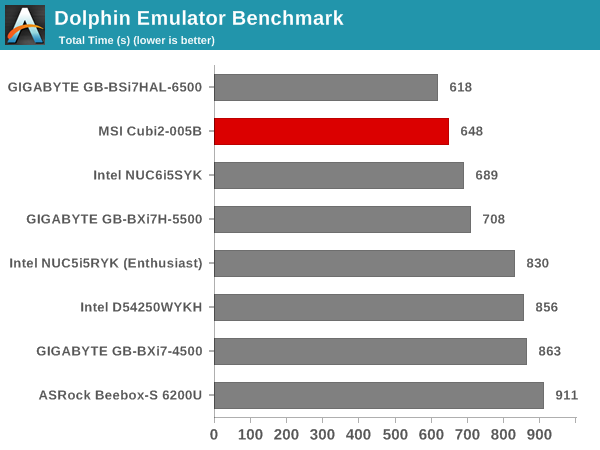
Dolphin Emulator
Wrapping up our application benchmark numbers is the Dolphin Emulator benchmark mode results. This is again a test of the CPU capabilities, and the cTDP-Up of the Skylake BRIX makes it come out on top.
Networking and Storage Performance
Networking and storage are two major aspects which influence our experience with any computing system. This section presents results from our evaluation of these aspects in the MSI Cubi2-005B. On the storage side, one option would be repetition of our strenuous SSD review tests on the drive(s) in the PC. Fortunately, to avoid that overkill, PCMark 8 has a storage bench where certain common workloads such as loading games and document processing are replayed on the target drive. Results are presented in two forms, one being a benchmark number and the other, a bandwidth figure. We ran the PCMark 8 storage bench on selected PCs and the results are presented below.
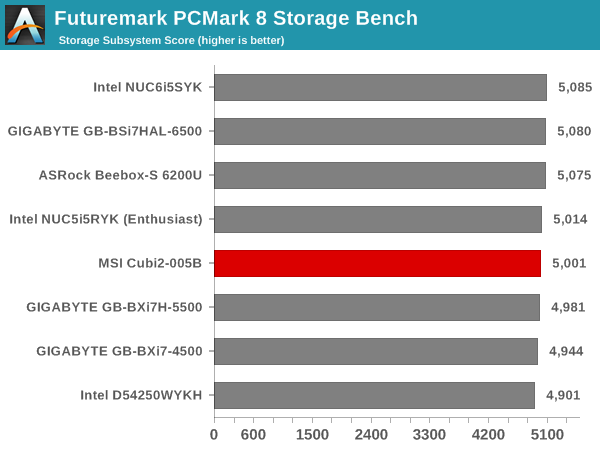
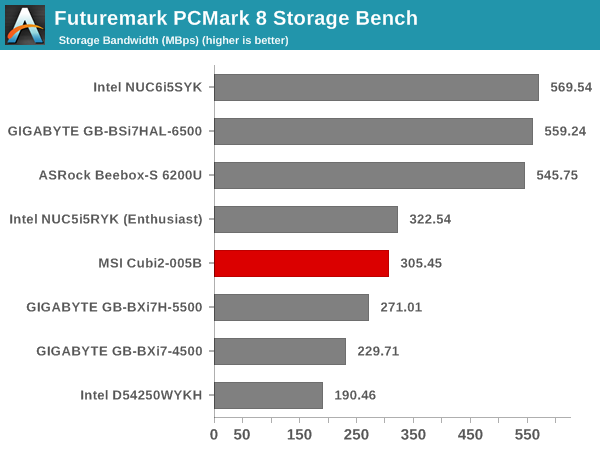
The 2.5" SATA SSD makes the Cubi2-005BUS come in the lower half of the storage benchmarks order (since most of the other PCs are using a NVMe SSD). However, the score (5001 vs. 5085 for the pack leader) shows that most consumers with office and gaming workloads do not have much to gain by going for a NVMe SSD compared to a SATA SSD.
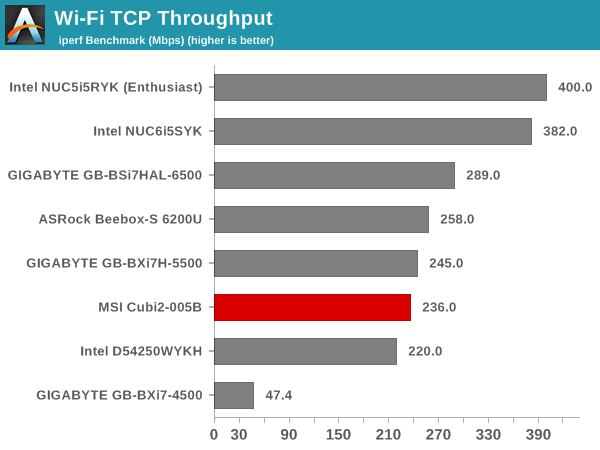
On the networking side, we restricted ourselves to the evaluation of the WLAN component. Our standard test router is the Netgear R7000 Nighthawk configured with both 2.4 GHz and 5 GHz networks. The router is placed approximately 20 ft. away, separated by a drywall (as in a typical US building). A wired client is connected to the R7000 and serves as one endpoint for iperf evaluation. The PC under test is made to connect to either the 5 GHz (preferred) or 2.4 GHz SSID and iperf tests are conducted for both TCP and UDP transfers. It is ensured that the PC under test is the only wireless client for the Netgear R7000. We evaluate total throughput for up to 32 simultaneous TCP connections using iperf and present the highest number in the graph below.
In the UDP case, we try to transfer data at the highest rate possible for which we get less than 1% packet loss.
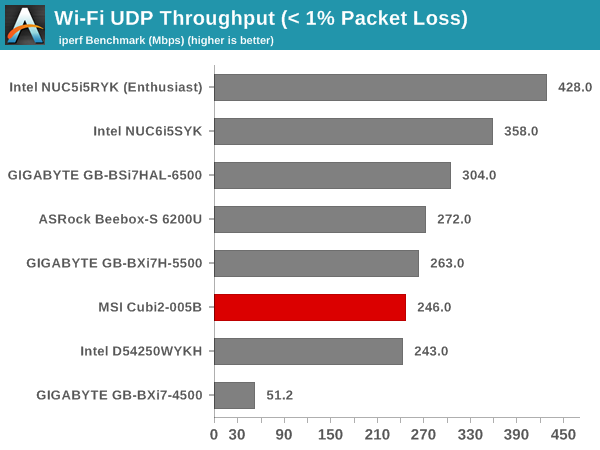
The 1x1 nature of the WLAN component (Intel AC3168) results in lower Wi-Fi performance compared to the PCs with 2x2 radios. Internal antenna placement and orientation also has an effect on these numbers.
HTPC Credentials
Subjectively speaking, the only time I could hear the Cbi2-005BUS fan was in our Prime95 and Furmark testing. For media playback workloads, the fan noise couldn't be heard at all. This is an acceptable HTPC for most users when it comes to the acoustic profile.
Refresh Rate Accuracy
Starting with Haswell, Intel, AMD and NVIDIA have been on par with respect to display refresh rate accuracy. The most important refresh rate for videophiles is obviously 23.976 Hz (the 23 Hz setting). As expected, the MSI Cubi2-005B has no trouble with refreshing the display appropriately in this setting.
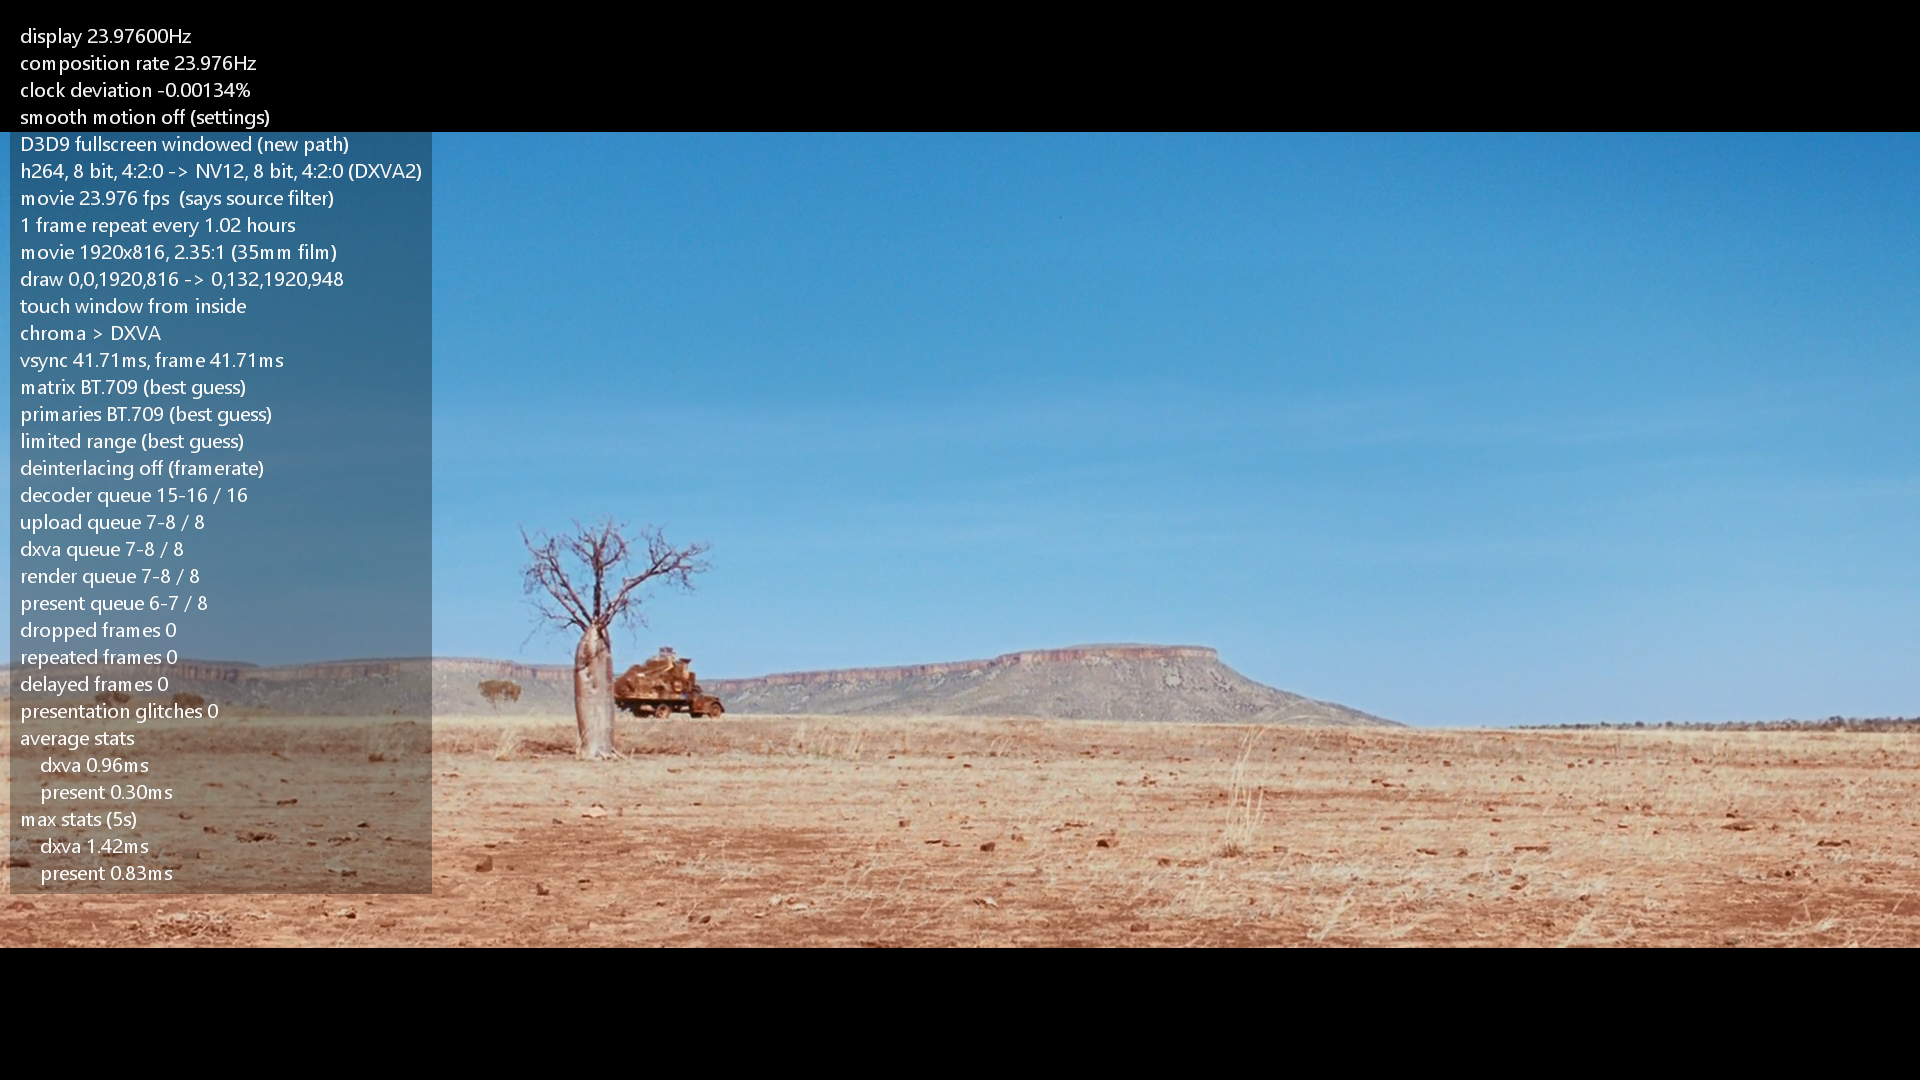
The gallery below presents some of the other refresh rates that we tested out. The first statistic in madVR's OSD indicates the display refresh rate.


Network Streaming Efficiency
Evaluation of OTT playback efficiency was done by playing back our standard YouTube test stream and five minutes from our standard Netflix test title. Using HTML5, the YouTube stream plays back a 1080p H.264 encoding. Since YouTube now defaults to HTML5 for video playback, we have stopped evaluating Adobe Flash acceleration. Note that only NVIDIA exposes GPU and VPU loads separately. Both Intel and AMD bundle the decoder load along with the GPU load. The following two graphs show the power consumption at the wall for playback of the HTML5 stream in Mozilla Firefox (v 50.1.0).
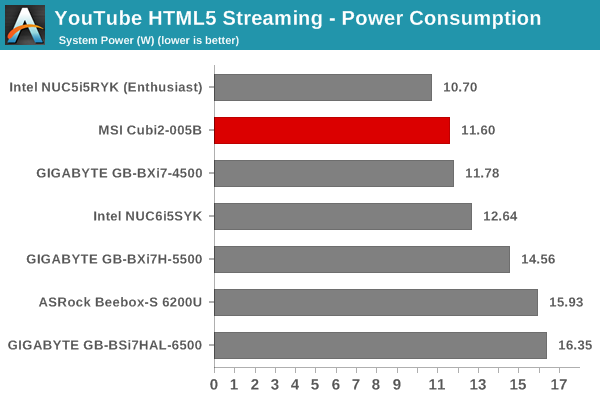
GPU load was around 14.19% for the YouTube HTML5 stream and 0.009% for the steady state 6 Mbps Netflix streaming case.
Netflix streaming evaluation was done using the Windows 10 Netflix app. Manual stream selection is available (Ctrl-Alt-Shift-S) and debug information / statistics can also be viewed (Ctrl-Alt-Shift-D). Statistics collected for the YouTube streaming experiment were also collected here.
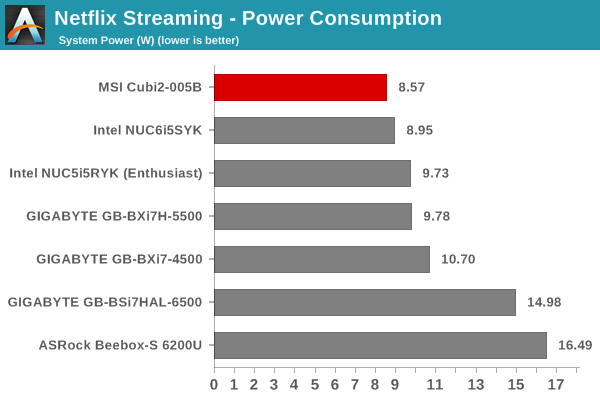
Given the configuration of the PC with a SATA SSD, and the overall power efficiency of Kaby Lake, it is no surprise that the Cubi2-005BUS is one of the most power efficient platforms for online streaming services.
We didn't evaluate 4K Netflix streaming on this PC because there is no HDCP 2.2 support.
Decoding and Rendering Benchmarks
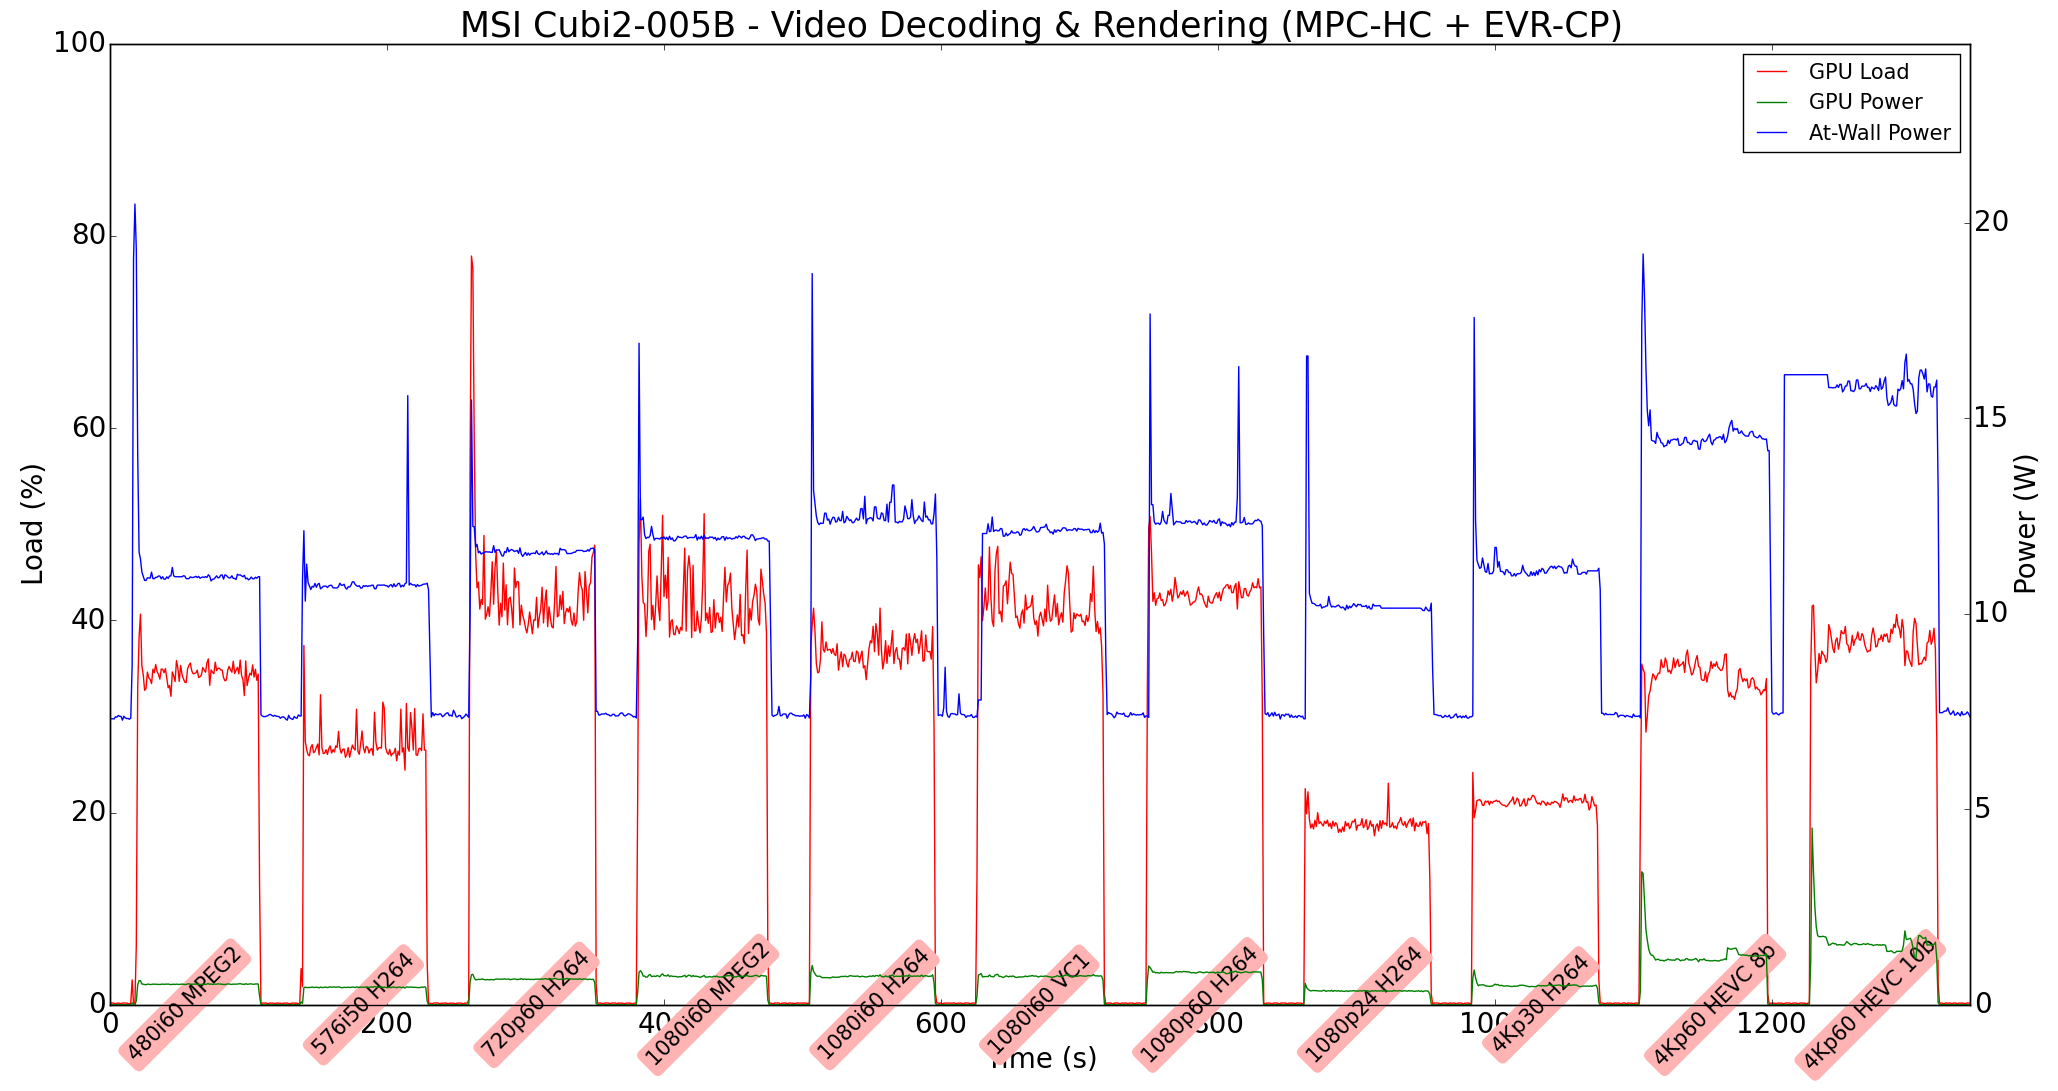
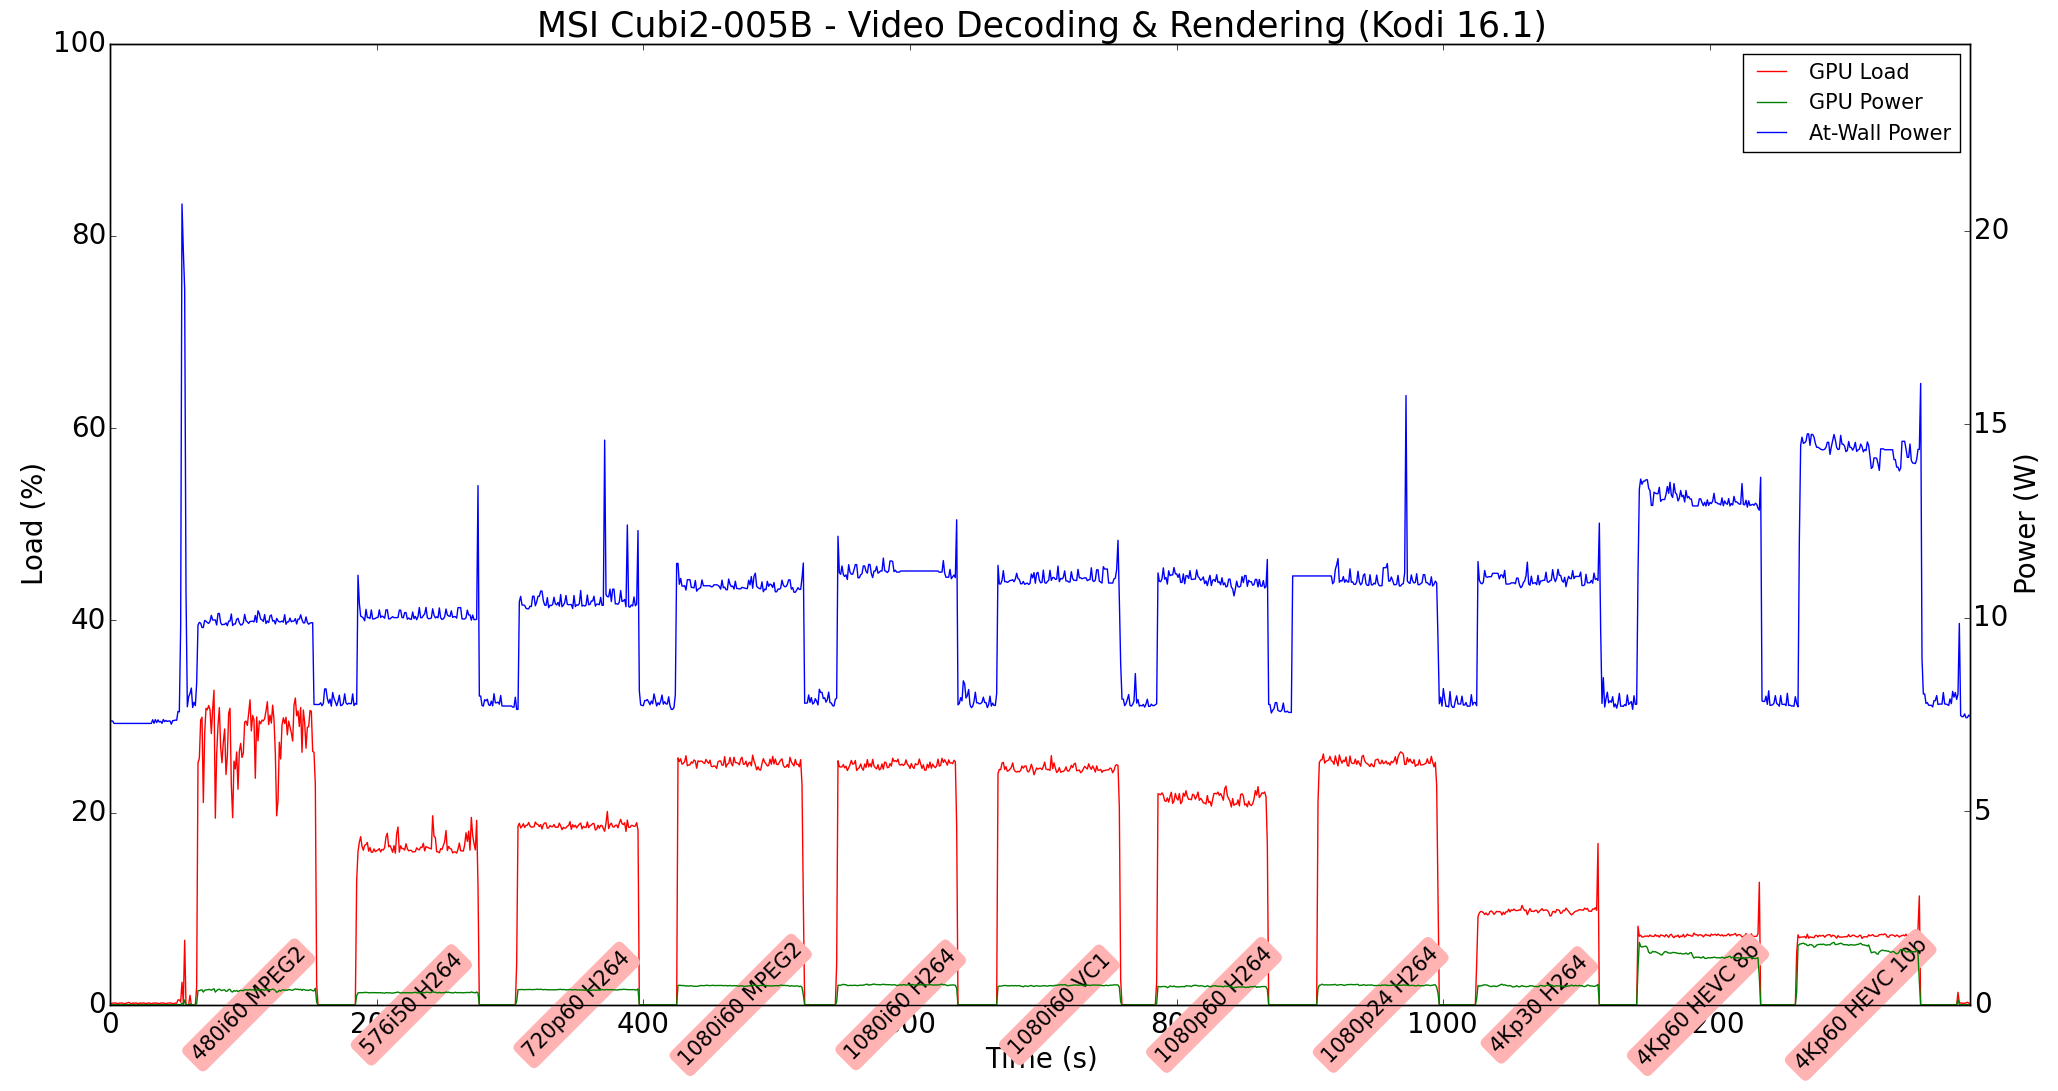
In order to evaluate local file playback, we concentrate on EVR-CP and Kodi 16.1. We already know that EVR works quite well even with the Intel IGP for our test streams. The decoder used was LAV Filters bundled with MPC-HC v1.7.10.276. We have now added HEVC streams to our test suite
In our earlier reviews, we focused on presenting the GPU loading and power consumption at the wall in a table (with problematic streams in bold). Starting with the Broadwell NUC review, we decided to represent the GPU load and power consumption in a graph with dual Y-axes. Eleven different test streams of 90 seconds each were played back with a gap of 30 seconds between each of them. The characteristics of each stream are annotated at the bottom of the graph. Note that the GPU usage is graphed in red and needs to be considered against the left axis, while the at-wall power consumption is graphed in green and needs to be considered against the right axis.
Frame drops are evident whenever the GPU load consistently stays above the 85 - 90% mark. The Cubi2-005BUS has absolutely no trouble in keeping up with the media playback use-cases
Moving on to the codec support, the Intel HD Graphics 620 is a known quantity with respect to the scope of supported hardware accelerated codecs (based on Intel's claims). DXVA Checker serves as a confirmation.
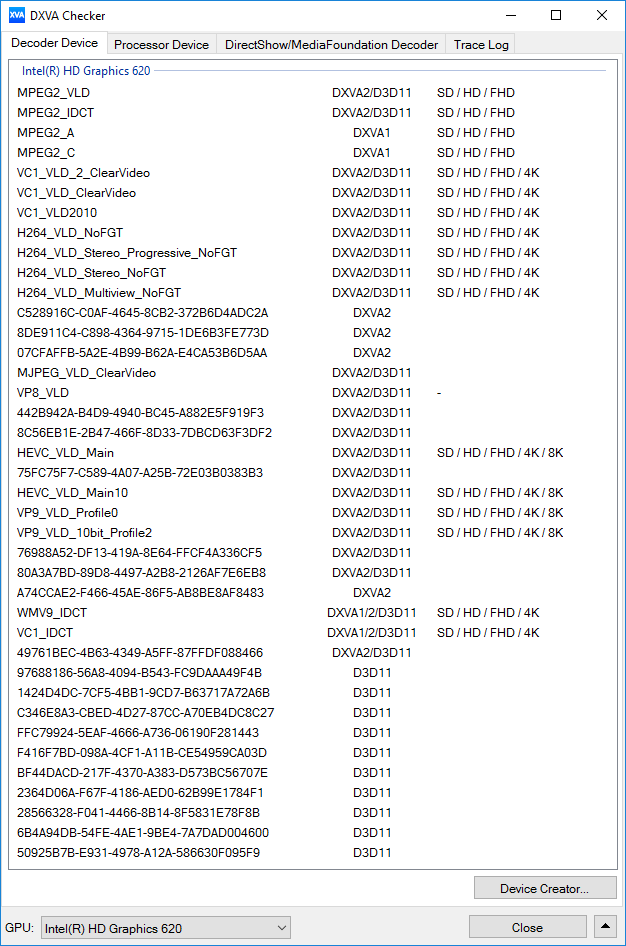
Kaby Lake-U has one of the most comprehensive codec supports in the market after Intel decided to add HEVC 8b and 10b full hardware decode. In fact, there is also support for 10-bit VP9 in the GPU. It is a pity that the display engine still doesn't support HDMI 2.0 natively.
Power Consumption and Thermal Performance
The power consumption at the wall was measured with a 1080p display being driven through the HDMI port. In the graphs below, we compare the idle and load power of the MSI Cubi2-005B with other low power PCs evaluated before. For load power consumption, we ran the AIDA64 System Stability Test with various stress components, as well as our custom stress test with Prime95 and Furmark, and noted the maximum sustained power consumption at the wall.
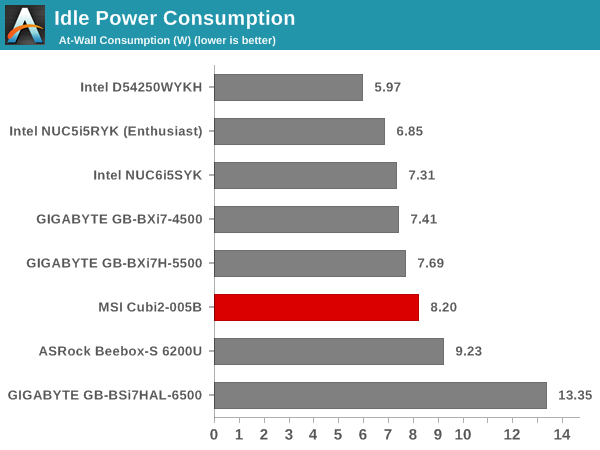
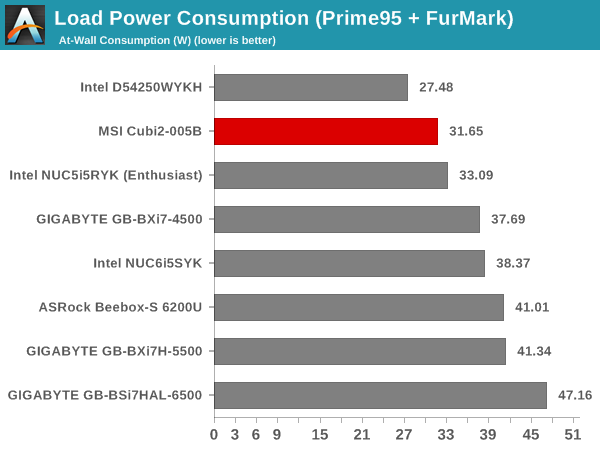
Even though Kaby Lake-U is touted to be very power efficient (and has been proved in some of the preceding sections), it looks like the BIOS could do with some tweaks for better idle power consumption. On the load side, we found Prime95 + Furmark providing the higher sustained power consumption number, as shown below in our thermal stress routine.
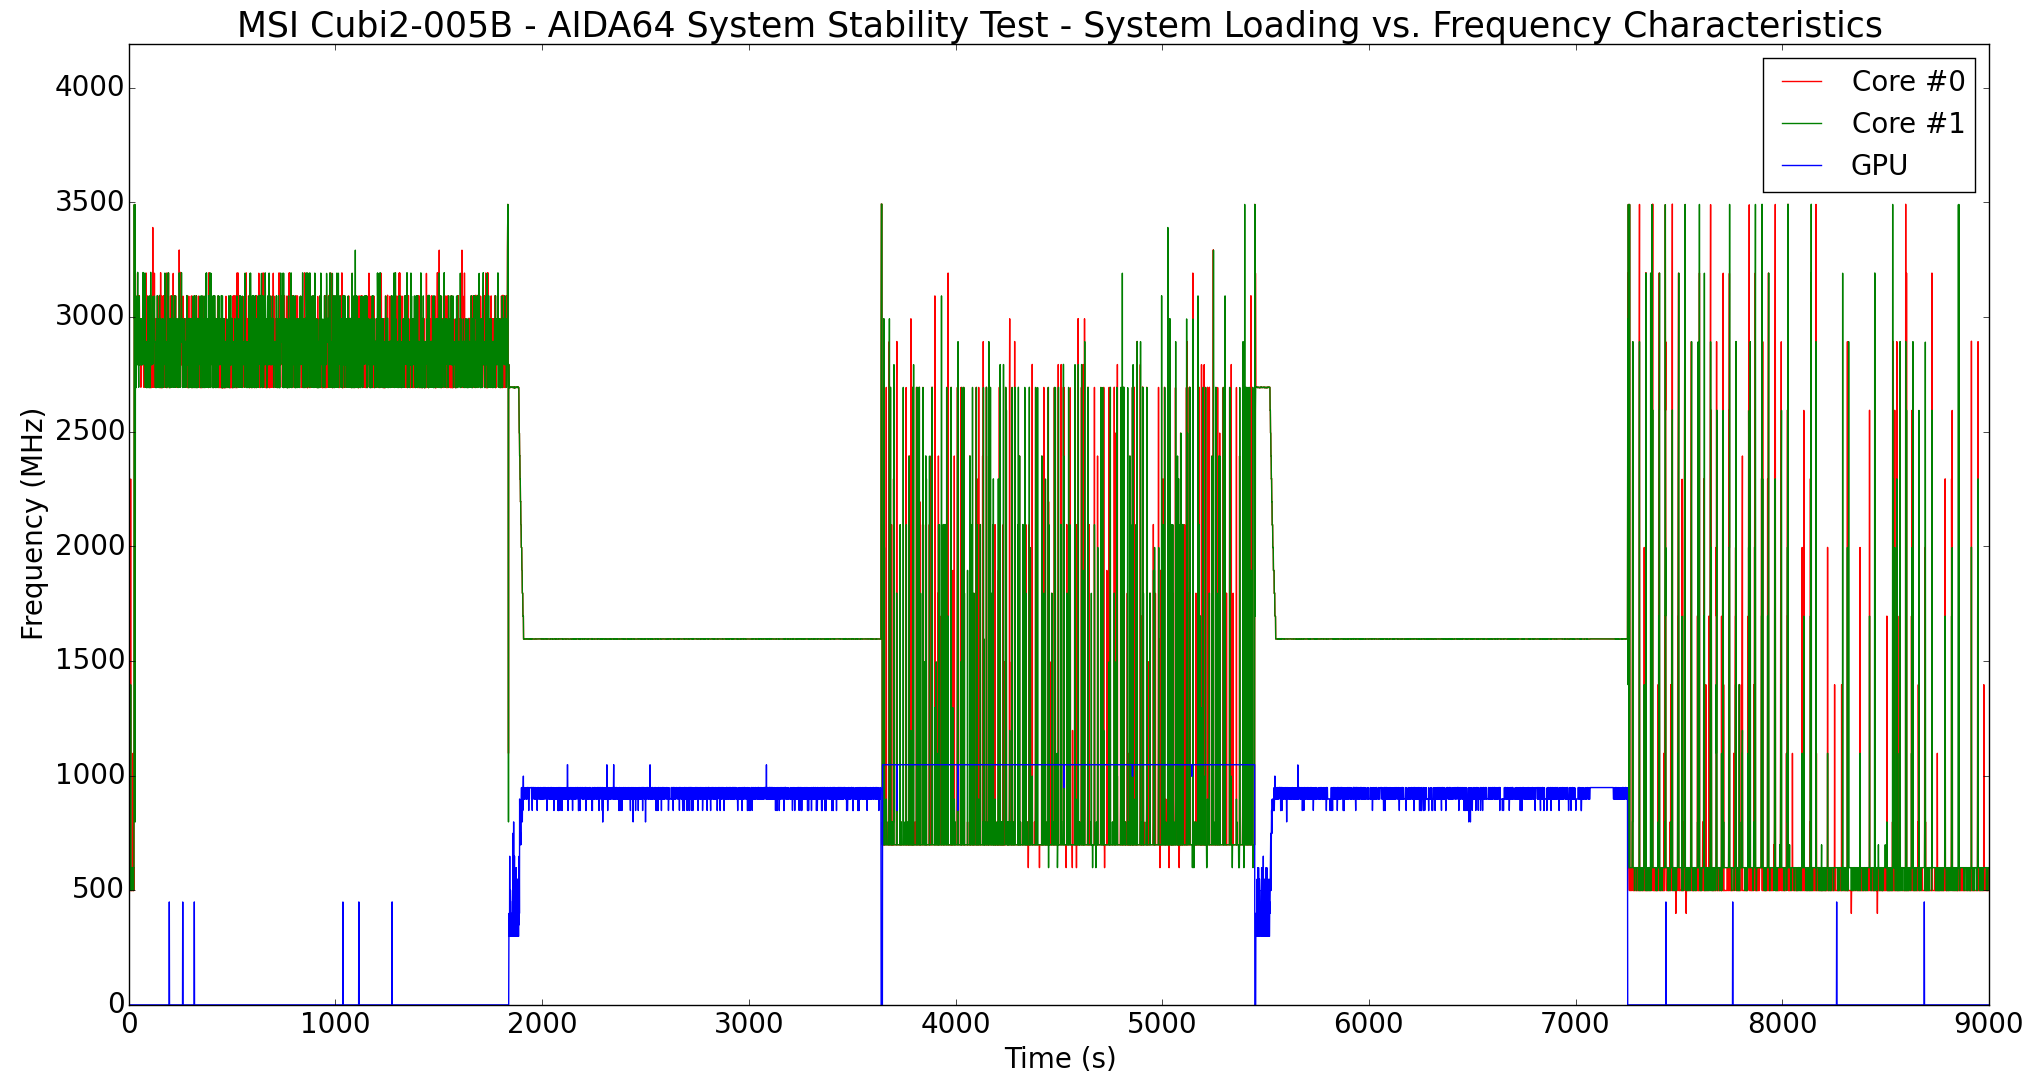
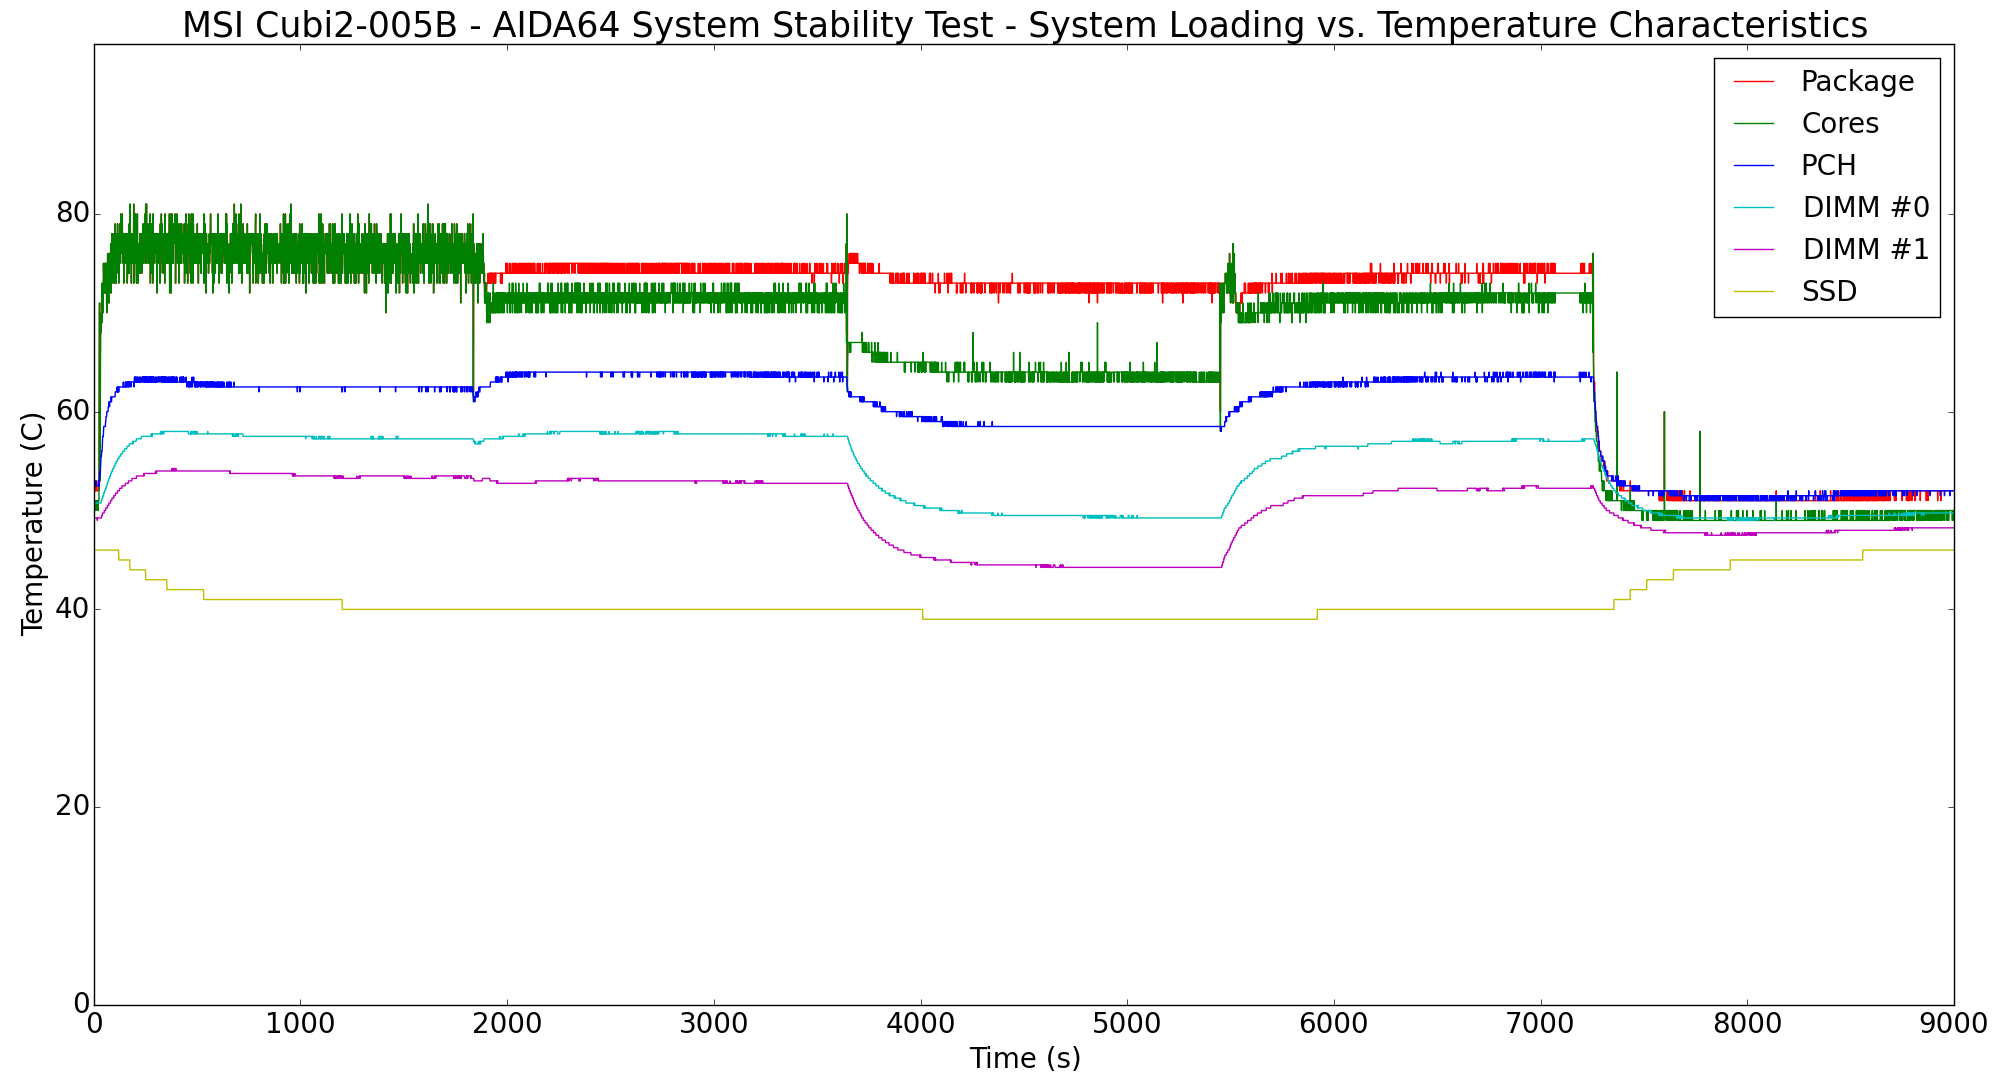
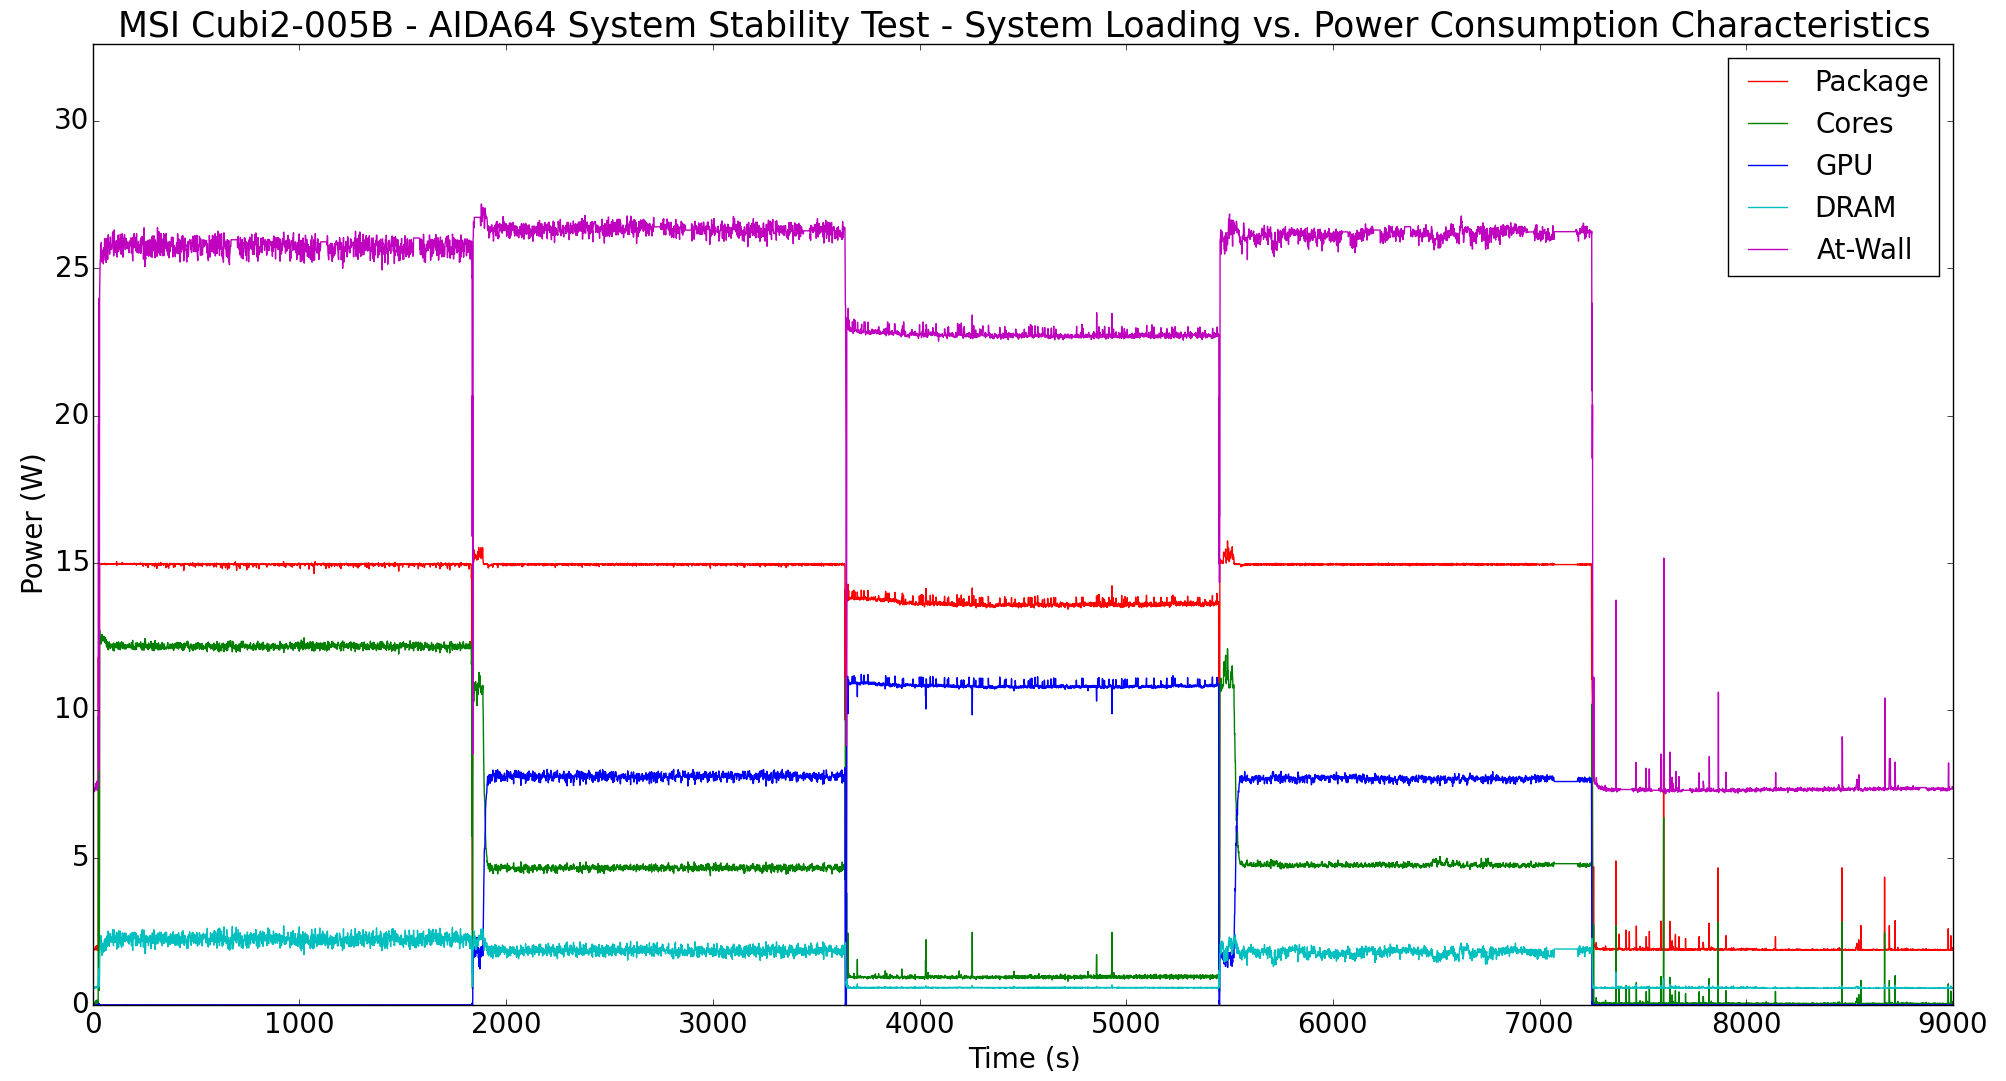
Our thermal stress routine starts with the system at idle, followed by four stages of different system loading profiles using the AIDA64 System Stability Test (each of 30 minutes duration). In the first stage, we stress the CPU, caches and RAM. In the second stage, we add the GPU to the above list. In the third stage, we stress the GPU standalone. In the final stage, we stress all the system components (including the disks). Beyond this, we leave the unit idle in order to determine how quickly the various temperatures in the system can come back to normal idling range. The various clocks, temperatures and power consumption numbers for the system during the above routine are presented in the graphs below.
We repeated the same observations with our legacy stress test using the latest versions of Prime95 and Furmark - Prime95 v28.10 for 30 minutes (after launching with the max. stress option), followed by Furmark v1.18.20 for 30 minutes. The Prime95 load is then removed, allowing just the GPU alone to be stressed for 30 minutes. The system is then left idle.
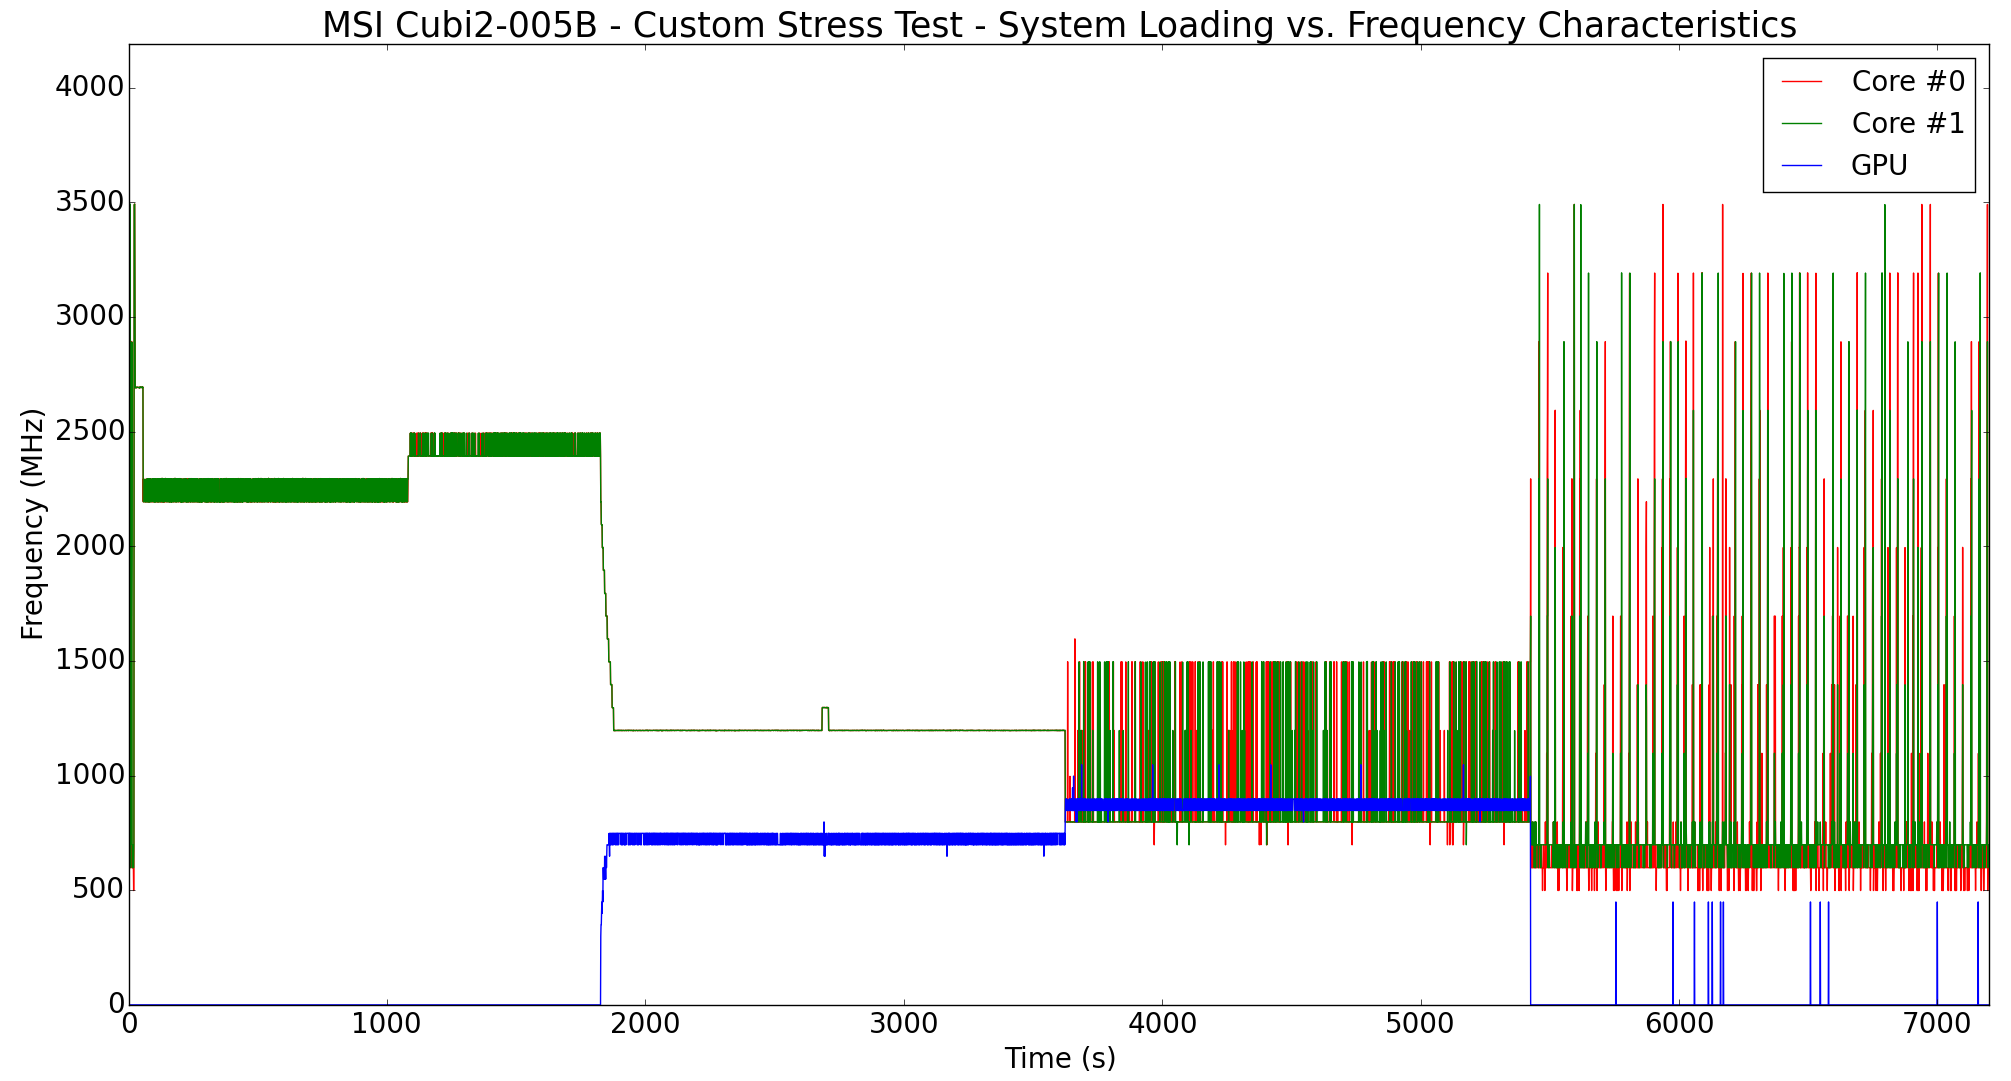
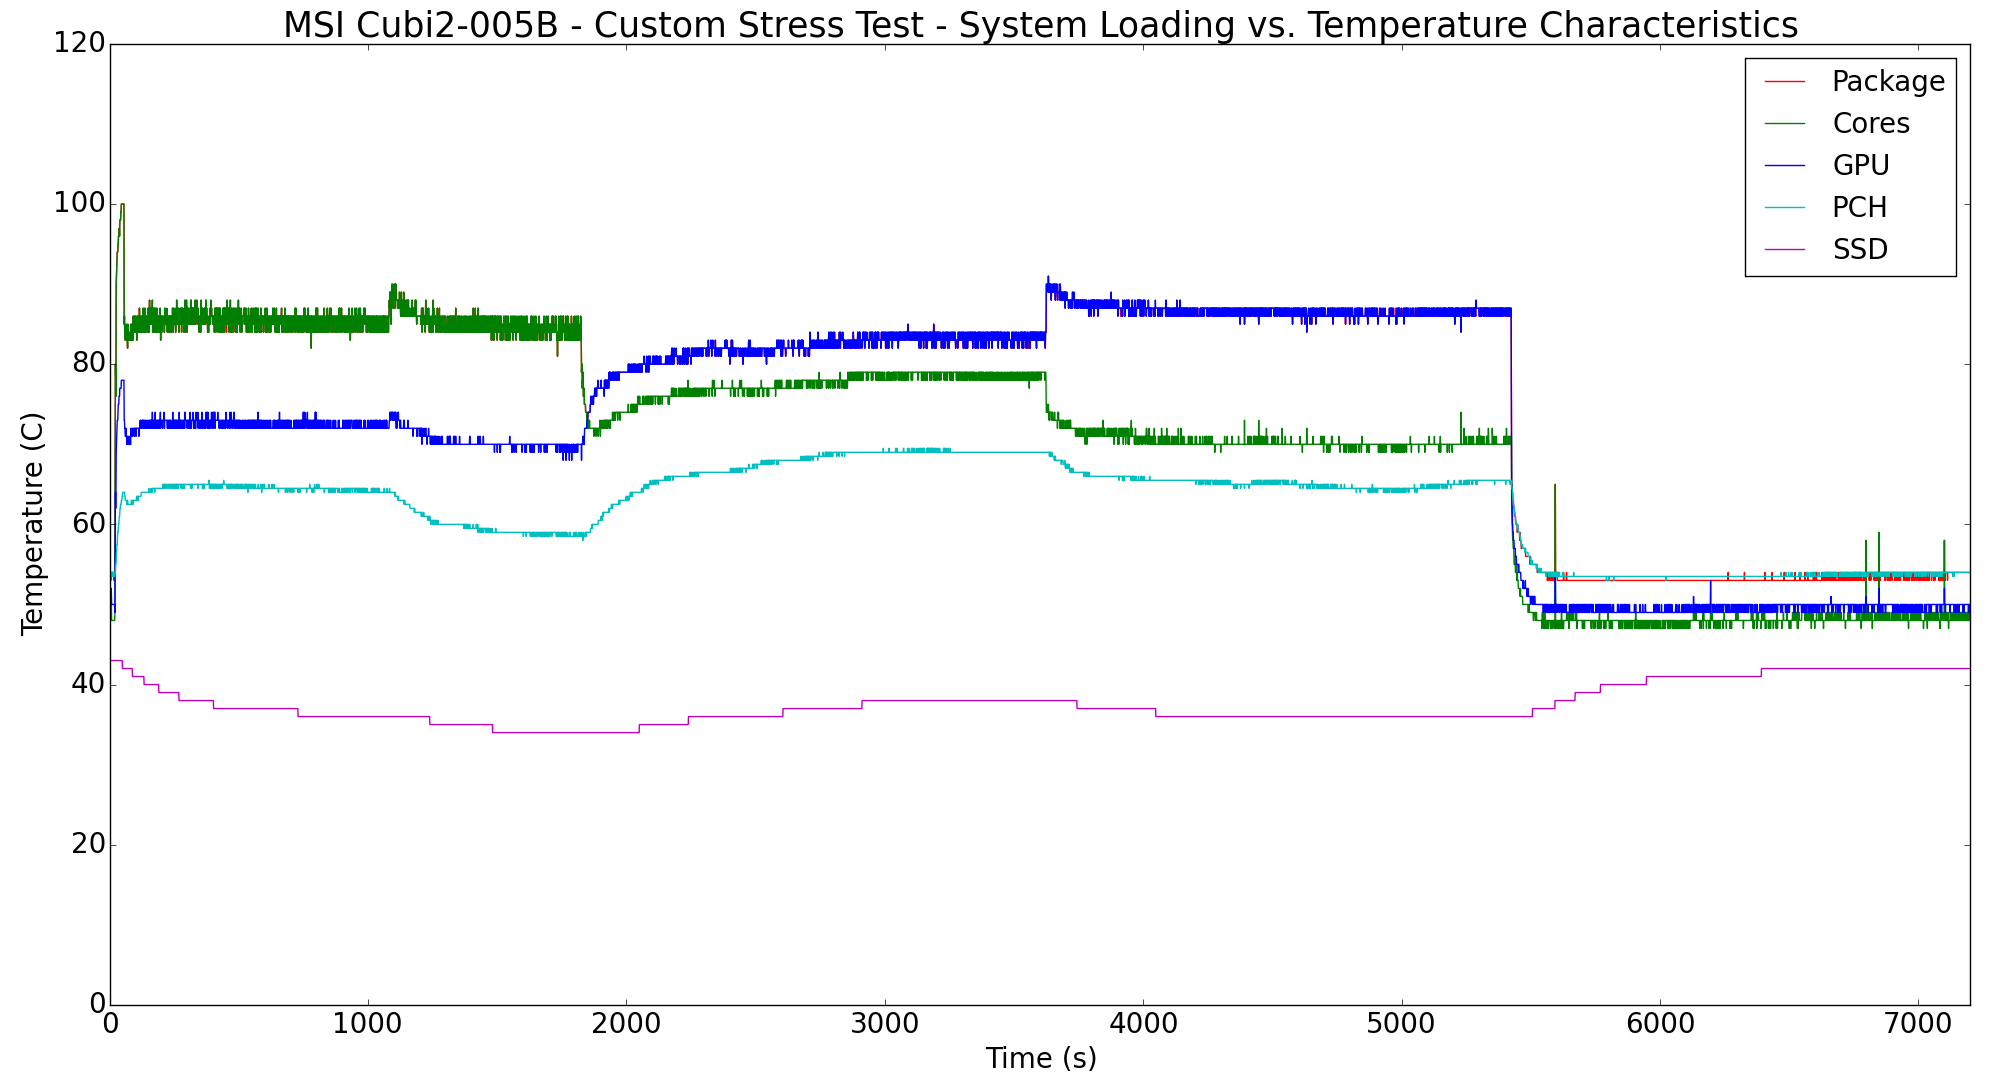
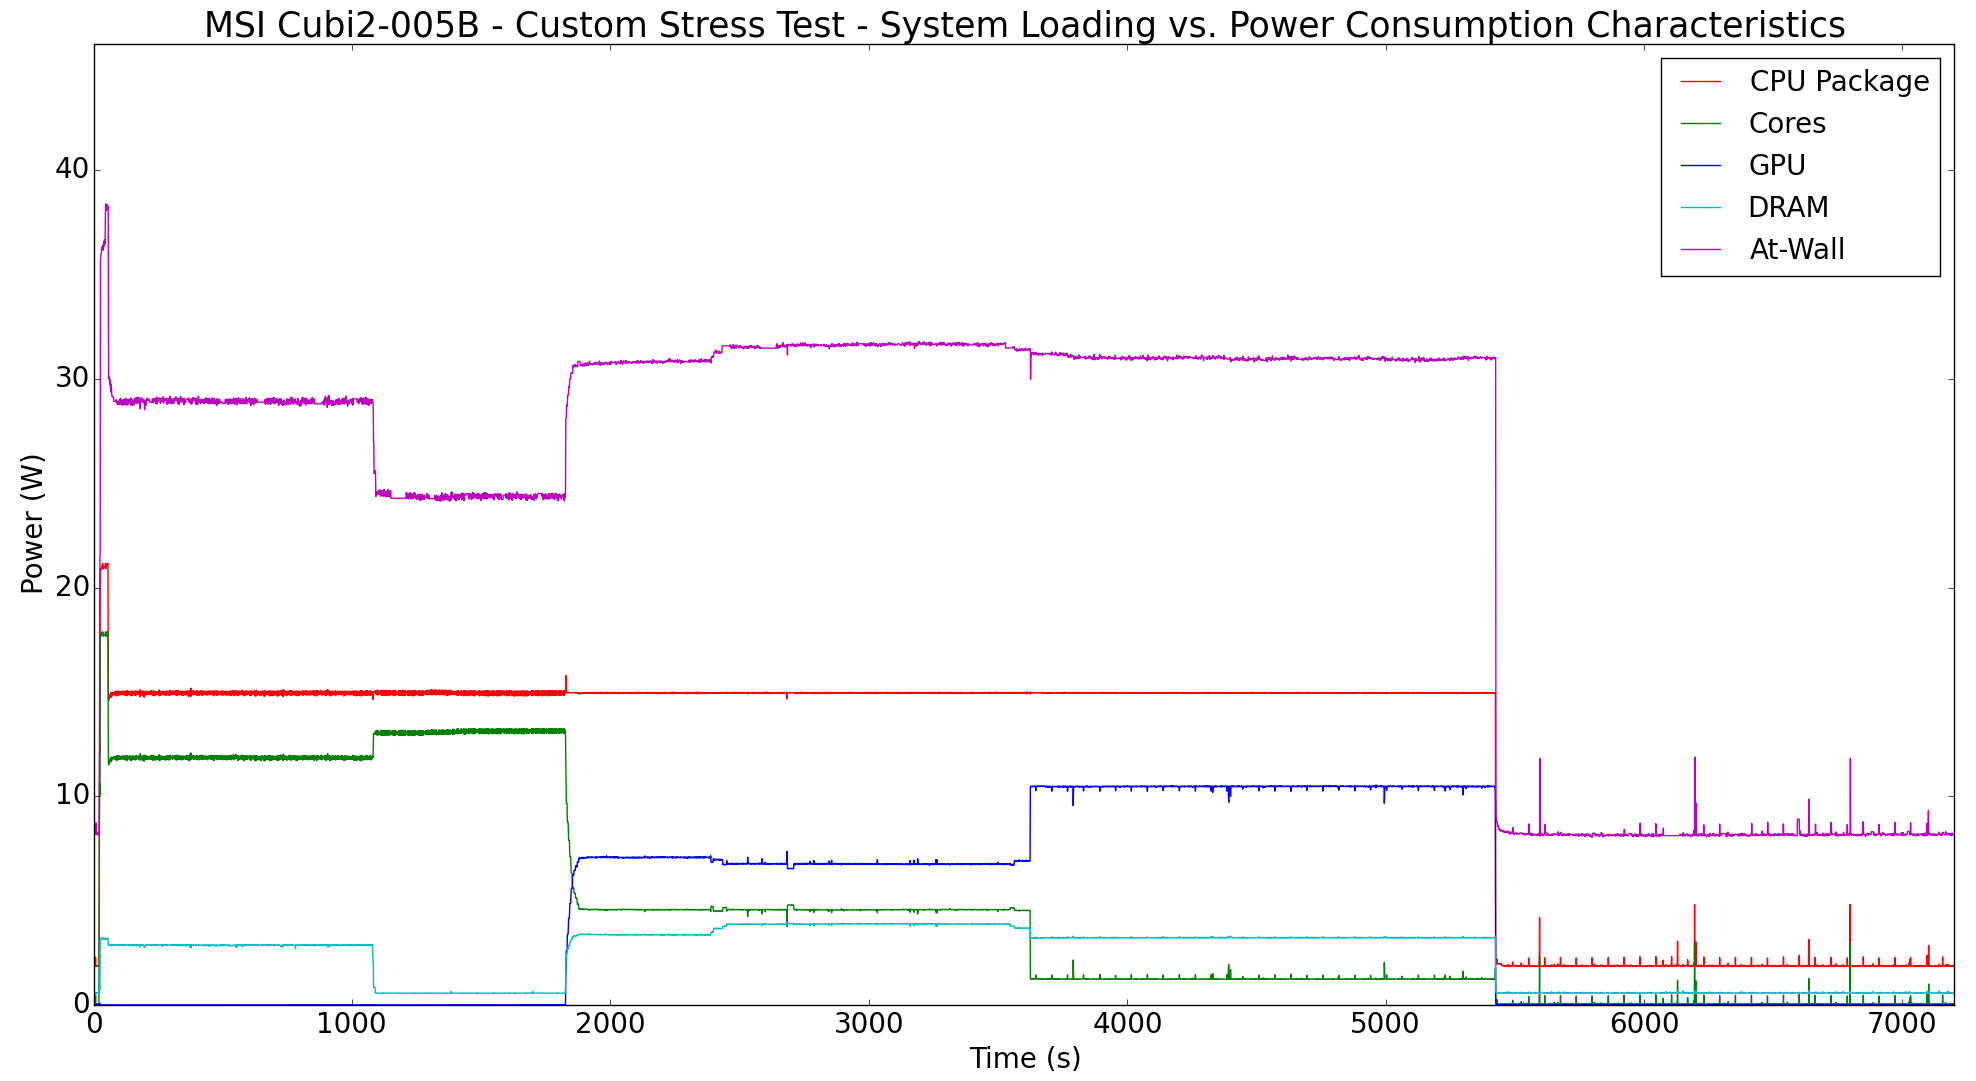
According to the official specifications, the junction temperature of the Core i7-7500U is 100 C. We find that the temperature is briefly reached with the Prime95 AVX2 workload. The package power also goes upwards of 20W in this case. However, the power limitation soon kicks in, and the package power is held stable at 15W throughout the stress workload. In the case of the AIDA64 SST (which is not pure AVX2 for the CPU stress case, but, more of an all-round test case), the package power is never more than 15W, and the core temperature stays around 80C.
On the whole, the Cubi 2's thermal solution is geared for a 15W TDP CPU. This is acceptable for almost all consumer use-cases, but, results in the performance numbers of the BRIX-series with cTDP-Up SKUs being better.
Final Words
The MSI Cubi2-005B provided us with the first opportunity to evaluate Kaby Lake-U in a desktop PC. MSI has decided to keep the normal TDP of 15W for the unit - that means we only see performance similar to what is obtained in the high-end ultrabooks. Some vendors like GIGABYTE like to utilize the configurable higher TDP for the CPU along with a noisier thermal solution. Other vendors like MSI prefer a better acoustic profile while maintaining decent performance. We are still not convinced by the absence of a M.2 2280 slot in the PC when others with the same form factor like the Intel NUC are able to accommodate it. The Cubi 2 also decides to forego the full-HTPC solution route by not supporting 4Kp60 over its HDMI port. HDCP 2.2 also seems to be absent. However, the other media capabilities like full hardware decode for 4Kp60 HEVC Main and Main10 profile videos are present in the PC.
Kaby Lake-U deliver on its promise of better power consumption and energy consumption numbers for the same workload when compared to Skylake. It delivers a solid UCFF PC platform for consumers wishing to upgrade anything based on Haswell or older generation PCs.
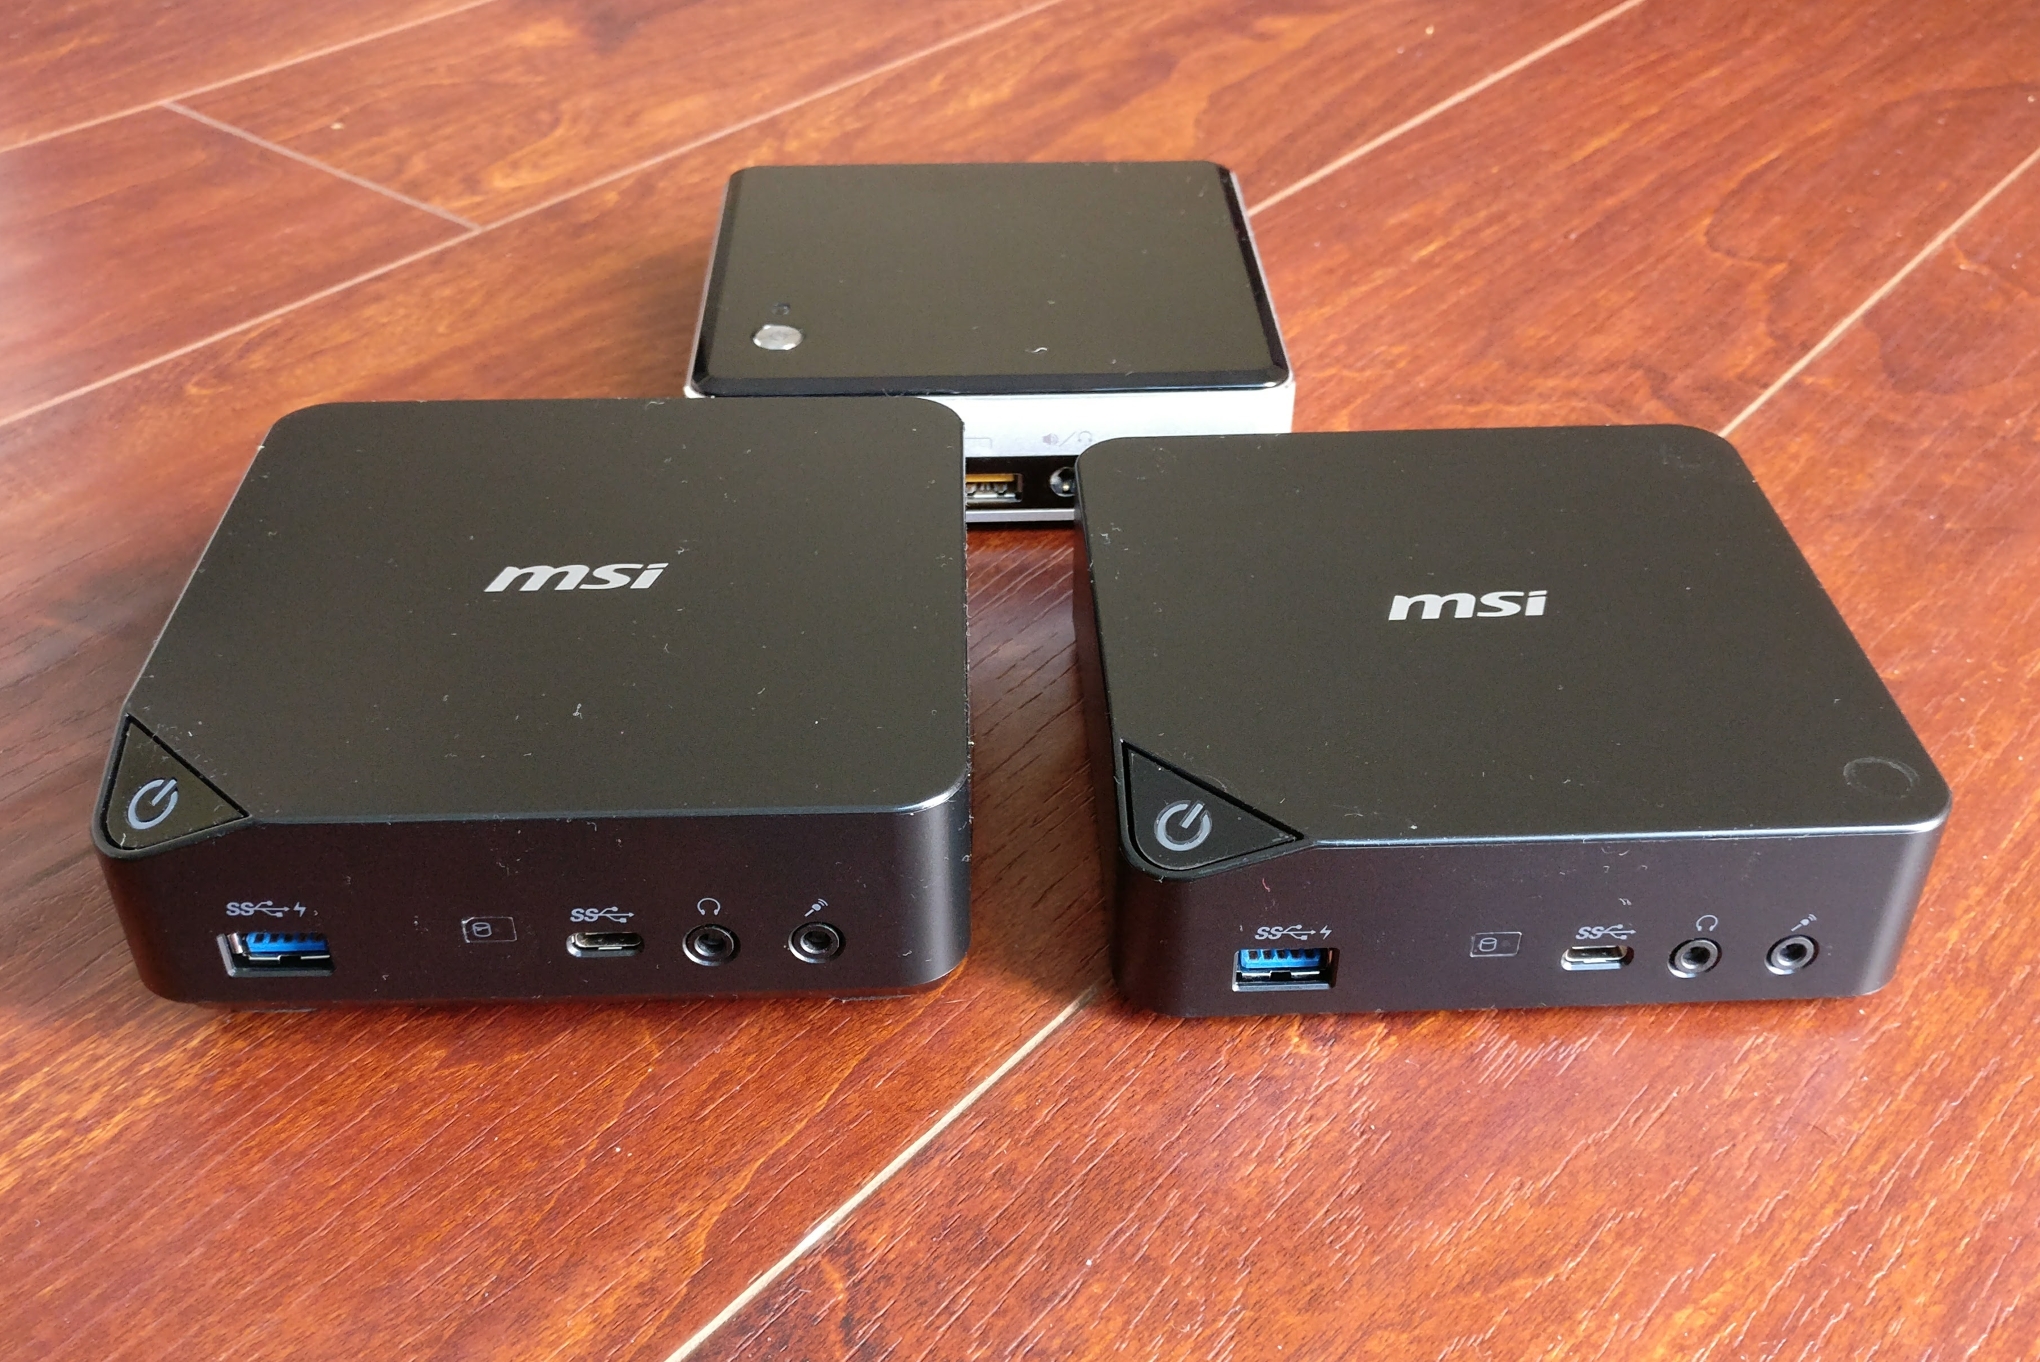
The Cubi2-005B with 2.5" Drive Bay (left) and the Cubi2-005B without a 2.5" Drive Bay (right), compared with the NUC6i5SYK (top)
MSI deserves praise for creating a design that enables users to accommodate 2.5" drives with minimal to no impact on the form factor of the machine. However, there is definitely scope for improvement - MSI should definitely put in a M.2 2280 slot instead of the current M.2 2242 for SSDs. In addition, their RAM slots also need to be better design. Fitting in SODIMMs with just thick labels over the DRAM chips was a no-go. We had to remove the labels so that the SODIMMs could fit in better. Otherwise, one of the two tabs on either side wouldn't fit over the SODIMM, and Windows would end up with BSODs. Strangely, we didn't have any such trouble in the Cubi 2 Plus reviewed earlier this year (though, that was in the mini-STX form factor)
MSI has three different SKUs for the Cubi 2. In addition to the Core i7-7500U-based Cubi2-005BUS reviewed here, we also have the Cubi2-007BUS with Core i3-7100U and the Cubi2-006BUS with the Core i5-7200U. Other than the core CPU, the other features of the units are all the same. In terms of pricing, the barebones configuration range from $295 to $500, though we did see Amazon's prices fluctuate a bit while processing the review.
On the whole, the Cubi2-005B shows users the base performance and featres that one might expect from a Kaby Lake-U UCFF PC. Over the next few months, we will be reviewing a few more Kaby Lake-U PCs that bring in features like HDMI 2.0b and full Netflix 4K support with HDCP 2.2.


