Original Link: https://www.anandtech.com/show/11499/futuremark-pcmark-10
Test Driving Futuremark's PCMark 10 Benchmark
by Ganesh T S on June 5, 2017 6:00 AM EST- Posted in
- Systems
- Futuremark
- Benchmarks
- PCMark 10

Futuremark is a well-respected provider of computer benchmark applications. Their PCMark and 3DMark benchmarks have been around for almost 20 years, and provide a good indication of the system performance for various workloads. Today, Futuremark is launching PCMark 10, their seventh major update to the PCMark series of benchmarks first launched in 2002. PCMark 10 builds upon the PCMark 8 platform, adds a few workloads and streamlines the rest in order to present a vendor-neutral, complete, and easy-to-use benchmark for home and office environments. Futuremark provided us with a preview copy of the benchmark, and we took it for a test drive.
Introduction and Evaluation Setup
Futuremark's first unified benchmark for evaluation of system performance was PCMark 2002, released in March 2002. It was followed by PCMark 04 in late 2003, and PCMark 05 (with support for Windows Vista). PCMark Vantage was introduced in 2007 for evaluation of systems running Windows 7, and PCMark 7 in 2011. PCMark 8 was launched in 2013, with full support for Windows 8 / 8.1. Even though Windows 10 is not an officially supported OS, we have had no issues in processing the PCMark 8 workloads on machines running that OS. PCMark 10 brings official support for Windows 10.
PCMark 10, like BAPCo's SYSmark 2014 SE, caters mainly to system vendors who want to bid for government contracts / tenders for high-volume PC purchases from businesses and enterprises. The PCMark scores help the vendors in advertising a performance level for their systems. From the other perspective, it can also help businesses to mandate a minimum performance level for systems that they hope to purchase. PCMark 10 measures system performance using workloads based on real-world applications and activities reflective of the usage of modern-day PCs in an office environment.
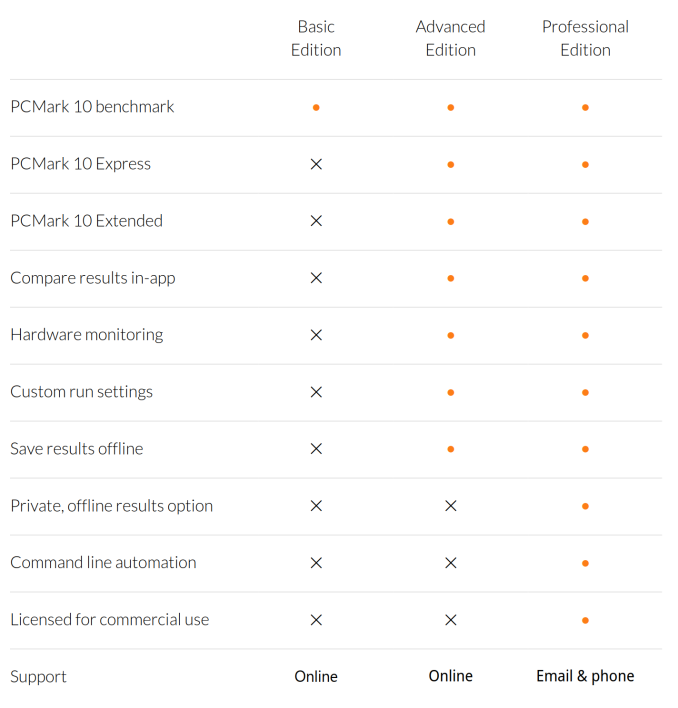
PCMark 10 comes in three different flavours - the Basic edition is free to download, while the Advanced edition costs $30 (suitable for home consumers). The Professional edition is the one suitable for business use, and it comes with a host of features that make the benchmark easy to use in an automated manner. Pricing for the professional edition is not public.
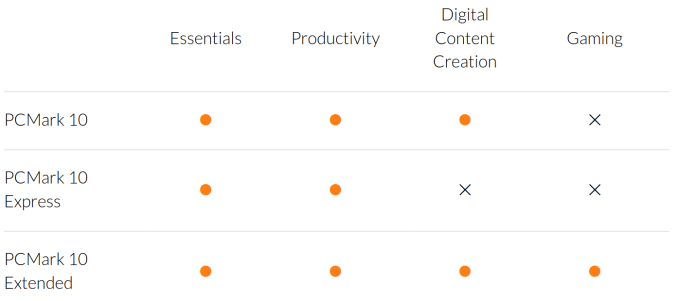
The PCMark 10 benchmark can be processed in one of three built-in modes - default, express or extended. These built-in modes correspond to benchmark definitions (in XML) that are supplied along with the installation. User-generated XML files conforming to the correct format can be created for custom benchmarks. The 'Express' benchmark is a subset of the default one, which, in itself, is a subset of the 'Extended' benchmark. The express benchmark and focuses on typical office workloads such as web browsing and selected productivity tasks. The 'Extended' tests add demanding graphics and physics test to provide an idea of the CPU as well as the GPU performance.
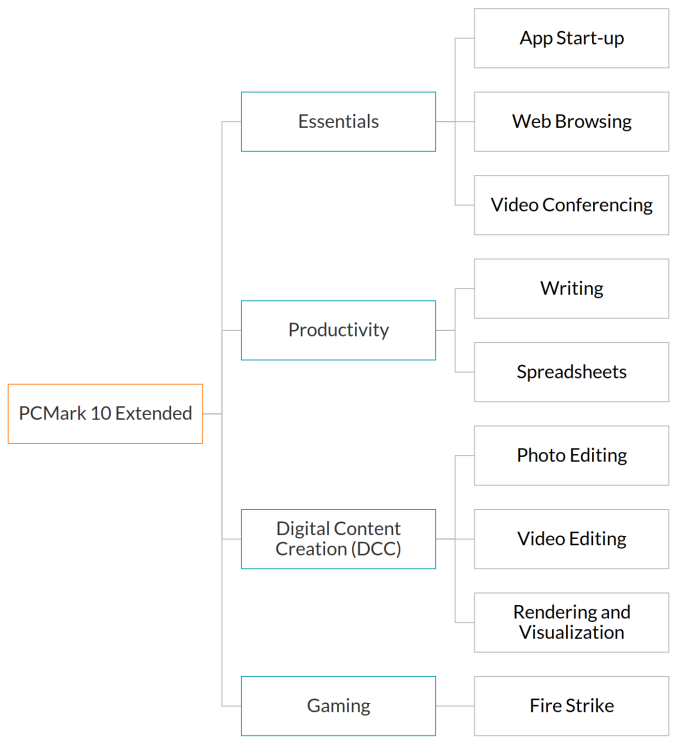
Each of these workloads is composed of sub-tests, as shown below.
The application start-up workload involves measuring the time taken to launch a number of programs of varying complexity such as the Chromium web browser, the Firefox web browser, LibreOffice Writer word processor, and the GIMP image manipulation program. Web browsing tests involve navigation of a social media site, online shopping, map navigation, video playback (H.264 and VP9 at 1080p and 4K resolutions), and a static web page, using both Firefox and Chromium. The video conferencing workload deals with both low-quality one-on-one conferencing (720p30 H.264 encode and decode, as well as face detection running on an available OpenCL device or CPU), as well as high-quality group conferencing (1080p30 H.264 encode, and 3x 720p30 H.264 decode, as well as face detection). Productivity tests involve word processing (using LibreOffice Writer) and spreadsheet editing (using LibreOffice Calc). Digital content creation tests involve photo editing (using ImageMagick, capable of OpenCL acceleration) with various filters, video editing (using ffmpeg, capable of OpenCL acceleration) for downscaling, sharpening and deshaking, and rendering and visualization. The last workload uses the OpenGL 4.3 code path from 3DMark's Sling Shot workload, and a custom POV-Ray workload. The gaming tests are directly from the 3DMark Fire Strike workload.
Setting up the Evaluation Flow
We processed PCMark 10 on a number of systems that we had readily configured. The details of the systems are presented in the next section. The first step was to create an installation script. Though PCMark 10 offers an uninstall option, I have found it better to create a system image prior to installation of such benchmarks. This provides us with an option to perform 'System Image Recovery' to go back to the prior version. Towards this, I created the following Powershell script, assuming that a USB drive with the volume label 'PCImageBackups' is connected to the system.
$BackupVolume = Get-Volume -FileSystemLabel PCImageBackups
$BackupDrive = $BackupVolume.DriveLetter + ":"
Write-Host "`nUsing ${BackupDrive} for backing up..."
wbAdmin start backup -backupTarget:$BackupDrive "-include:C:,D:" -allCritical -quiet
Write-Host "`nInstalling PCMark 10..."
cmd /c start /wait .\pcmark10-setup.exe /quiet /silent
& 'C:\Program Files\Futuremark\PCMark 10\PCMark10Cmd.exe' --register=<PCMark10 Pro Key>
After executing the above script (resident in the same folder as pcmark10-setup.exe), the following run script was then copied over to a local folder on the machine, and the system was restarted after dismounting all attached USB drives.
$CWD = (Get-Item -Path ".\" -Verbose).FullName
& 'C:\Program Files\Futuremark\PCMark 10\PCMark10Cmd.exe' --definition=pcm10_extended.pcmdef --out=$CWD\bmark.pcmark10-result --export-pdf=$CWD\bmark.extended.pdf --systeminfo on --systeminfomonitor on
Processing the above script generated the benchmark results in the same folder as that of the script. The results file could be opened in the PCMark 10 application to observe the monitoring data and low-level workload scores, while the PDF held a portable copy of the high-level results and system information.
BAPCo SYSmark 2014 SE - A Comparison
BAPCo's SYSmark 2014 SE was released recently, and it caters to the same market segment as the Futuremark PCMark 10. Having set up an evaluation flow using SYSmark 2014 SE recently, it was interesting to try out PCMark 10 and evaluate its approach to system benchmarking. The SYSmark 2014 SE flow is considerably more complicated, as it uses commercial versions of programs such as Adobe Acrobat. This creates issues with clean uninstallation of the benchmark (the system image creation scripting was done as a solution for that initially). Fortunately, PCMark 10 doesn't use any commercial software as part of its workloads. SYSmark 2014 SE tries to ensure that all OS settings are consistent across different benchmark runs as long as a particular profile is loaded. Unfortunately, PCMark 10 has a set of default internal settings, but really doesn't care about the OS settings. In the course of our evaluation of PCMark 10, we found that scores could vary widely with different OS settings, making it the prerogative of the benchmark processor to ensure consistency while evaluating different systems. We document that, as well as additional selected sensitivity analysis, in the next section.
Benchmark Processing and Sensitivity Analysis
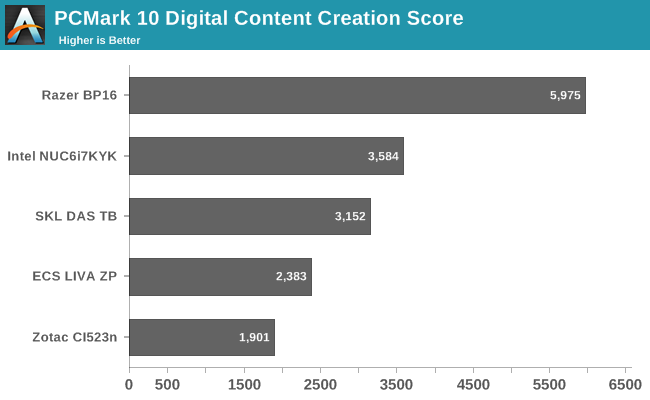
The PCMark 10 Extended benchmark was processed on a wide range of systems based on Skylake / Kaby Lake (since those were the ones that we had readily available). These ranged from a high-end gaming notebook to a passively-cooled mini-PC. The following list includes the main specifications of the systems.
- High-end Gaming Notebook: Razer Blade Pro 2016 (Razer BP16)
- Intel Core i7-6700HQ, NVIDIA GTX 1080 8GB, 32GB LPDDR4, 2x Samsung PM961 1TB
- High-end mini-PC: Intel Skull Canyon NUC (Intel NUC6i7KYK)
- Intel Core i7-6770HQ, Intel Iris Pro Graphics 580, 32GB LPDDR4, 1x Samsung 950 PRO 512GB
- Mid-range mini-PC: ECS LIVA Z Plus (ECS LIVA ZP)
- Intel Core i5-7300U, Intel HD Graphics 620, 4GB LPDDR4, 1x Transcend MTS400 128GB
- Passively-cooled mini-PC: Zotac ZBOX CI523 nano (Zotac CI523n)
- Intel Core i3-6100U, Intel HD Graphics 520, 16GB DDR3L, 1x Samsung SSD 840 EVO 128GB
- Mid-range Desktop PC: AnandTech's DAS Testbed (GIGABYTE Z170X-UD5 TH with Core i5-6600K) (SKL DAS TB)
- Intel Core i5-6600K, Intel HD Graphics 530, 32GB DDR4, 1x Samsung SSD SM951 256GB
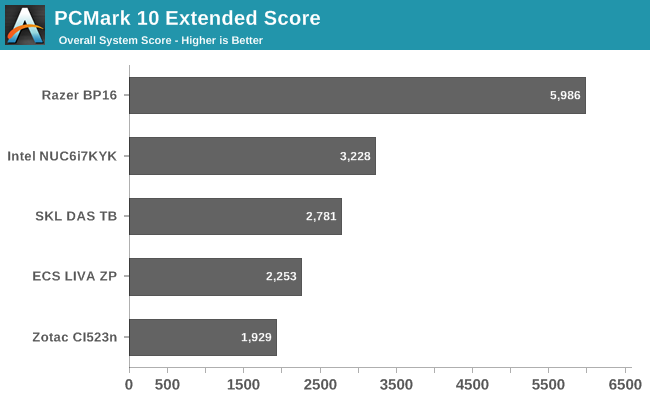
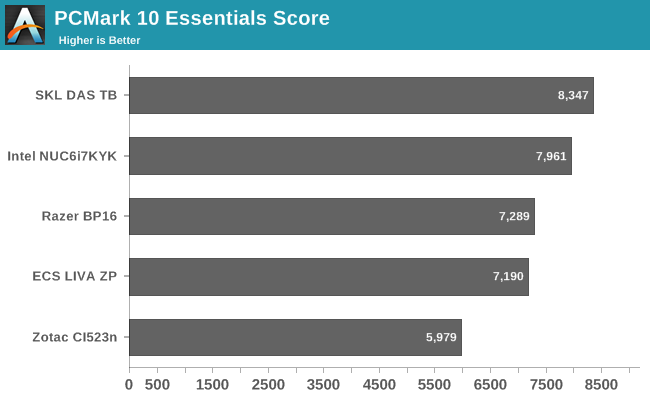
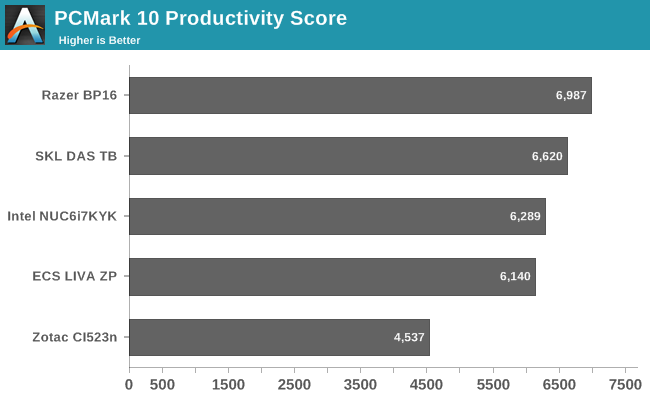
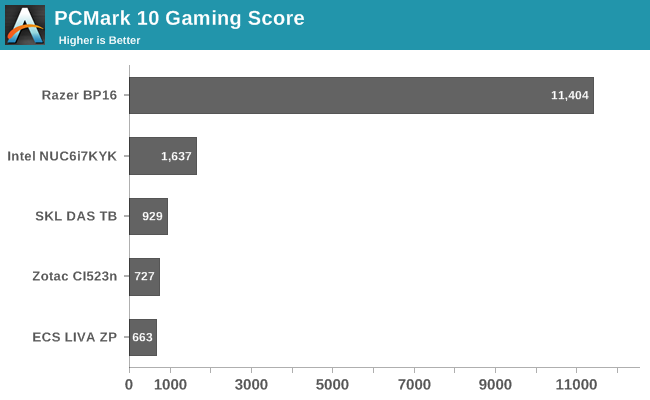
Sensitivity analysis was performed for three different aspects:
- Display resolution
- DRAM configuration
- Windows 10 Power Profile setting
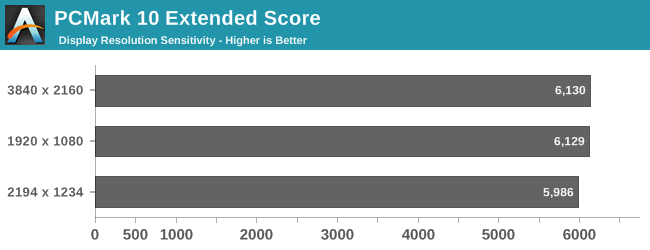
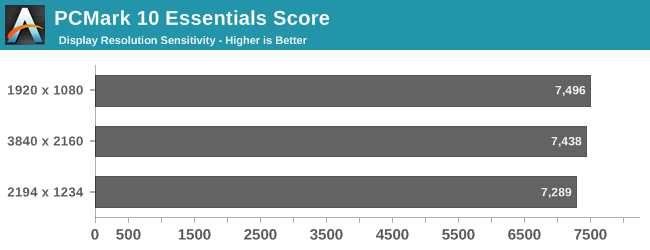
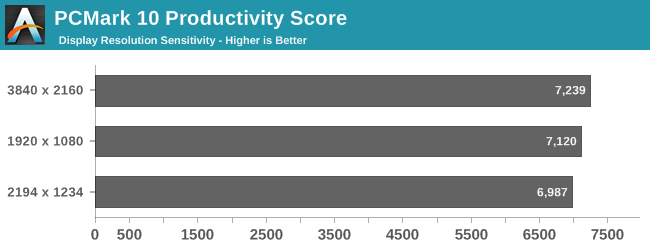
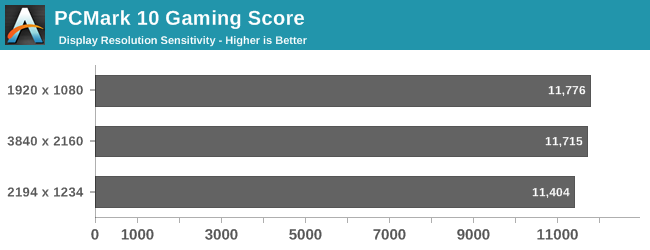
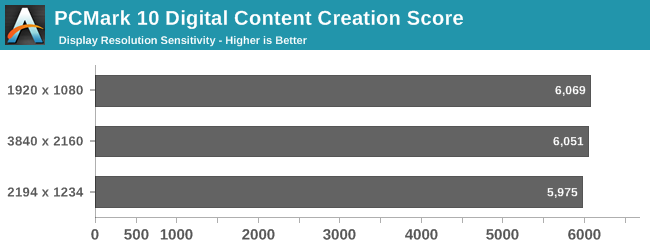
In order to test out the sensitivity of the scores to the display resolution, we chose the Razer Blade Pro 2016 as the test system. One of the interesting aspects with DPI scaling is that PCMark 10 reports the effective resolution. For example, with the Razer Blade Pro set to 175% scaling, the 4K screen was recorded as 2194 x 1234 px. We ran the PCMark 10 Extended benchmark at that resolution, and also with the DPI scaling set to 100% (for a 3840 x 2160 resolution). In addition, we also drove a 1080p monitor over the HDMI port and set it as the sole display before processing the benchmark. The results below show that resolutions of 1080p and above all result in no significant differences in the PCMark 10 scores. That said, having DPI scaling activated seems to affect the scores negatively by a small amount.
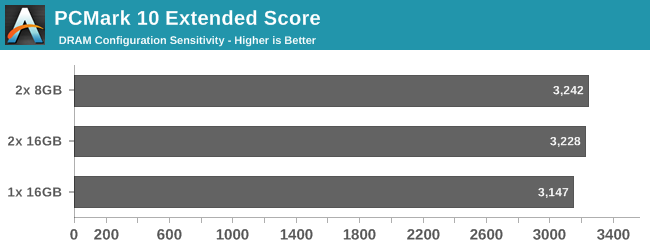
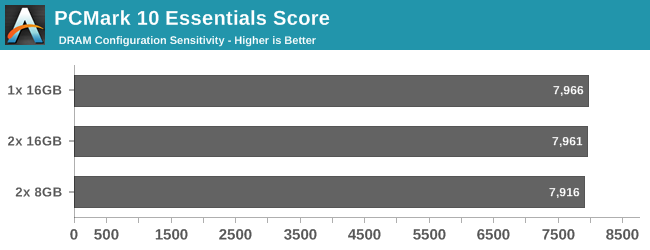
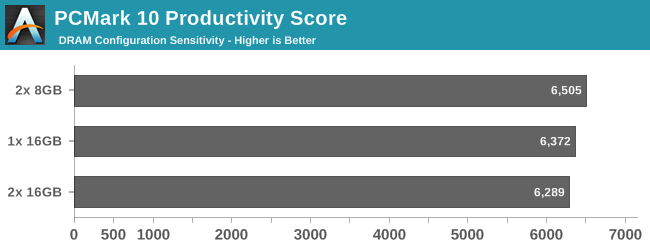
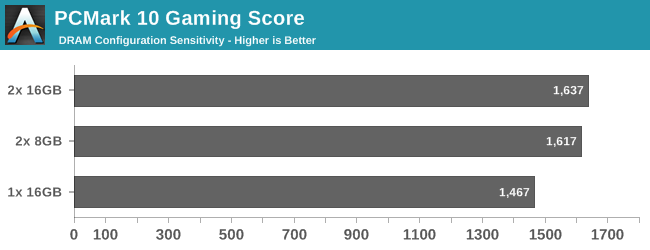
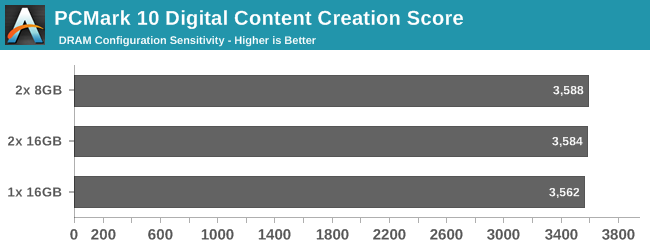
In order to test out the sensitivity of the scores to the DRAM configuration, we chose the Intel Skull Canyon NUC (NUC6i7KYK) as the test system. Our default configuration was with 2x 16GB DDR4 SODIMMs. We repeated the tests with only one slot occupied (1x 16GB) and with both slots occupied by 8GB SODIMMs 2x 8GB). The results below show that the performance (particularly for workloads utilizing the GPU) suffers a bit when one slot is unoccupied, but, there is no significant difference in the scores when moving from 16GB to 32GB of memory.
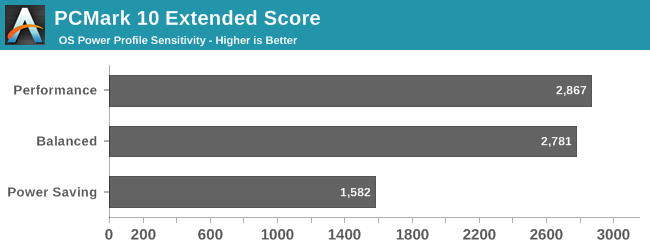
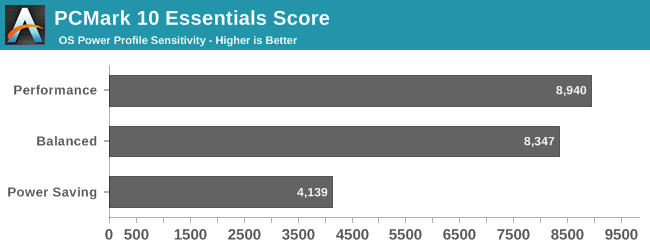
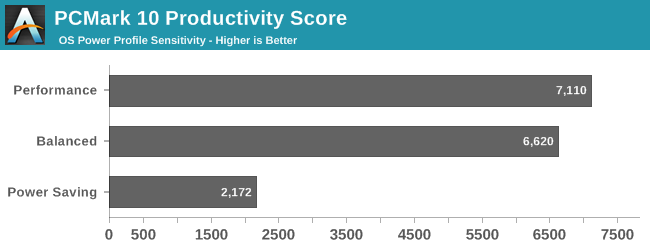
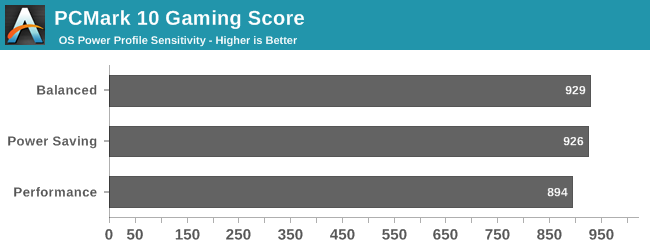
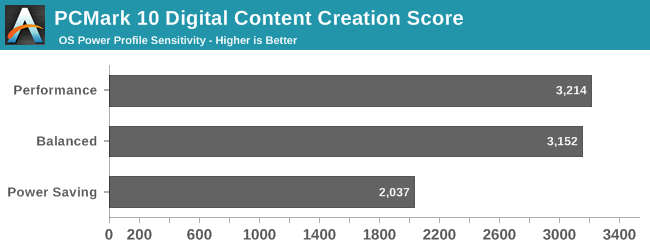
Our final sensitivity analysis test looks at how the scores vary with changes in the Windows power plan. For this purpose, we chose our desktop PC (AnandTech DAS Testbed) with the Core i5-6600K in the GIGABYTE Z170X-UD5 TH motherboard. Depending on the system, Winows provides a collection of hardware and software settings under various power profiles. Systems usually default to the balanced profile. We ran the PCMark 10 Extended benchmark with the power profile set to 'High performance' and 'Power saver' also. As the results below show, it is very important to ensure that the power profile is consistent across different systems whose scores are going to be compared.
Concluding Remarks
Futuremark's PCMark 10 is a welcome update to the tried and tested PCMark 8 benchmark. The new version solves many of the pain points that reviewers had to either bear or work-around in PCMark 8. The run-time of the benchmark has been shortened compared to the older version. The workloads are more clearly defined now. Compared to the generic 'Home', 'Creative', and 'Work' scores, we have 'Essentials', 'Productivity', 'Gaming', and 'Digital Content Creation'. Each of the low-level workloads is reported with its own score. This makes it easier to compare systems for specific tasks. Custom workloads are also available. Some of the new low-level workloads include application start-up times, and rendering and visualization. The command line is the interface of choice for professional users and reviewers, and we are happy to report that this aspect has received a much-needed overhaul in PCMark 10. Results can be exported directly in either XML or PDF format, and a lot of confusing options resulting from PCMark 8's 'OpenCL-accelerated' mode are now removed.
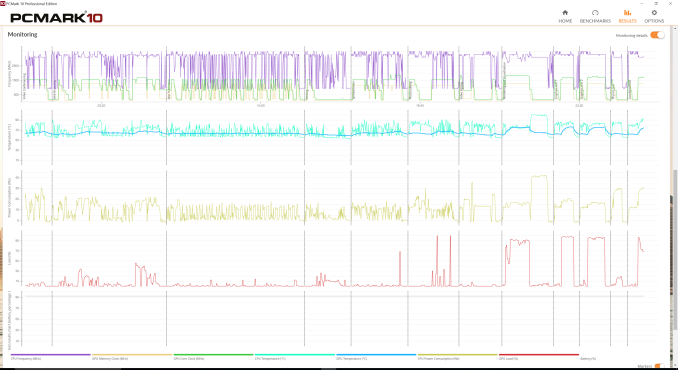
The version of PCMark 10 that we evaluated (1.0.1198) does have some scope for improvement. While VP9 and H.264 decode are part of the web browsing benchmarks, HEVC is oddly absent (given that Netflix is using HEVC right now for 4K streaming). Similar to the previous version, PCMark 10 also allows monitoring and recording of various hardware parameters (such as the CPU and GPU clock frequencies, temperature, power consumption etc.) during the processing of the benchmark. This feature is especially useful to identify whether the system throttles under normal consumer workloads. Unfortunately, the recorded information is not truly portable - it can be viewed only by loading the results in the PCMark 10 application.
Yet another aspect that needs improvement is the difference in the level of details between results exported in the XML and PDF formats. While the former includes all low-level workload scores, the PDF only breaks down the scores up to the four distinct workload sets. Another workload / score that we missed in moving from PCMark 8 to PCMark 10 is the storage segment evaluation. While the new application start-up workload does reflect the storage sub-system performance to some extent, PCMark 8's evaluation of that aspect was much more comprehensive.
Futuremark's PCMark 10 is a vendor-neutral benchmark that can help system builders in pitching the right system configuration to high-volume PC buyers (businesses and enterprises). Its main competitor in the space is BAPCo's SYSmark 2014 SE. Both of them use real-world workloads to deliver a measure of the system capabilities. Based on our experience with both benchmarks, we believe that PCMark 10 would do well to gather some aspects of BAPCo's offerings. Ensuring consistent OS settings across all benchmark runs on different systems and adding energy consumption data to get an idea of the power efficiency of the system would be nice additions. On the other hand, the ease of processing PCMark 10 is miles ahead of SYSmark 2014 SE. PCMark 10 also includes rendering and gaming workloads, which is not available in SYSmark 2014 SE. From the viewpoint of our system reviews, we believe presenting results from both benchmarks will provide readers with more insight into the performance of the system.

