Original Link: https://www.anandtech.com/show/11868/the-toshiba-tr200-3d-nand-ssd-review
The Toshiba TR200 3D NAND SSD Review: One Step Forward, One Step Back
by Billy Tallis on October 11, 2017 7:00 AM EST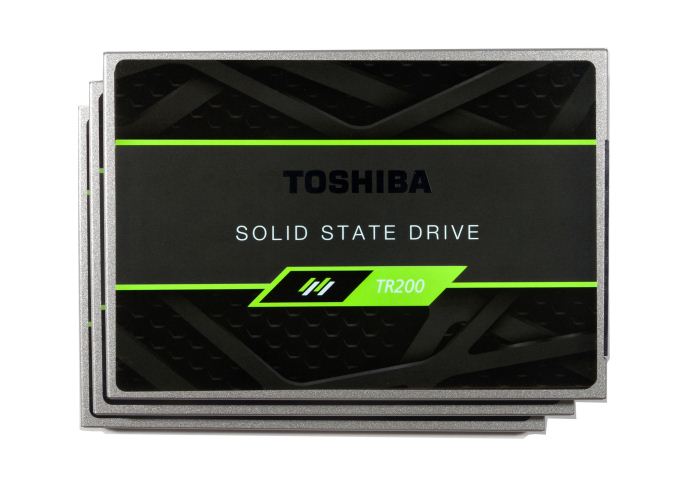
Toshiba's 3D NAND is finally coming to the retail SSD market in the new TR200 SATA SSD. After years of development, their BiCS 3D NAND technology is in its third generation and they've deemed it worth putting into mass production. Toshiba is now joining the club that Samsung founded and Intel and Micron joined last year. The many brands that use Toshiba NAND flash for their SSDs will now also be able to transition to 3D NAND from Toshiba's 15nm planar NAND.
The TR200 is the successor to the Trion 100 and Trion 150 SSDs, the latter of which was renamed TR150 earlier this year. The Trion/TR series has been Toshiba's entry-level SSD line since their acquisition of OCZ. The Trion 100 was Toshiba's first retail TLC SSD. In moving away from MLC NAND flash, the Trion 100 sacrificed performance and write endurance for the sake of affordability. The Trion 150 moved the lineup to Toshiba's 15nm TLC and delivered increased performance and lower prices. With the TR200, Toshiba is again making major changes that sacrifice performance for lower prices.
We've seen with the Toshiba XG5 OEM NVMe SSD and with Western Digital's 3D NAND SSDs that the 64-layer BiCS3 3D TLC NAND doesn't have a performance problem. What slows down the Toshiba TR200 is the switch to a DRAMless SSD controller. The Trion 100 and Trion 150 both used Phison's S10 SSD controller under Toshiba branding. The TR200 uses Phison's S11 controller, a substantially smaller and cheaper controller, but also more modern with official support for 3D NAND and LDPC error correction. Where the Phison S10 was an 8-channel controller built on a 55nm process, the S11 has a mere two channels and is fabbed on a 40nm process. The S11 controller's limitations mean we won't be seeing a 2TB model added to the TR200 family.
The direct successor to the Phison S10 will be the S12 controller, but it isn't quite ready to hit the market. Toshiba has said they plan for the TR200 to be their only retail SATA SSD to use the 64L BiCS3 3D TLC, so we don't expect an S12-based drive from Toshiba to show up anytime soon. Instead, it appears that Toshiba and their somewhat estranged manufacturing partner SanDisk will be going after different ends of the SATA SSD market.
Officially, Toshiba doesn't tell us much about the specific chips in their SSDs. They never officially confirmed that the earlier Trion series SSDs were using the Phison S10 controller despite an identical PCB layout to competing Phison drives, and they haven't confirmed that the Phison S11 is what's hiding under the Toshiba markings in the TR200, but the firmware version numbering matches other S11 drives. The secrecy also applies somewhat to the NAND configuration. Officially, both their 256Gb die and 512Gb die are used in the TR200 series. Unofficially, Toshiba seems to have done little to change their part numbering scheme over the past decade, so it looks like the 960GB TR200 is the only one using the 512Gb parts. This means that the 960GB model doesn't have much potential for a performance advantage over the 480GB model, because both have a total of 16 NAND flash dies spread across the controller's two channels.
| Toshiba TR200 Specifications | |||||
| Capacity | 240GB | 480GB | 960GB | ||
| Controller | Toshiba TC58NC1010 (Phison S11) | ||||
| NAND | Toshiba 256Gb 64L BiCS3 3D TLC | Toshiba 512Gb 64L BiCS3 3D TLC | |||
| DRAM | None | ||||
| Sequential Read | 555 MB/s | 555 MB/s | 555 MB/s | ||
| Sequential Write | 540 MB/s | 540 MB/s | 540 MB/s | ||
| 4KB Random Read | 79k IOPS | 82k IOPS | 81k IOPS | ||
| 4KB Random Write | 87k IOPS | 88k IOPS | 88k IOPS | ||
| Write Endurance | 60 TB | 120 TB | 240 TB | ||
| Encryption | None | ||||
| Warranty | Three Years | ||||
| MSRP | $89.99 | $149.99 | $289.99 | ||
The construction of the Toshiba TR200 is very similar to other recent Phison SSDs, but the labeling is very different from the Trion 100 and 150. Toshiba has been phasing out the use of the OCZ brand, and the TR200 drops all use of the name from the drive itself, though OCZ is still mentioned on the box. The drive does still have an OCZ logo, though the color scheme has switched from blue and white to green and black.
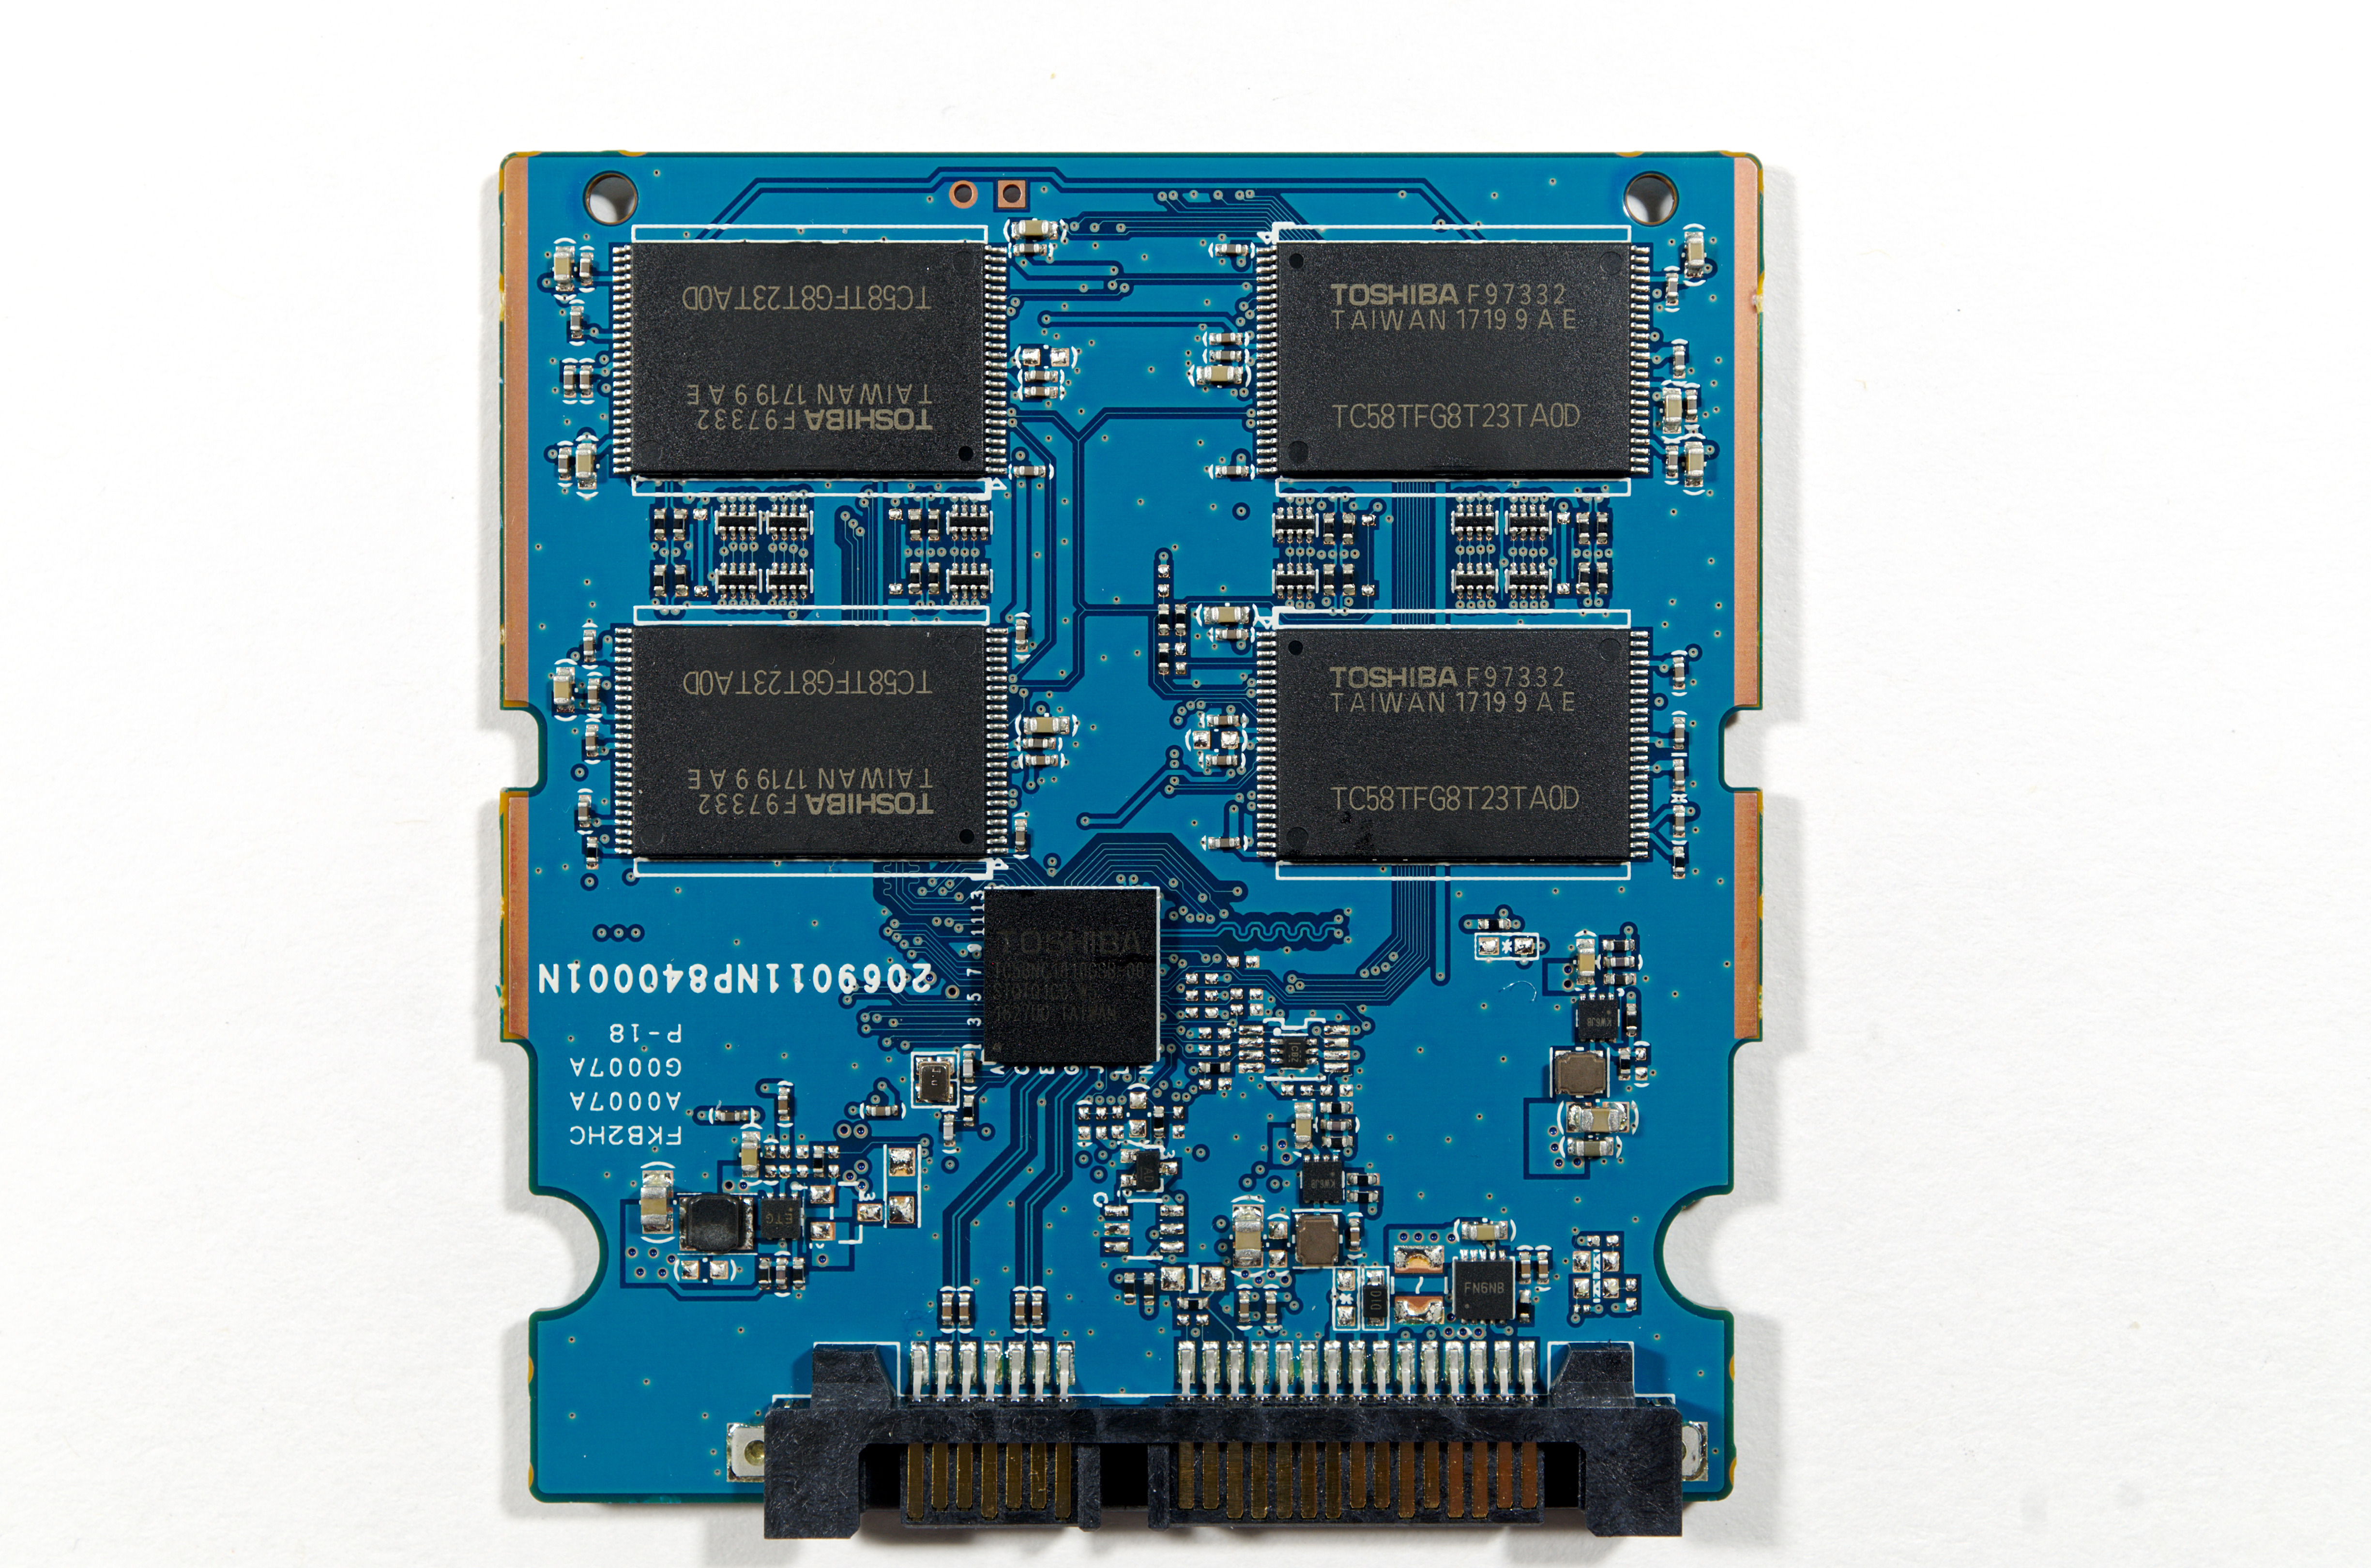
As can be expected from a DRAMless SSD, the PCB inside doesn't take up much space, even with Toshiba using just one or two NAND dies per package. There are four packages on each side of the PCB, each of which dwarfs the controller package and all the smaller components.


The MSRPs for the TR200 aren't groundbreaking and are in fact much higher than what the Trion 150 was going for when it was new, but that's due to the NAND flash shortage that has driven prices up over the past year. When the Trion 150 launched, the best deals were around 20 ¢/GB. Now, 27 cents/GB is hard to beat, and the MSRPs for the TR200 start at 30 ¢/GB. With the Trion 100 and Trion 150, Toshiba kept prices fairly competitive, though usually not quite the lowest on the market. They'll probably do the same with the TR200, and may be a bit more aggressive given the cheaper DRAMless design.
Now that Toshiba's 3D NAND is showing up in volume, the situation should improve. Intel/Micron and Samsung are also ramping up production of their respective 64L 3D NAND, and SK Hynix might return to relevance if their 72-layer 3D NAND ends up affordable and readily available. There's no definite timeline for prices getting back to their 2015/2016 lows, but the price increases are probably pretty much over now.
As a DRAMless SSD, the TR200 doesn't quite fit in the same market segment as most of the entry-level SSDs from Toshiba's competitors. DRAMless SSDs haven't been very popular with the major SSD brands of the North American and European markets, because they have historically not offered enough of a discount to offset the performance hit. Nonetheless, the Toshiba TR200 will be in close competition with drives using larger controllers with DRAM. The Crucial MX300 and ADATA SU800 are two examples, based on Micron's 32L 3D NAND and controllers from Marvell and Silicon Motion. Samsung's 850 EVO has long overshadowed a sizable chunk of the SATA SSD market with performance close to the limits of SATA, and lately it has been priced very aggressively.
For comparison with other DRAMless SSDs, we have few options. The only DRAMless TLC SSD we've tested lately is the HP S700, based on the Silicon Motion SM2258XT controller and Micron's 32L 3D TLC. We also have the Toshiba OCZ VX500 with 15nm MLC NAND, which uses a small external DRAM cache on the 1TB model but none on the smaller capacities. Maxiotek (formerly JMicron) has their MK8115 DRAMless controller, which has been adopted with Micron 3D TLC for the ADATA Ultimate SU700, but we haven't tested that product. We previewed that controller earlier this year with engineering samples from Maxiotek, but those results are from our old 2015 test suite instead of the current 2017 suite.
| AnandTech 2017 SSD Testbed | |
| CPU | Intel Xeon E3 1240 v5 |
| Motherboard | ASRock Fatal1ty E3V5 Performance Gaming/OC |
| Chipset | Intel C232 |
| Memory | 4x 8GB G.SKILL Ripjaws DDR4-2400 CL15 |
| Graphics | AMD Radeon HD 5450, 1920x1200@60Hz |
| Software | Windows 10 x64, version 1703 |
| Linux kernel version 4.12, fio version 2.21 | |
- Thanks to Intel for the Xeon E3 1240 v5 CPU
- Thanks to ASRock for the E3V5 Performance Gaming/OC
- Thanks to G.SKILL for the Ripjaws DDR4-2400 RAM
- Thanks to Corsair for the RM750 power supply, Carbide 200R case, and Hydro H60 CPU cooler
AnandTech Storage Bench - The Destroyer
The Destroyer is an extremely long test replicating the access patterns of very IO-intensive desktop usage. A detailed breakdown can be found in this article. Like real-world usage, the drives do get the occasional break that allows for some background garbage collection and flushing caches, but those idle times are limited to 25ms so that it doesn't take all week to run the test. These AnandTech Storage Bench (ATSB) tests do not involve running the actual applications that generated the workloads, so the scores are relatively insensitive to changes in CPU performance and RAM from our new testbed, but the jump to a newer version of Windows and the newer storage drivers can have an impact.
We quantify performance on this test by reporting the drive's average data throughput, the average latency of the I/O operations, and the total energy used by the drive over the course of the test.
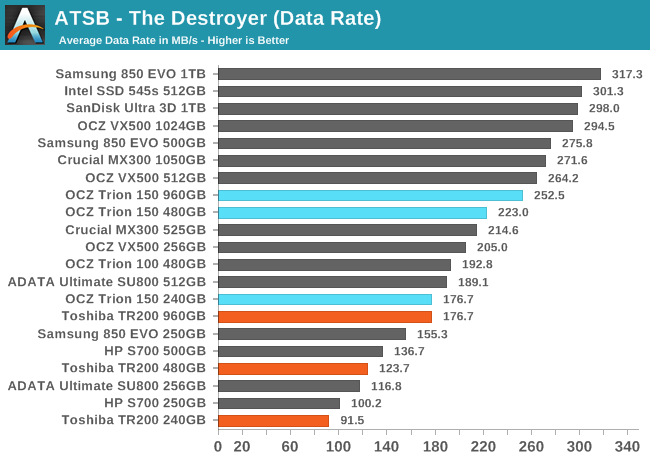
The Toshiba TR200 starts off in last place. At every capacity, the TR200's average data rate on The Destroyer is slower than the competition, including the HP S700, the only other DRAMless TLC SSD we've tested recently. The largest and fastest TR200 is as slow as the smallest model of its predecessor TR150.
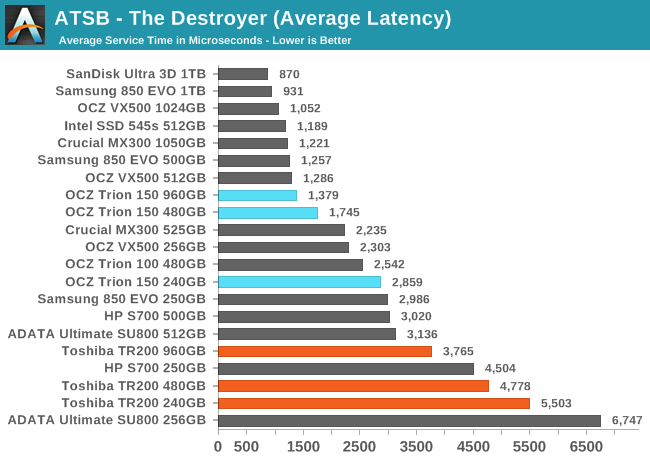
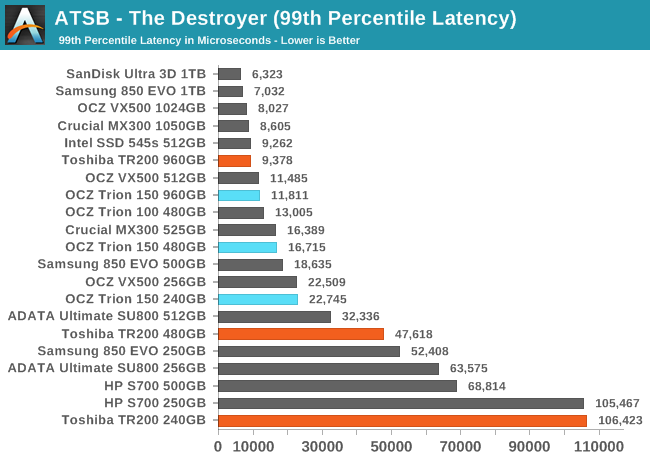
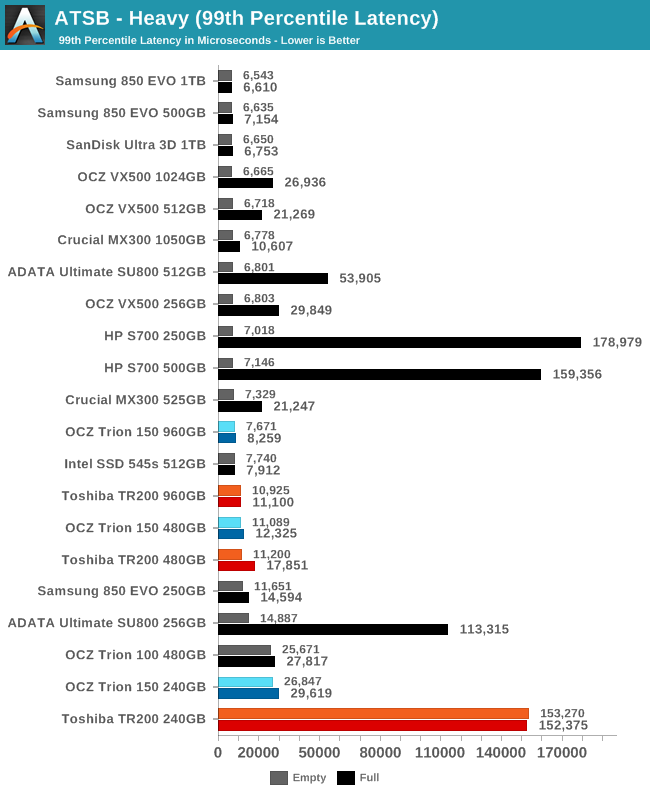
The average latency from the TR200s is high for all three capacities, but only the larger two capacities are showing record high latencies for their size class. The 99th percentile latencies aren't quite as bad, especially with the larger capacities: the 960GB TR200 does a good job of keeping latency under control, the 480GB falls roughly in between the HP S700 and the rest of its competition, and the 240GB TR200 is tied with the HP S700 for last place.
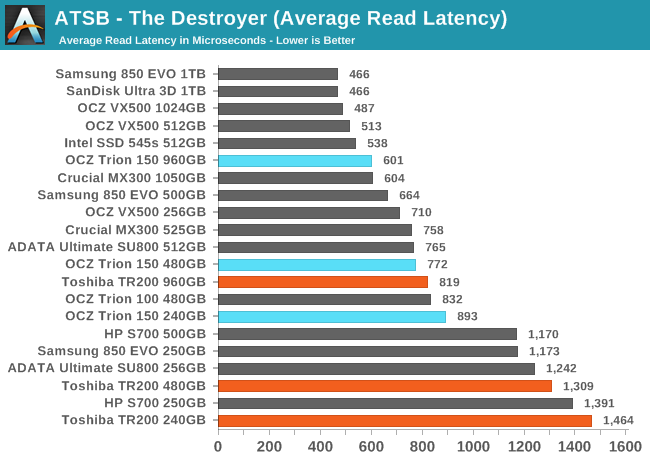
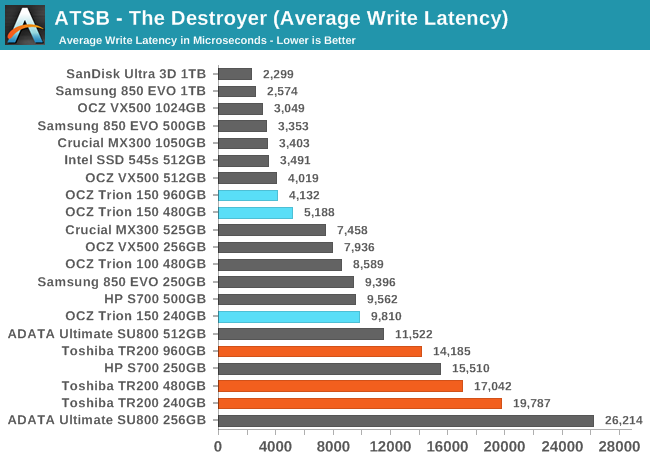
Average read and write latencies are both high for the TR200, and much higher than with the predecessor TR150. It's unusual to see this much latency in the larger capacities, but the 240GB TR200 isn't an egregious outlier on these metrics.
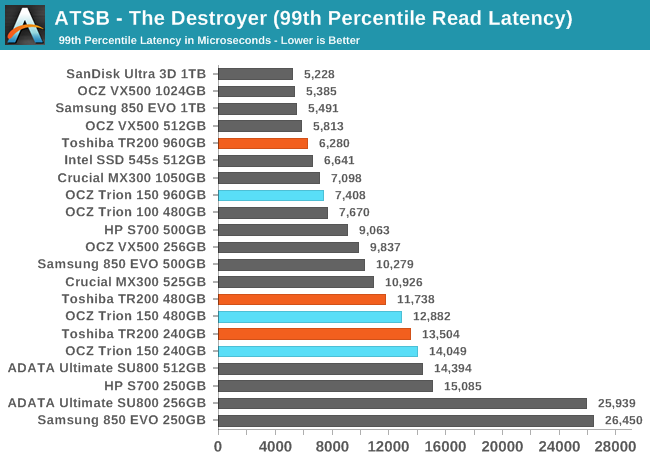
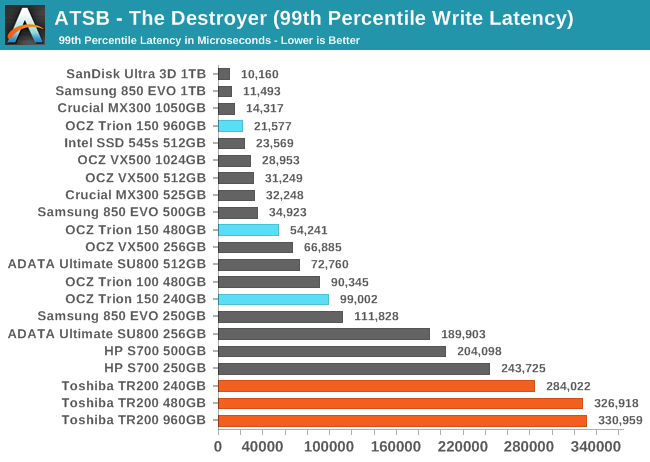
The 99th percentile read latency of the TR200 is a small but clear improvement over the TR150, and the 960GB TR200 scores pretty well overall. On write operations, all capacities of the TR200 have poor QoS, with 99th percentile write latencies between a quarter and a third of a second. It's clear that the TR200 (and to a lesser extent the HP S700) suffer quite a bit from the lack of DRAM when the drive needs to perform garbage collection in parallel with handling new write operations.
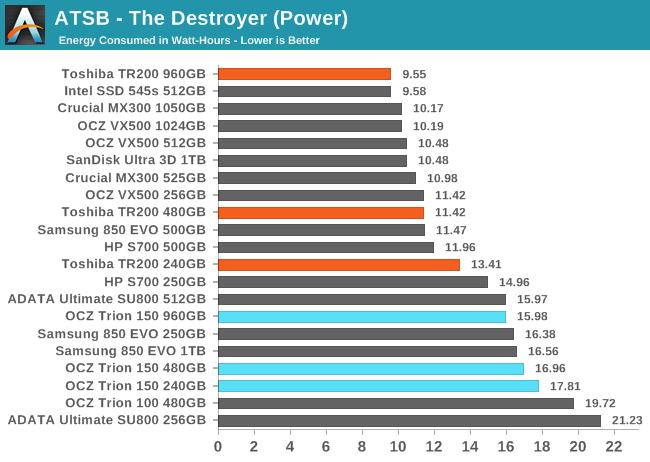
Despite quite poor performance, the Toshiba TR200 returns decent energy usage results. The 960GB TR200 just barely sets a new record for lowest energy usage on The Destroyer, despite taking significantly longer to complete the test than its competition. Even the 240GB TR200 was much more efficient overall than all previous Trion/TR series drives, and used a third less energy than the 256GB ADATA SU800 (which was 27% faster).
AnandTech Storage Bench - Heavy
Our Heavy storage benchmark is proportionally more write-heavy than The Destroyer, but much shorter overall. The total writes in the Heavy test aren't enough to fill the drive, so performance never drops down to steady state. This test is far more representative of a power user's day to day usage, and is heavily influenced by the drive's peak performance. The Heavy workload test details can be found here. This test is run twice, once on a freshly erased drive and once after filling the drive with sequential writes.
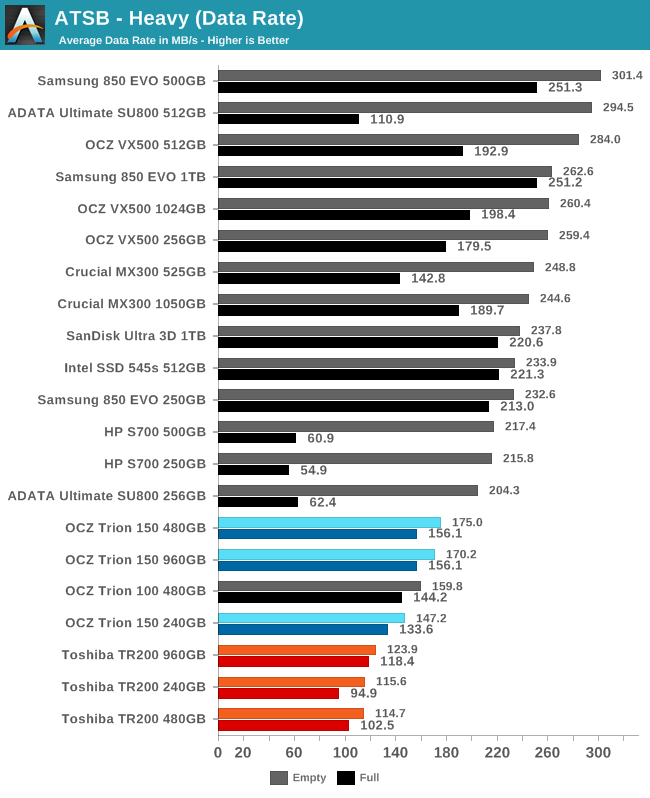
All three capacities of the Toshiba TR200 are at the bottom of the chart for average data rate on the Heavy test, falling just below their predecessors. However, the TR200 is somewhat redeemed by retaining a lot of its performance even when full. In that case, the TR200 compares favorably against the HP S700 (the other DRAMless TLC SSD on the graph), and against the smaller capacities of the ADATA SU800.
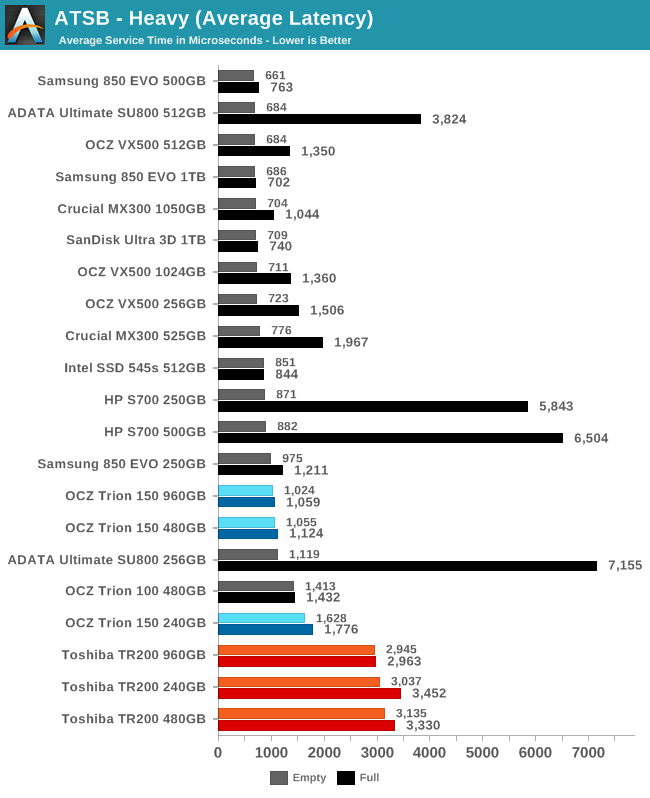
The average latency of the TR200 on the Heavy test is quite high for all capacities and whether the test is run on a full or empty drive. However, several other drives fare much worse when full.
When considering the 99th percentile latency, the 240GB TR200 stands out as having very poor QoS whether or not it is filled before running the Heavy test. The larger two models of the TR200 have rather high 99th percentile latencies, but don't fall too far outside the normal range. HP's S700 performs slightly worse when full, but even the 250GB model has decent control over latency when the test is run on an empty drive.
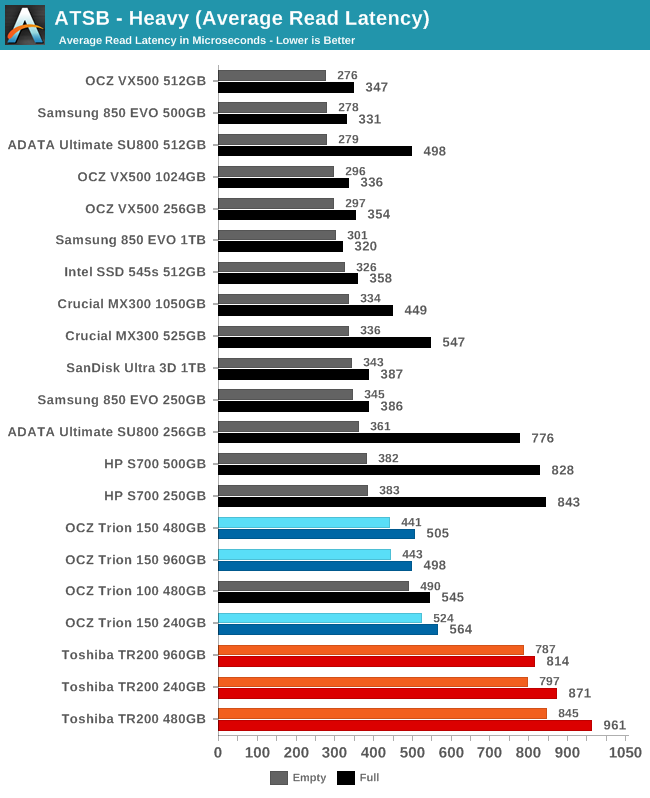
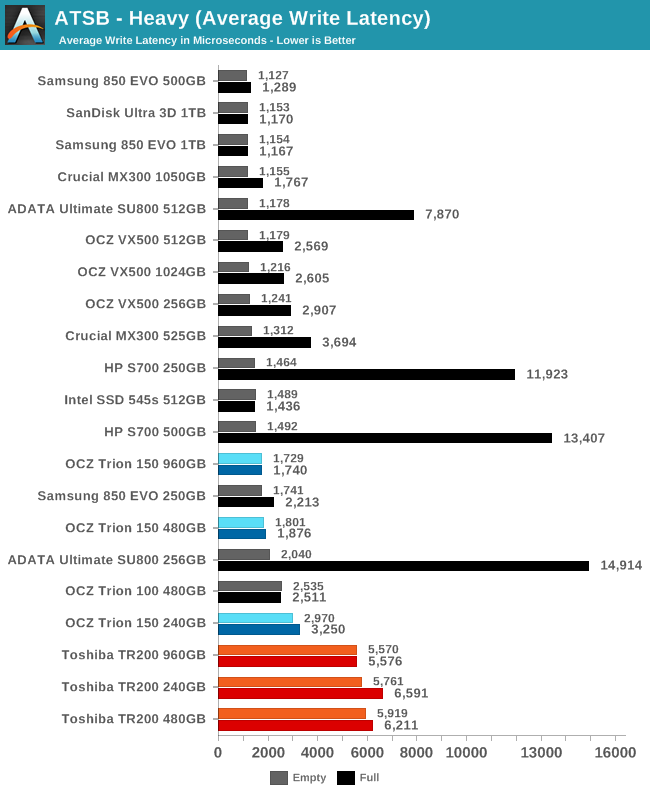
The average read and write latencies for the TR200 on the Heavy test stand out from the crowd. They're all slow, whether or not the drive is filled before running the test. There's not much variation between capacities and for both reads and writes the latencies are at least twice as high as most of the current competition. For reads, the TR200 is even worse than the ADATA SU800 and HP S700 at their worst, while for writes those drives have far higher latencies when full than the TR200.
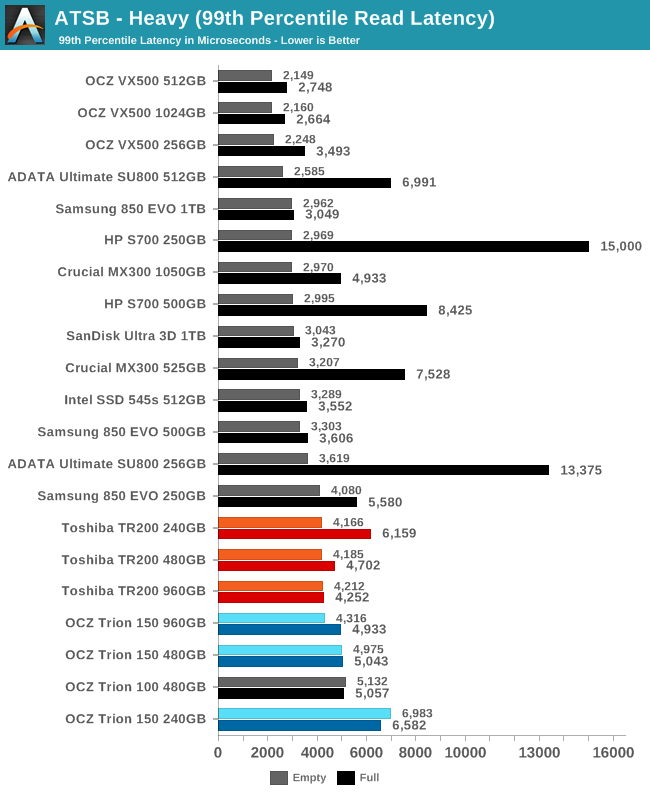
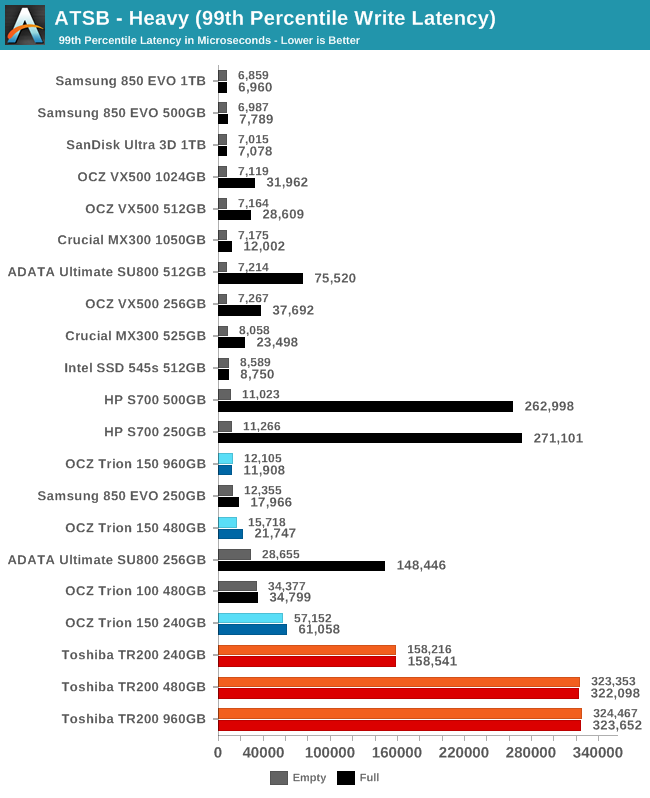
The 99th percentile read latencies of the TR200 are on the high side, but are not even twice as high as the best MLC drives, when the test is run on an empty drive. The smaller TR200s do a bit worse when the drive starts out full, but so do many other budget SSDs, and the 960GB model is barely affected. On the write side of things, there's no contest. The 99th percentile write latencies of the 480GB and 960GB TR200 are almost a third of a second. The 240GB model's 99th percentile latency is half as bad, but it's still unprecedented among recent models to see latency that bad even when the test is run on an empty drive.
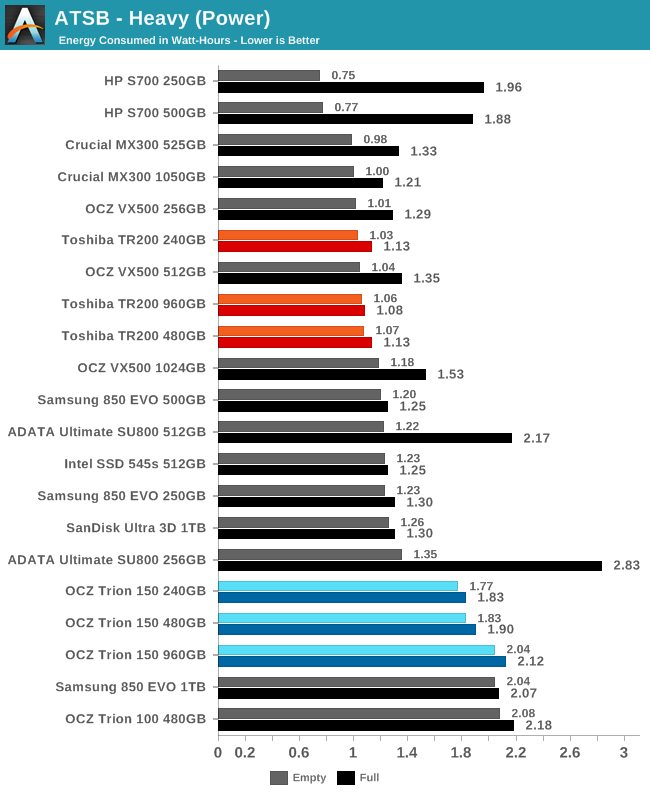
When the Heavy test is run on an empty drive, the TR200 doesn't break any energy efficiency records, but it is competitive with some of the most efficient drives. When the drives are full, the TR200 takes the lead, thanks to the relatively small performance drop they show in that scenario. The TR200 has managed to cut energy use almost in half compared to its predecessors.
AnandTech Storage Bench - Light
Our Light storage test has relatively more sequential accesses and lower queue depths than The Destroyer or the Heavy test, and it's by far the shortest test overall. It's based largely on applications that aren't highly dependent on storage performance, so this is a test more of application launch times and file load times. This test can be seen as the sum of all the little delays in daily usage, but with the idle times trimmed to 25ms it takes less than half an hour to run. Details of the Light test can be found here. As with the ATSB Heavy test, this test is run with the drive both freshly erased and empty, and after filling the drive with sequential writes.
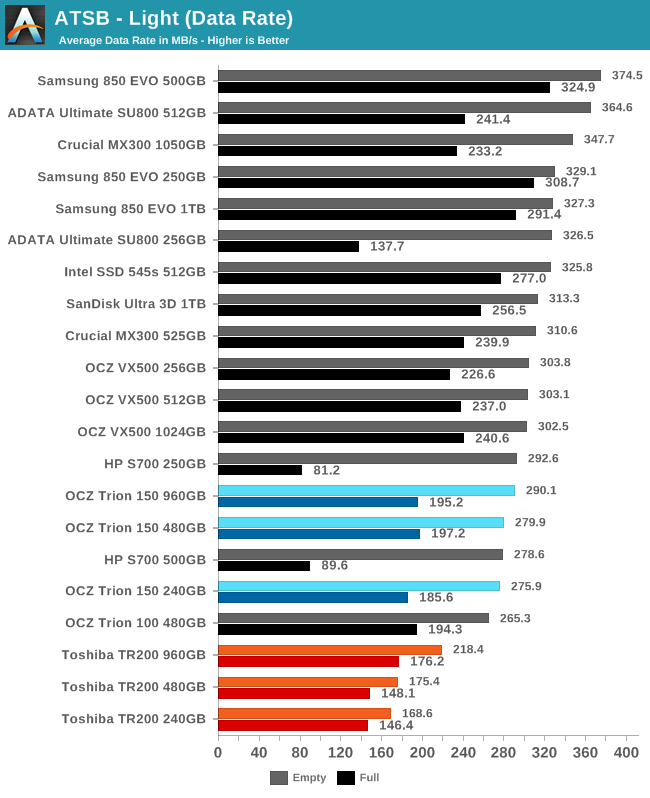
The short duration and low write volume of our Light test don't help the Toshiba TR200 look any better than it did on the harder ATSB tests. The average data rates from the TR200s when the test is run on an empty drive are slower than most other SSDs when completely full. The HP S700 still does worse when full, as does the 256GB ADATA SU800. The Samsung 850 EVO is about twice as fast overall on the Light test.
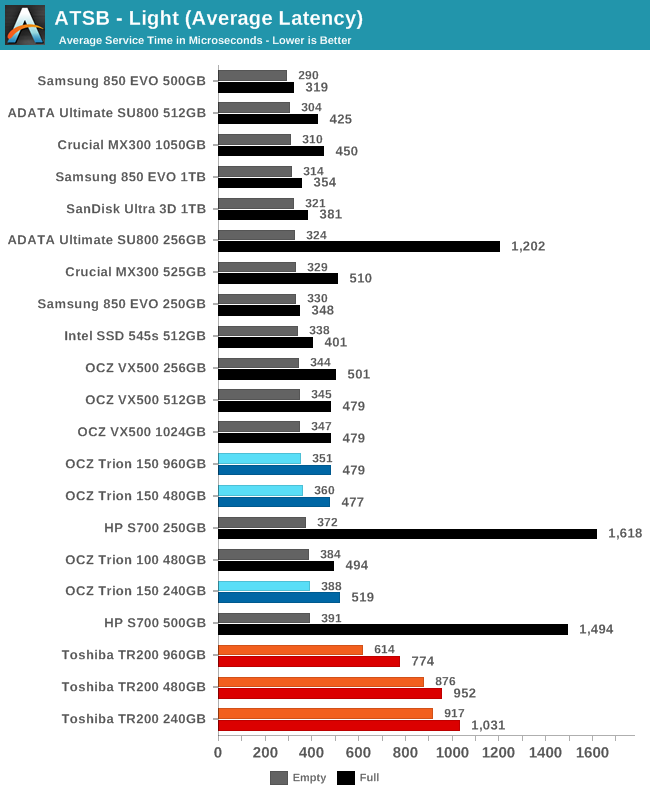
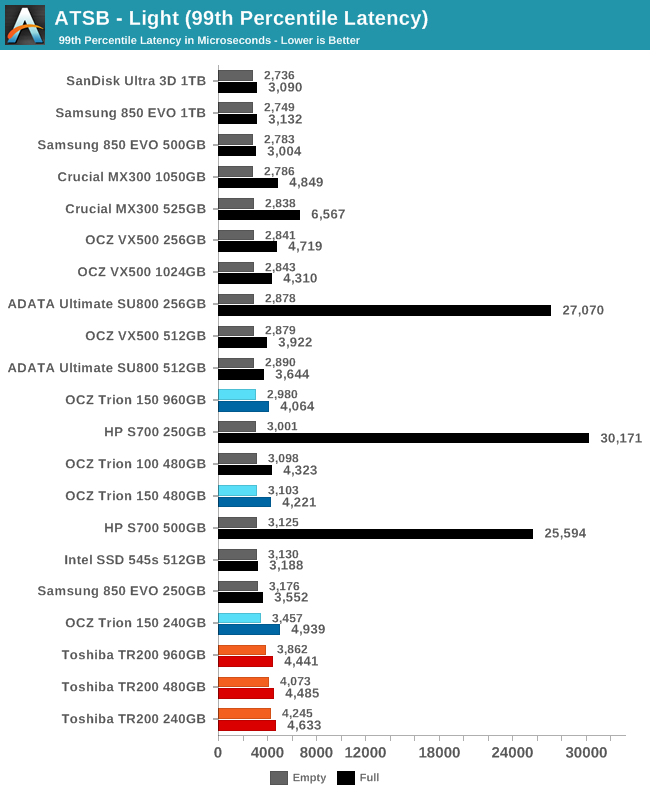
The average latency of the TR200s on the Light test falls well outside the normally narrow range. A few other drives have exceptionally high latency when the test is run on a full drive, but otherwise nothing comes close to the TR200. By contrast, the 99th percentile latency of the TR200 is only modestly worse than other low-end drives, and the TR200 doesn't get massively worse when it is full.
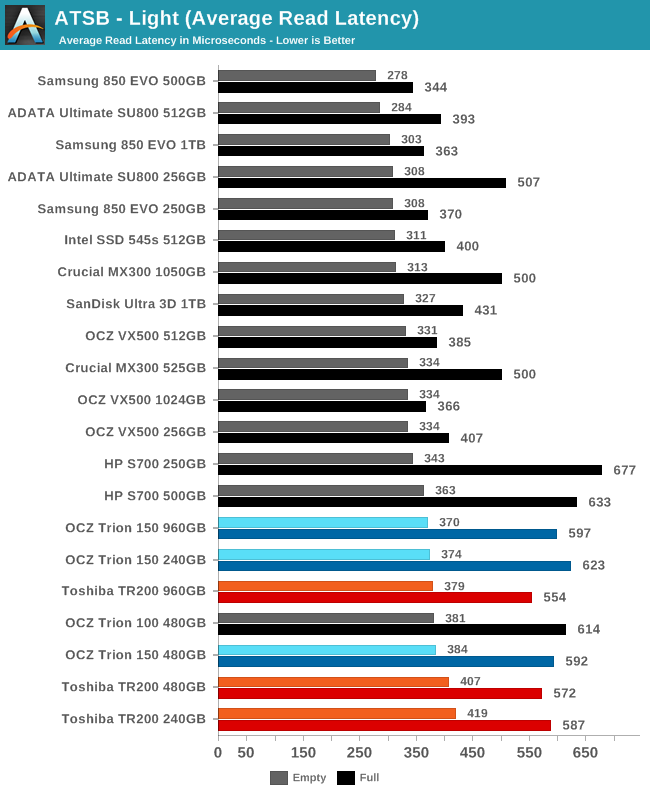
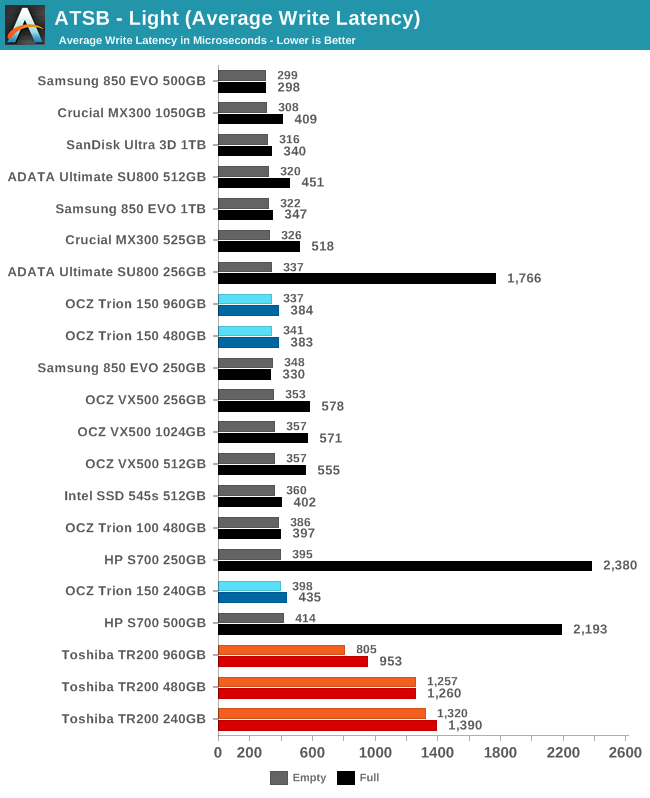
The TR200 has some of the highest average read latency scores on the Light test, but it's not a serious outlier at any capacity. The average write latency is where the TR200's problems lie, as even the fastest 960GB model has twice the write latency of the next slowest drive.
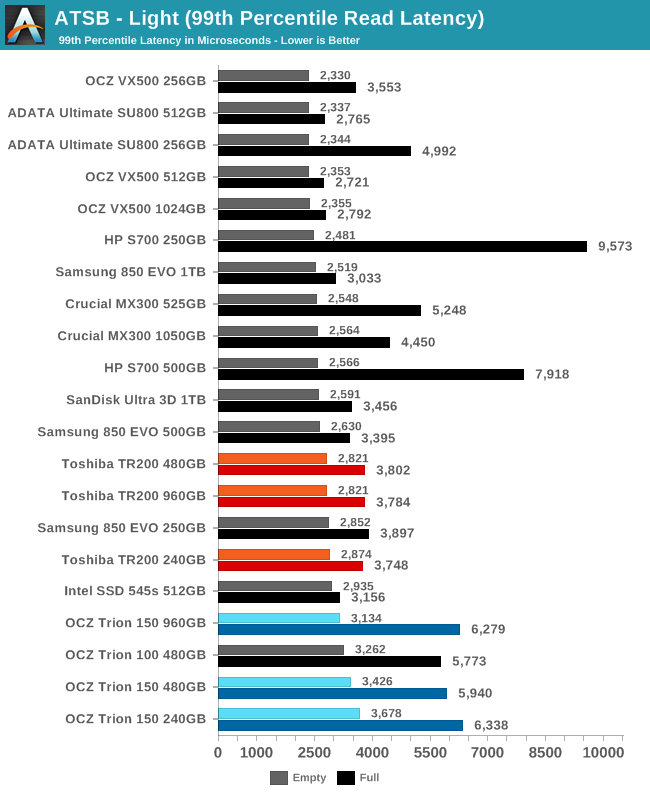
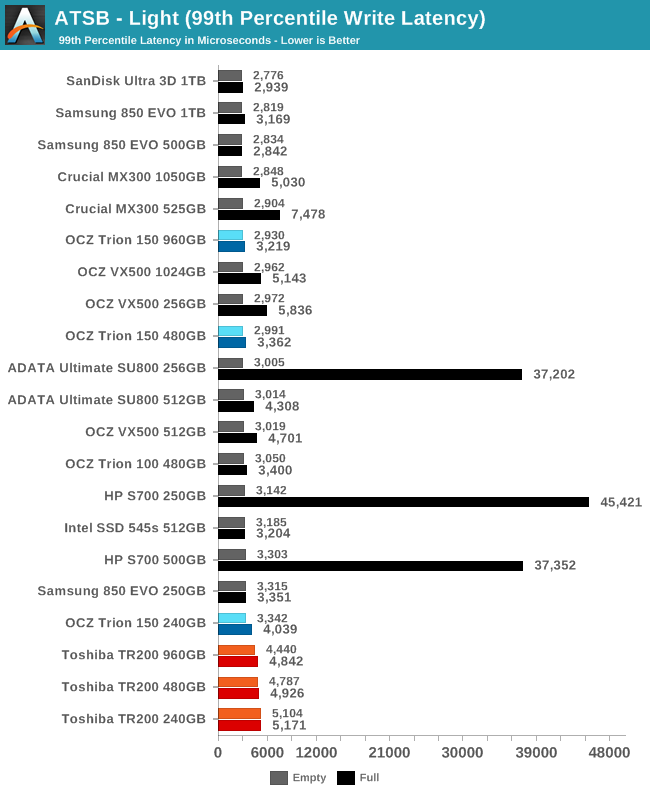
The 99th percentile read latency scores of the TR200 are a modest improvement over its predecessors, and in line with contemporary competitors. The 99th percentile write latency is worse than the TR150 but not high enough to be a problem on this light workload.
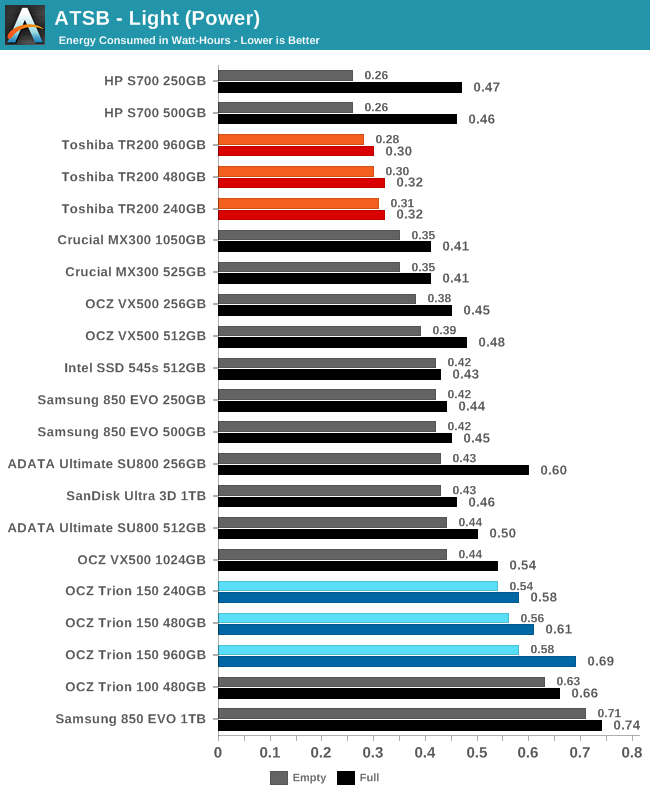
The DRAMless SSDs are again the most energy-efficient despite their lower overall performance. The TR200 loses to the HP S700 when the test is run on an empty drive, but the TR200 takes a clear lead when the drives are full, using less than three quarters the energy of the next most efficient SATA drive.
Random Read Performance
Our first test of random read performance uses very short bursts of operations issued one at a time with no queuing. The drives are given enough idle time between bursts to yield an overall duty cycle of 20%, so thermal throttling is impossible. Each burst consists of a total of 32MB of 4kB random reads, from a 16GB span of the disk. The total data read is 1GB.
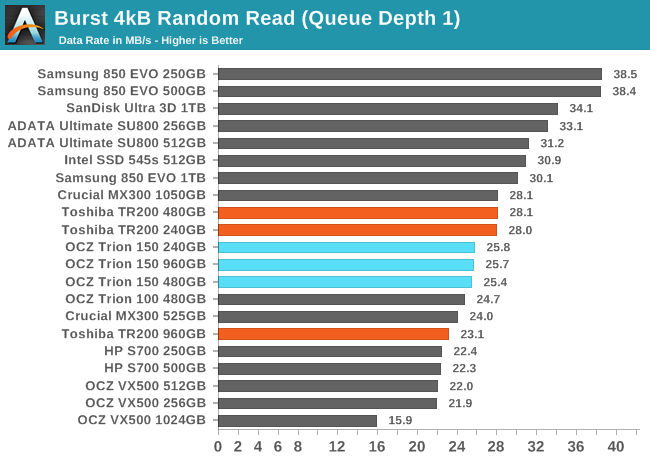
The QD1 burst random read speeds of the Toshiba TR200 are mostly normal for a budget SSD, though the 960GB model is notably slower than the smaller capacities that are using the 256Gb NAND dies instead of the 512Gb dies.
Our sustained random read performance is similar to the random read test from our 2015 test suite: queue depths from 1 to 32 are tested, and the average performance and power efficiency across QD1, QD2 and QD4 are reported as the primary scores. Each queue depth is tested for one minute or 32GB of data transferred, whichever is shorter. After each queue depth is tested, the drive is given up to one minute to cool off so that the higher queue depths are unlikely to be affected by accumulated heat build-up. The individual read operations are again 4kB, and cover a 64GB span of the drive.
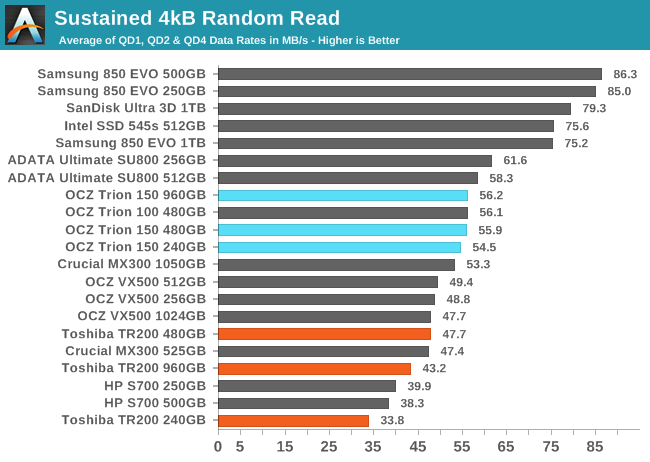
On the longer test that includes higher queue depths, the Toshiba TR200 falls to near the bottom of the chart. The 240GB and 960GB models are substantially slower than anything else we've tested of similar capacity. On the other hand, the 480GB TR200 is tied with the 525GB Crucial MX300, and the trend suggests that the 275GB Crucial MX300 would score a bit worse.
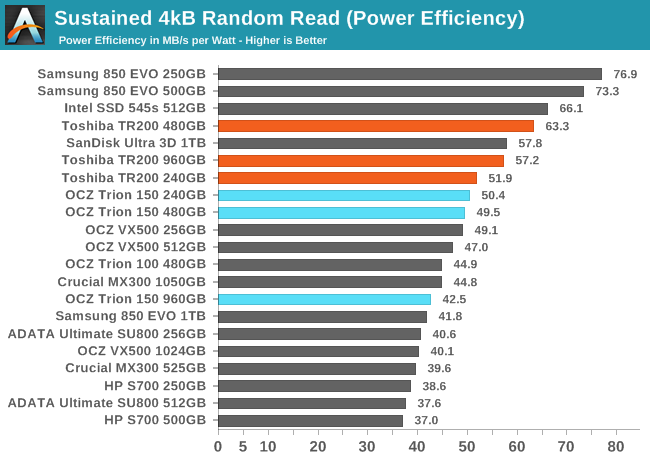
The power efficiency of the Toshiba TR200 during random reads is good, and a clear improvement over the TR150. Notably, the 960GB TR200 scores about the same as the SanDisk Ultra 3D 1TB, showing that the latter's higher performance is in proportion to the power cost of its DRAM.
 |
|||||||||
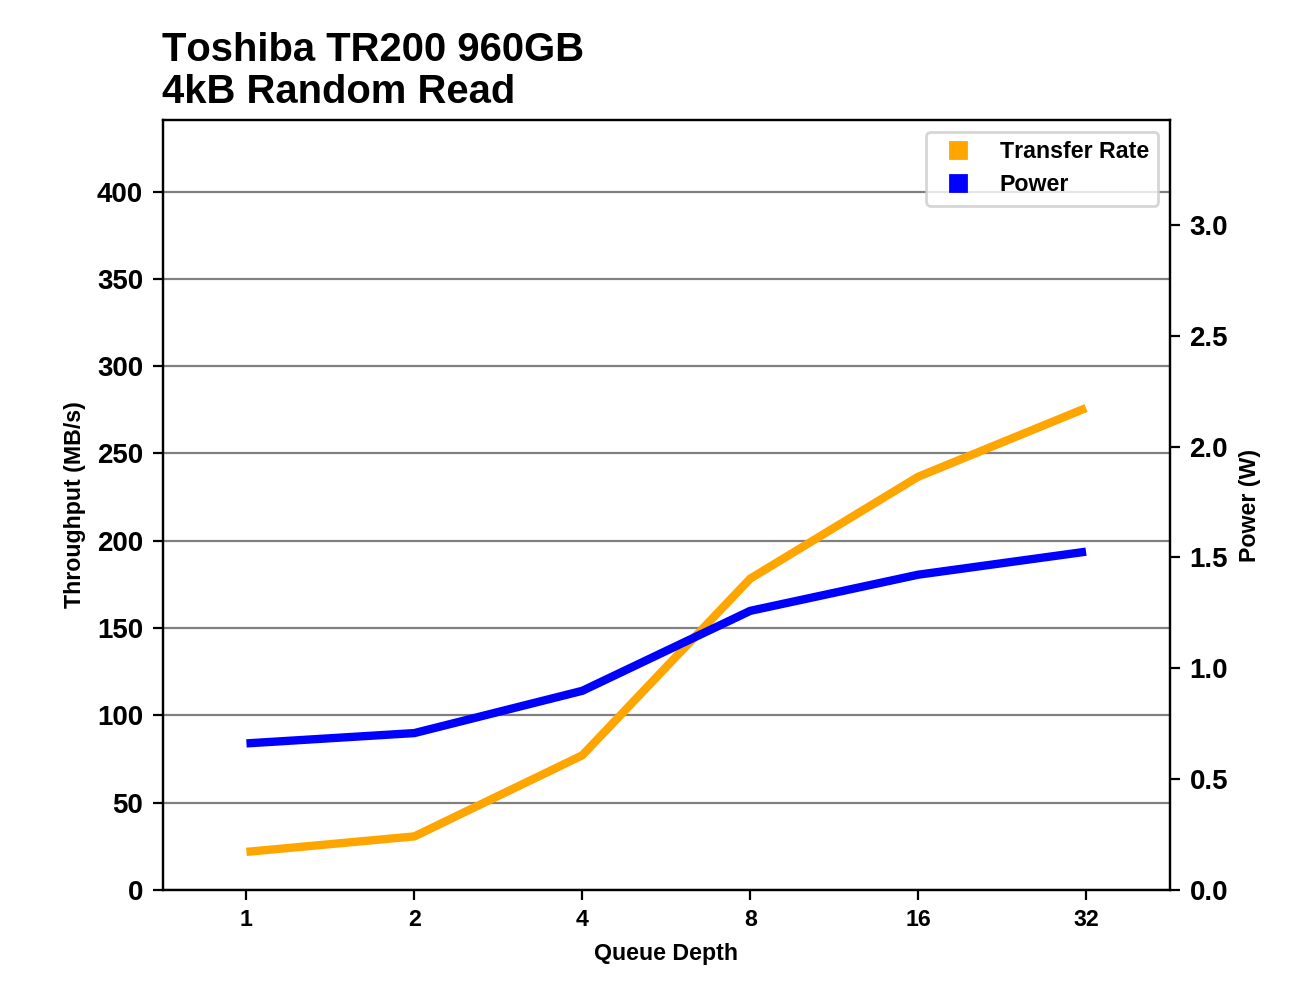
The TR200s all show very little random read performance increase from QD1 to QD2, and this is most of why their performance scores above are so low. Through the mid range of queue depths, the TR200 shows better scaling than many other budget SSDs, but at the high end the performance increases taper off. The 960GB model never provides substantially higher performance than the 480GB model, as both have the same number of NAND dies.
Random Write Performance
Our test of random write burst performance is structured similarly to the random read burst test, but each burst is only 4MB and the total test length is 128MB. The 4kB random write operations are distributed over a 16GB span of the drive, and the operations are issued one at a time with no queuing.
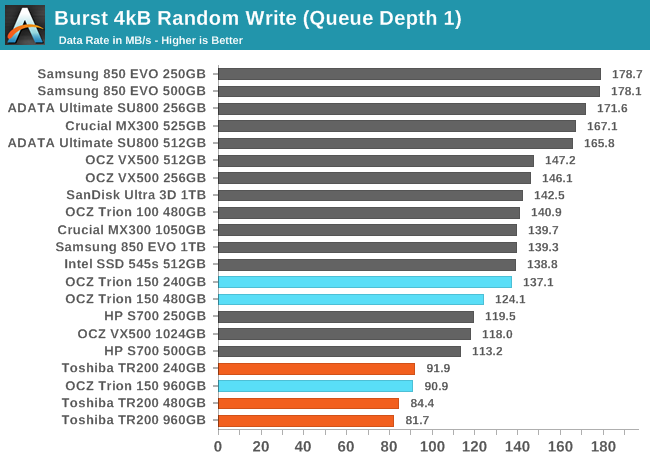
The Toshiba TR200s are the slowest drives for short bursts of random writes at QD1. The larger drives are slower, a pattern that the TR150 and several other models exhibit.
As with the sustained random read test, our sustained 4kB random write test runs for up to one minute or 32GB per queue depth, covering a 64GB span of the drive and giving the drive up to 1 minute of idle time between queue depths to allow for write caches to be flushed and for the drive to cool down.
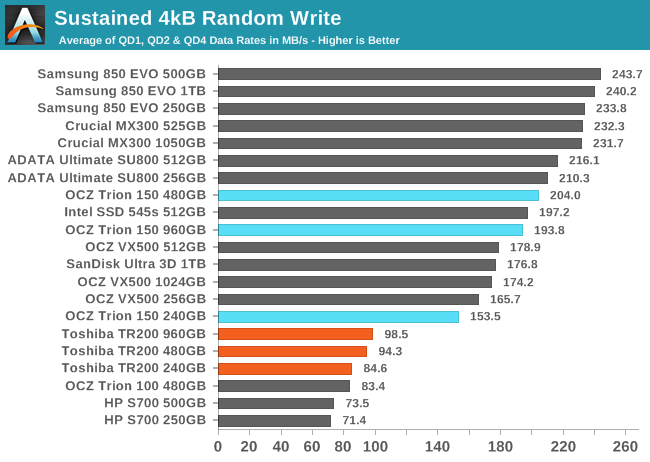
On the longer test of random writes involving some higher queue depths, the gap between the TR200 and a typical mainstream SATA SSD widens to a factor of two or more, but the TR200 also ends up ahead of the HP S700 and the original Trion 100.
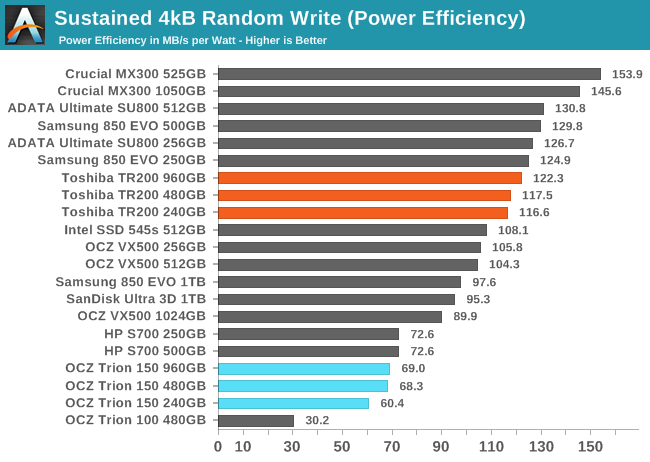
In spite of the poor sustained random write performance, the Toshiba TR200 shows above average power efficiency. This is a huge change relative to previous Trion/TR series drives, which were the least efficient drives on this test. The HP S700 also showed very poor efficiency during random writes.
 |
|||||||||
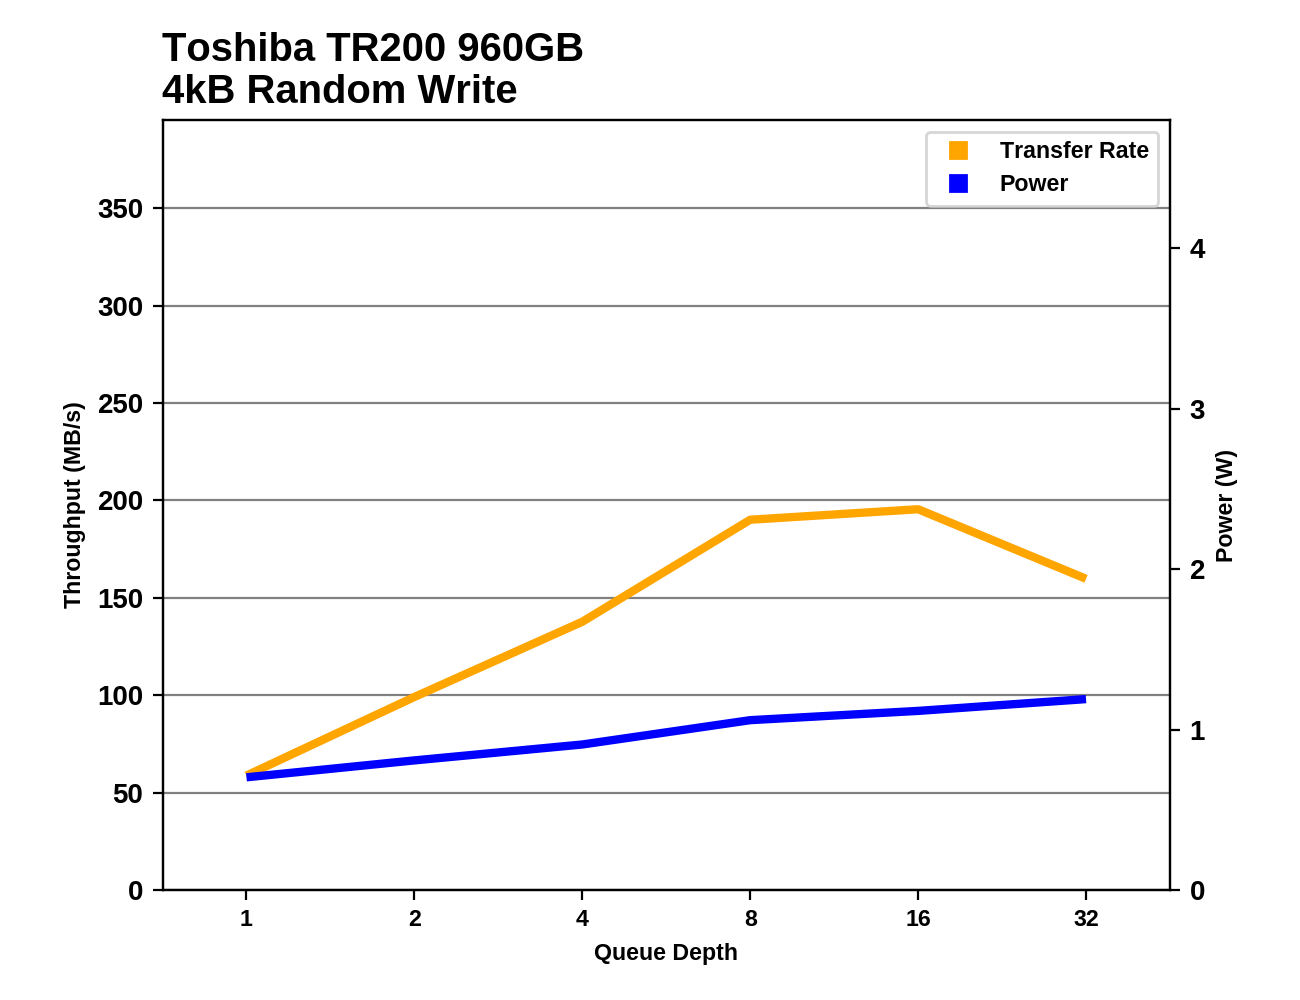
The 960GB TR200 shows steady performance scaling as queue depths increase, but by the end of the test its SLC cache has filled up and performance begins to drop. The smaller TR200s also saturate by around QD8 and hold steady at very low performance levels. Power also stays low even at higher QDs, with the 240GB model never exceeding 1W.
Sequential Read Performance
Our first test of sequential read performance uses short bursts of 128MB, issued as 128kB operations with no queuing. The test averages performance across eight bursts for a total of 1GB of data transferred from a drive containing 16GB of data. Between each burst the drive is given enough idle time to keep the overall duty cycle at 20%.
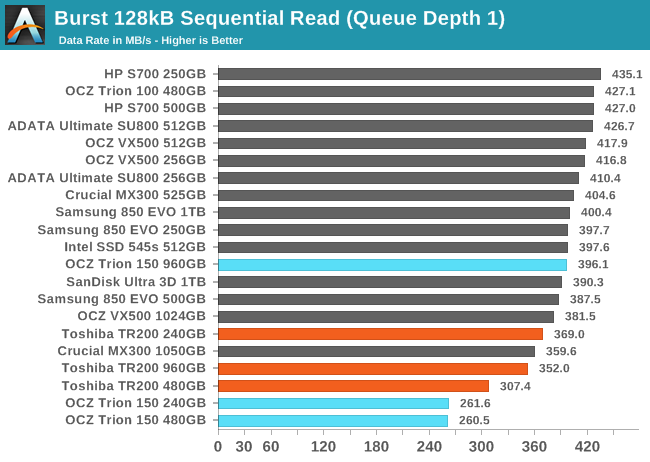
The burst sequential read performance of the TR200s is a significant improvement over the TR150 for the 240GB and 480GB models, but is a regression for the 960GB model. All of the TR200s are at the slow end of the chart, with the 480GB model lagging furthest behind its competitors.
Our test of sustained sequential reads uses queue depths from 1 to 32, with the performance and power scores computed as the average of QD1, QD2 and QD4. Each queue depth is tested for up to one minute or 32GB transferred, from a drive containing 64GB of data.
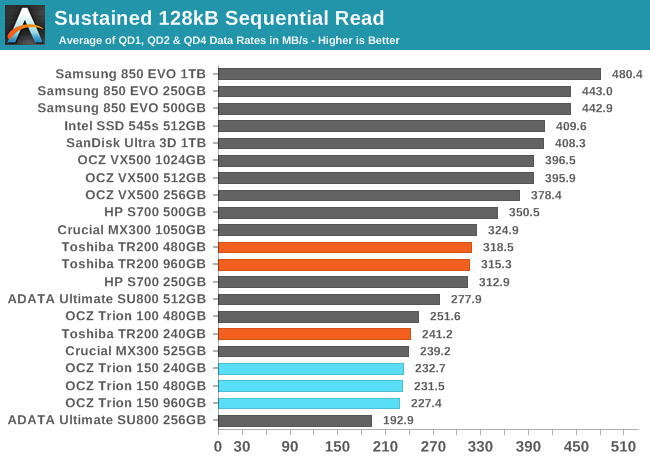
On the longer test of sequential reads, the larger two models of the TR200 perform quite similarly and are about average for a budget SSD. The 240GB is substantially slower, but still faster than all of the TR150 capacities and the 256GB ADATA SU800.
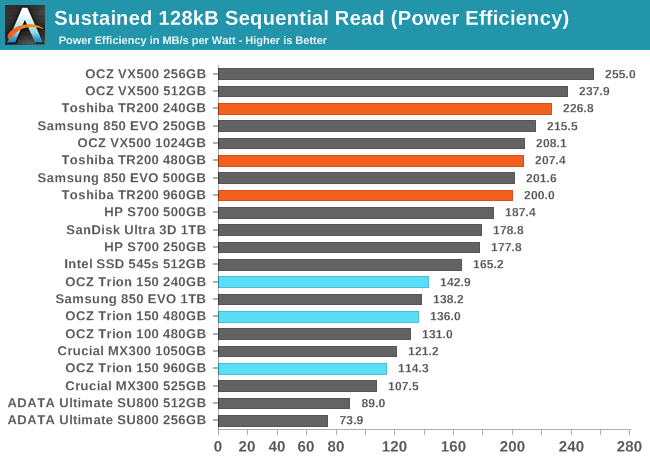
The power efficiency of the Toshiba TR200 is still above average, with the 240GB model in particular having a very good efficiency score. The HP S700 is not as efficient as the TR200 but is still reasonable, while the Crucial MX300 and ADATA SU800 score quite poorly on efficiency.
 |
|||||||||
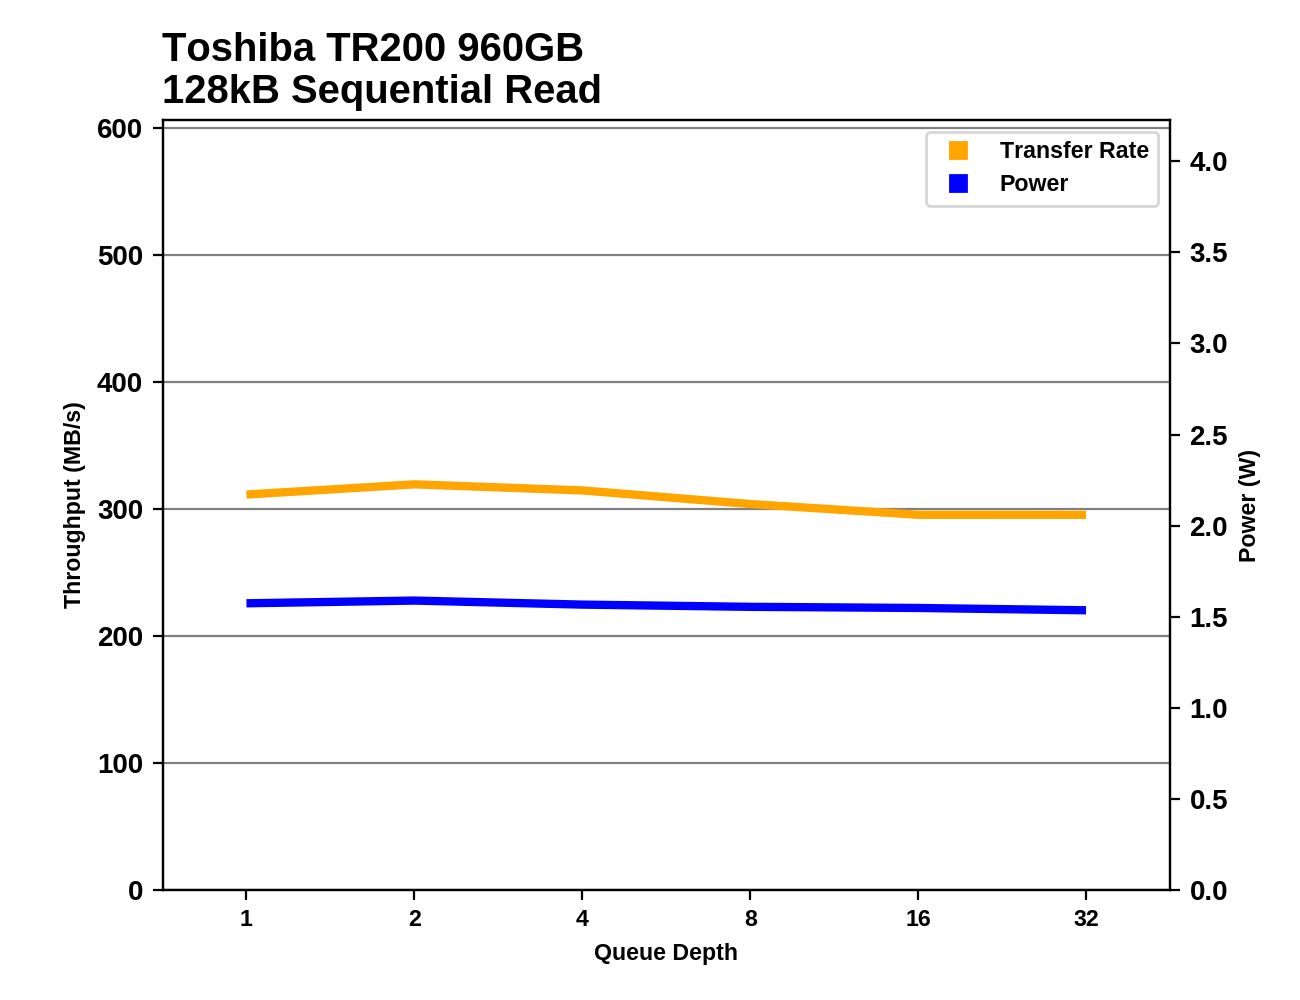
Performance is nice and flat across queue depths, with the exception that the 240GB TR200 is a bit slower at QD1 than at higher queue depths. Most drives are faster, but at least there's nothing funny happening with the TR200.
Sequential Write Performance
Our test of sequential write burst performance is structured identically to the sequential read burst performance test save for the direction of the data transfer. Each burst writes 128MB as 128kB operations issued at QD1, for a total of 1GB of data written to a drive containing 16GB of data.
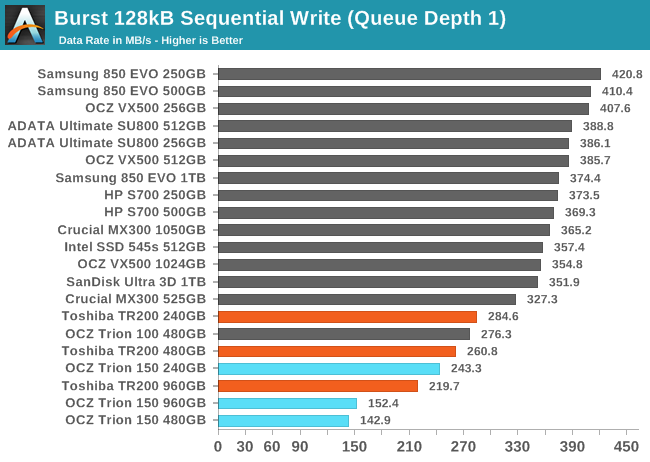
The burst sequential write performance of the TR200 is a significant improvement over the TR150, especially for the larger two capacities. They still have a bit further to go before catching up to the rest of the market: the TR/Trion series all stand out at the bottom of the chart.
Our test of sustained sequential writes is structured identically to our sustained sequential read test, save for the direction of the data transfers. Queue depths range from 1 to 32 and each queue depth is tested for up to one minute or 32GB, followed by up to one minute of idle time for the drive to cool off and perform garbage collection. The test is confined to a 64GB span of the drive.
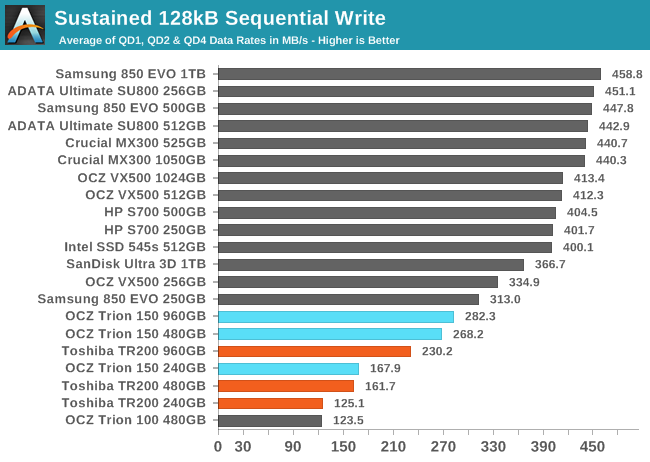
On the longer sequential write test, the TR200s end up worse off than their predecessors, not better. The Trion/TR series drives are still all the slowest, and the 240GB manages barely more than a quarter the performance of the 256GB ADATA SU800.
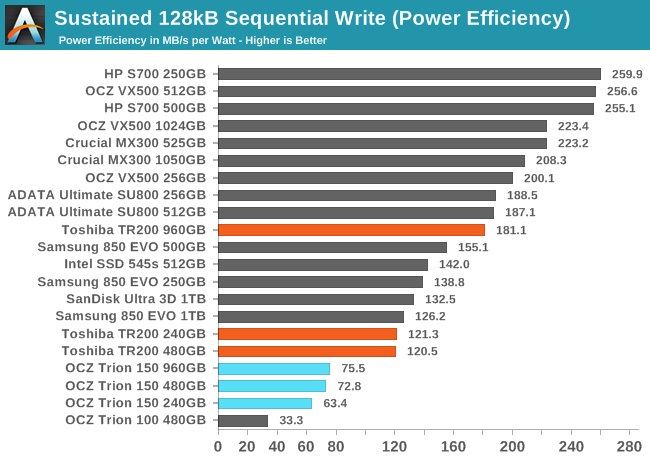
All capacities of the TR200 are far more efficient at sequential writes than their predecessors. This is especially true for the 960GB model, which is more than twice as efficient as its TR150 counterpart. The smaller models are still scoring poorly on efficiency, but are no longer major outliers.
 |
|||||||||
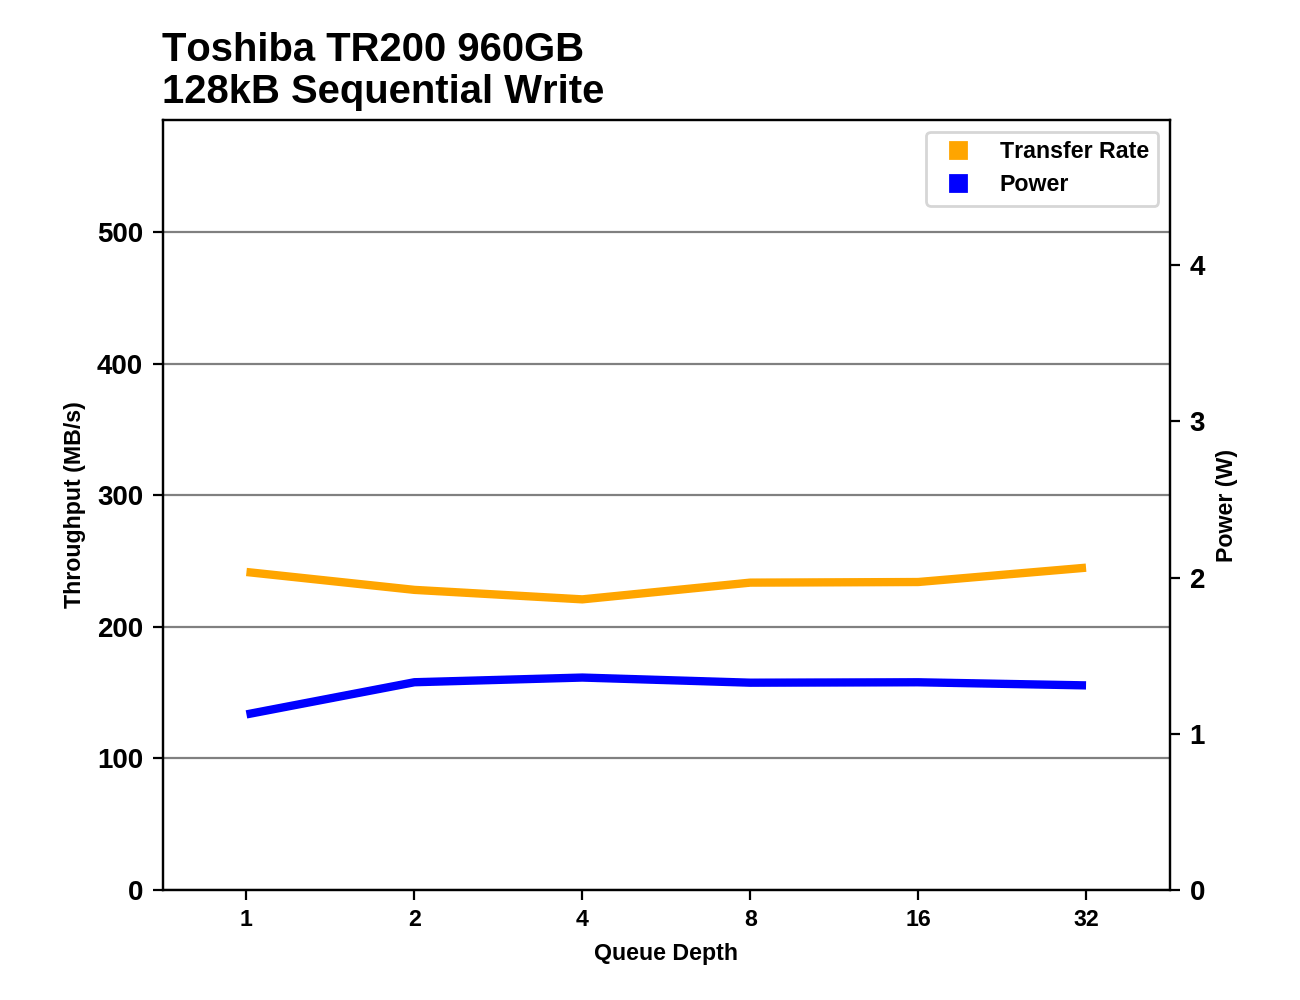
The sequential write performance of the 960GB TR200 varies a bit over the course of the test, but not as much as several other budget drives. All of the TR200s are pretty much in a class of their own offering lower performance and very low power consumption of just over 1W.
Mixed Random Performance
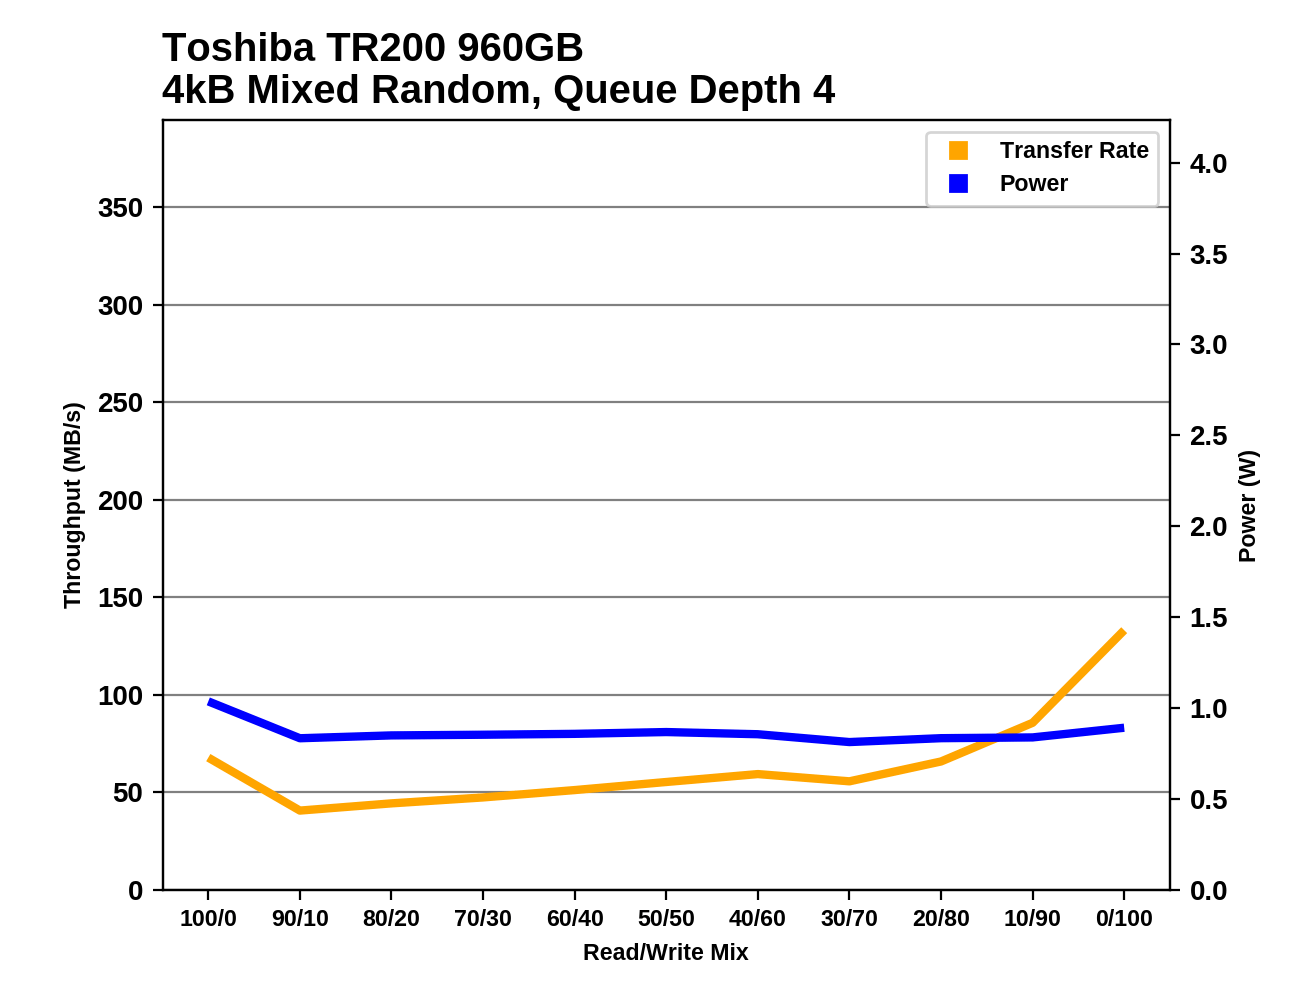
Our test of mixed random reads and writes covers mixes varying from pure reads to pure writes at 10% increments. Each mix is tested for up to 1 minute or 32GB of data transferred. The test is conducted with a queue depth of 4, and is limited to a 64GB span of the drive. In between each mix, the drive is given idle time of up to one minute so that the overall duty cycle is 50%.
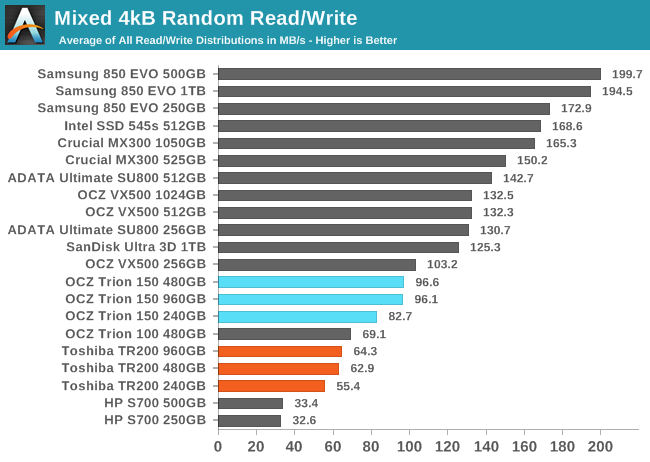
The mixed random I/O performance of the Toshiba TR200 is much faster than the HP S700, but is slower than everything else, even the earlier Trion/TR series drives. Contemporary budget SSDs like the ADATA SU800 and Crucial MX300 are more than twice as fast.
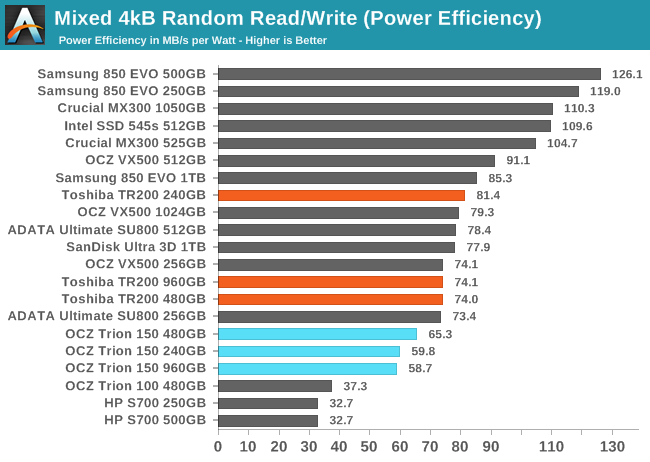
The power efficiency of the TR200 during the mixed random I/O test is a marked improvement over the TR150 and is more than twice that of the HP S700, but that's not enough for the TR200 to rate much better than acceptable.
 |
|||||||||
The performance of the TR200 during the mixed random I/O test traces out a common bathtub curve shape, with performance dropping after the initial pure reads phase and climbing very slowly as the proportion of writes increases, before accelerating near the end of the test as the workload shifts to mostly writes. The TR200s don't show a large spike in performance at the very end of the test like the TR150 does, but at least they don't bottom out anywhere near as low as the HP S700.
Mixed Sequential Performance
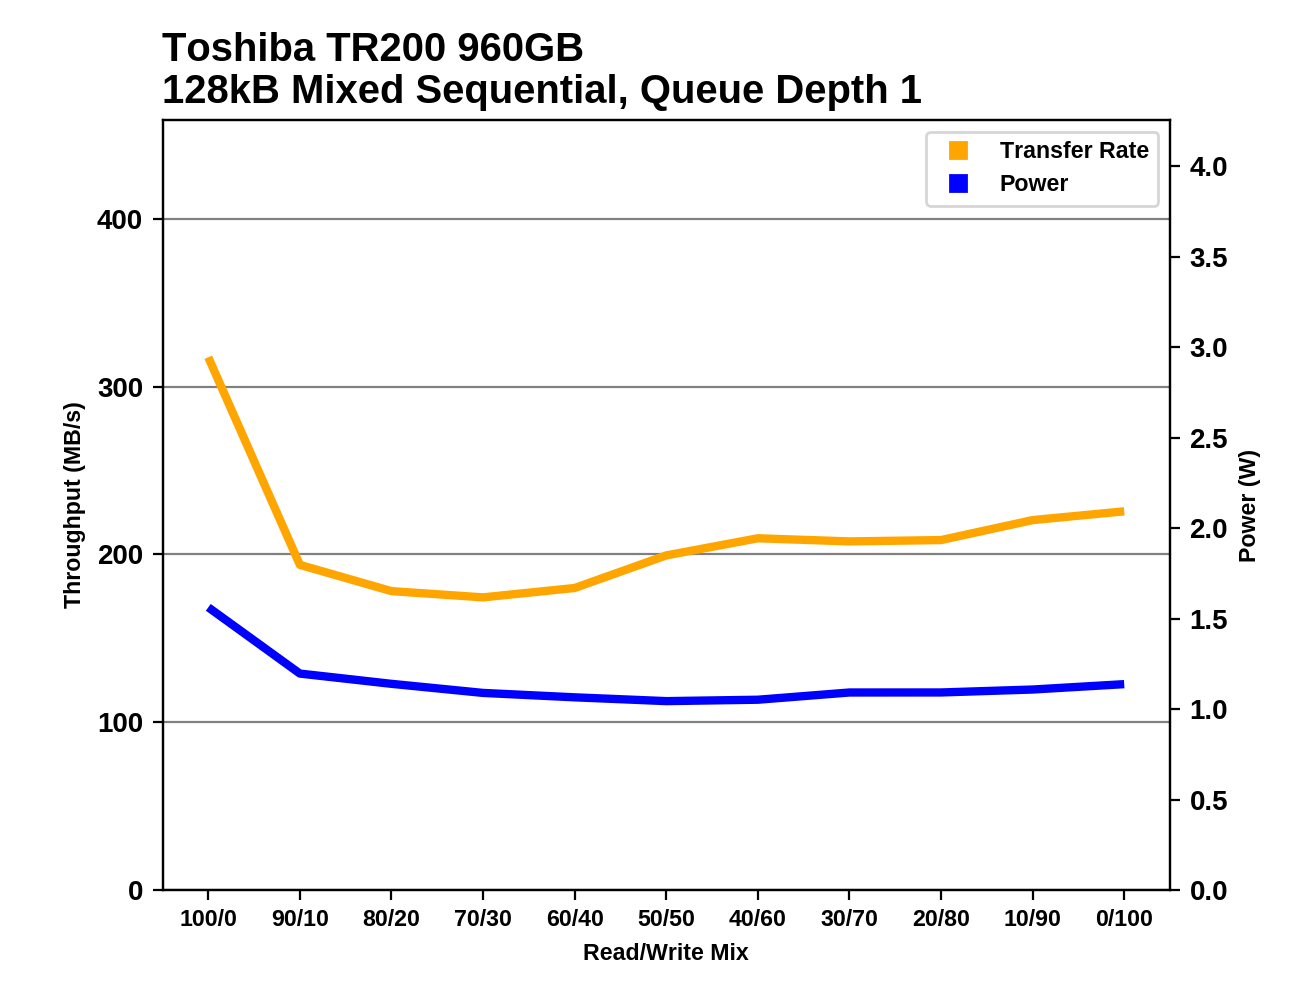
Our test of mixed sequential reads and writes differs from the mixed random I/O test by performing 128kB sequential accesses rather than 4kB accesses at random locations, and the sequential test is conducted at queue depth 1. The range of mixes tested is the same, and the timing and limits on data transfers are also the same as above.
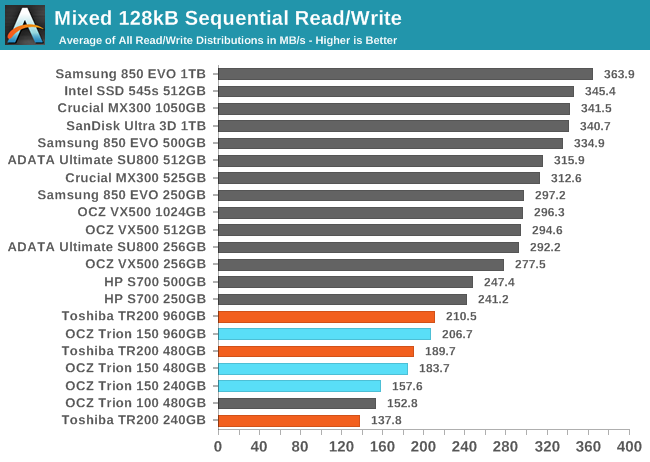
The larger two Toshiba TR200 models are marginally faster than their TR150 predecessors on the mixed sequential I/O test, but the 240GB has lost more than 12% of its overall performance. All of the TR/Trion series drives remain at the bottom of the chart, well below even the other DRAMless SSDs.
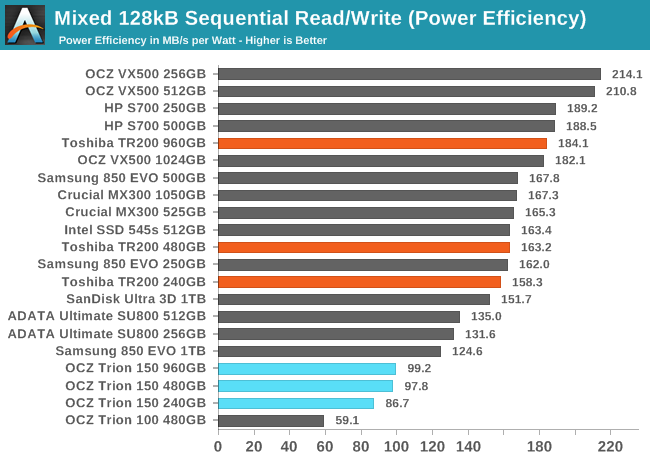
The TR200 climbs out of last place for power efficiency, and the 960GB model in particular is near the top of the chart along with the other DRAMless SSDs. The smaller two capacities have fairly average efficiency.
 |
|||||||||
All three of the TR200 models lose a lot of performance when writes are first added to the workload, but they regain a bit of performance through the first half of the test. The 960GB model gains a bit more performance in the second half of the test while the smaller models drop off again. The drives that do well on this test mostly either regain significant performance in the second half, or show steady increases across the entire test.
Power Management
Real-world client storage workloads leave SSDs idle most of the time, so the active power measurements presented earlier in this review only account for a small part of what determines a drive's suitability for battery-powered use. Especially under light use, the power efficiency of a SSD is determined mostly be how well it can save power when idle.
SATA SSDs are tested with SATA link power management disabled to measure their active idle power draw, and with it enabled for the deeper idle power consumption score and the idle wake-up latency test. Our testbed, like any ordinary desktop system, cannot trigger the deepest DevSleep idle state.
Idle power management for NVMe SSDs is far more complicated than for SATA SSDs. NVMe SSDs can support several different idle power states, and through the Autonomous Power State Transition (APST) feature the operating system can set a drive's policy for when to drop down to a lower power state. There is typically a tradeoff in that lower-power states take longer to enter and wake up from, so the choice about what power states to use may differ for desktop and notebooks.
We report two idle power measurements. Active idle is representative of a typical desktop, where none of the advanced PCIe link or NVMe power saving features are enabled and the drive is immediately ready to process new commands. The idle power consumption metric is measured with PCIe Active State Power Management L1.2 state enabled and NVMe APST enabled.
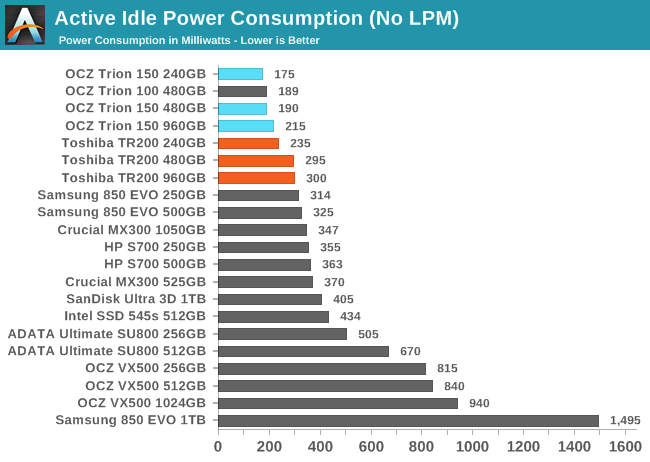
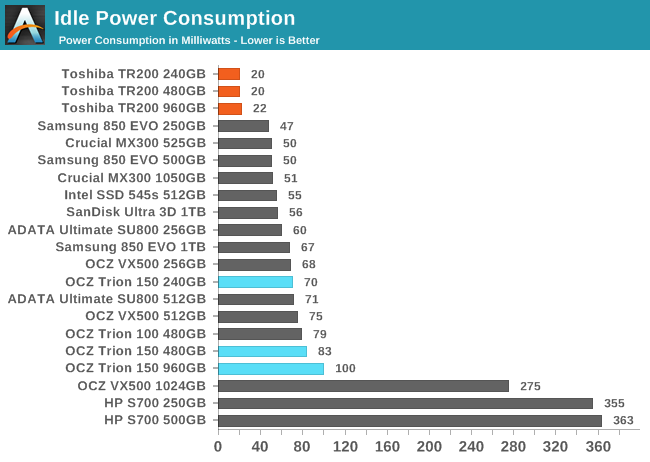
Drives using the Phison S10 controller have usually been the clear winners in the active idle power consumption test but not quite competitive when the slumber state us activated. The S11 controller used by the TR200 seems to be a little less effective at saving power with slumber state disabled, but when it's enabled they set a new record and are just barely within the resolution of our meter.
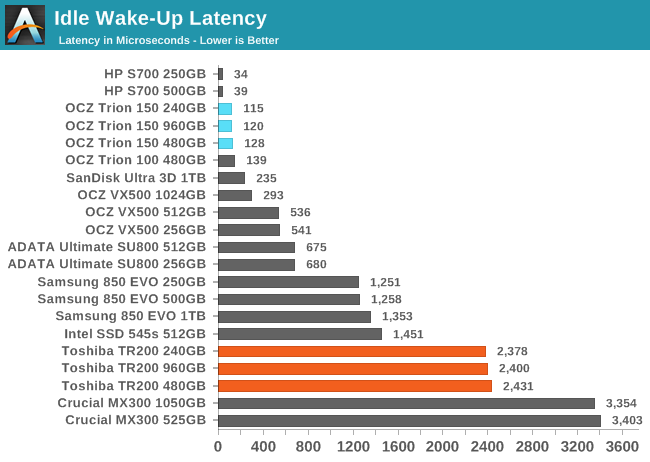
The exceptional idle power management of the TR200 comes at the cost of a fairly high wake-up latency, about 2.4 milliseconds, more than twenty times as long as the TR150 takes to wake up.
Conclusion
Toshiba's 3D NAND has been a long time coming. The first generation BiCS 3D NAND never hit the market, and the second generation had a limited release last year in a few niche products. This third generation design with 64 layers is finally ready for the broader market, and both the 256Gb and 512Gb parts are in mass production. The first SSD Toshiba shipped with BiCS 3 3D NAND was the XG5 NVMe SSD for OEMs, and it was a great way to start things off. The Toshiba TR200 brings that same 3D NAND to retail SSD market, but the impact is very different. The Toshiba TR200 is an entry-level budget SATA SSD, and the performance reflects that on virtually every test. It's slower than its predecessors and slower than the entry-level SSDs from many other major brands.
With that said, it's not all bad news: the Toshiba TR200 is very power efficient, and its performance and power consumption don't get much worse when the drive is full. The Toshiba TR200 has higher than normal latency across the board, but unlike many budget SSDs, the TR200 is pretty good about keeping latency from shooting through the roof when it's subjected to a heavy sustained workload. Only the heaviest of write-intensive workloads will cause the TR200's latency to occasionally spike to be many times higher than normal for a budget SATA SSD, and even then the read latency doesn't get too bad. Power draw rarely exceeds 1W, even during synthetic benchmarks.
Given how NAND flash prices have been driven up over the past year by an industry-wide shortage, it's no surprise that Toshiba has switched their entry-level product over to a DRAMless controller to keep costs under control. Toshiba has shown before that they are willing to participate in a race to the bottom: the original Trion 100 was one of the products that led the transition from MLC to TLC, sacrificing performance to reach new levels of affordability.
| SATA SSD Price Comparison | |||
| 240-275GB | 480-525GB | 960-1050GB | |
| Toshiba TR200 (MSRP) | $89.99 (37¢/GB) | $149.99 (31¢/GB) | $289.99 (30¢/GB) |
| ADATA SU800 | $89.99 (35¢/GB) | $158.65 (31¢/GB) | $274.99 (27¢/GB) |
| Crucial BX300 | $89.99 (38¢/GB) | $149.99 (31¢/GB) | |
| Crucial MX300 | $92.99 (34¢/GB) | $149.99 (29¢/GB) | $279.99 (27¢/GB) |
| Intel SSD 545s | $99.99 (39¢/GB) | $179.99 (35¢/GB) | |
| Samsung 850 EVO | $99.95 (40¢/GB) | $159.99 (32¢/GB) | $327.99 (33¢/GB) |
| SanDisk Ultra 3D | $99.99 (40¢/GB) | $164.99 (33¢/GB) | $284.99 (29¢/GB) |
| WD Blue 3D NAND | $98.39 (38¢/GB) | $164.65 (33¢/GB) | $299.99 (30¢/GB) |
At its initial MSRP, the TR200 isn't setting any records and isn't even the cheapest SATA SSD from a major brand. However, the arrival of Toshiba's 3D NAND in mass market quantities should start alleviating the NAND flash shortage and allow prices to start creeping downward over the next several months. The TR200 will probably drop a bit below MSRP once the novelty wears off and supplies are plentiful, and from there I expect Toshiba to adjust pricing to keep up with any overall industry shifts.
The cheapest SSDs from major brands currently go for at least 27 ¢/GB, while the TR200's MSRP starts at 30 ¢/GB. It probably needs to get down to around 25 ¢/GB to be a good deal. I'd like to see that happen for the holiday sales this winter, but I don't see that as likely. The manufacturers don't want to drop prices any sooner than they need to, and 64L 3D NAND still isn't quite plentiful from any of the manufacturers. There's hope that the situation will be much improved in the first half of next year, and the TR200 is an important step on that path.
But until Toshiba can bring the TR200 prices way down, it's making their 3D NAND look bad. Toshiba should hurry up and deliver a retail counterpart to the XG5 as the successor to the OCZ RD400. And for the consumer SATA market, they should seriously reconsider leaving the TR200 and VX500 as the only options until BiCS4 is ready. The last-generation controllers used in the TR150 and VX500 may not be ready for 3D NAND, but the consumers are, and the TR200 isn't enough to satisfy the demand. Going into 2018, Toshiba needs a higher-performing SATA SSD that goes up to 2TB.


