Original Link: https://www.anandtech.com/show/12538/the-mydigitalssd-sbx-ssd-review-nvme-on-the-cheap
The MyDigitalSSD SBX SSD Review: NVMe On The Cheap
by Billy Tallis on May 1, 2018 8:05 AM EST
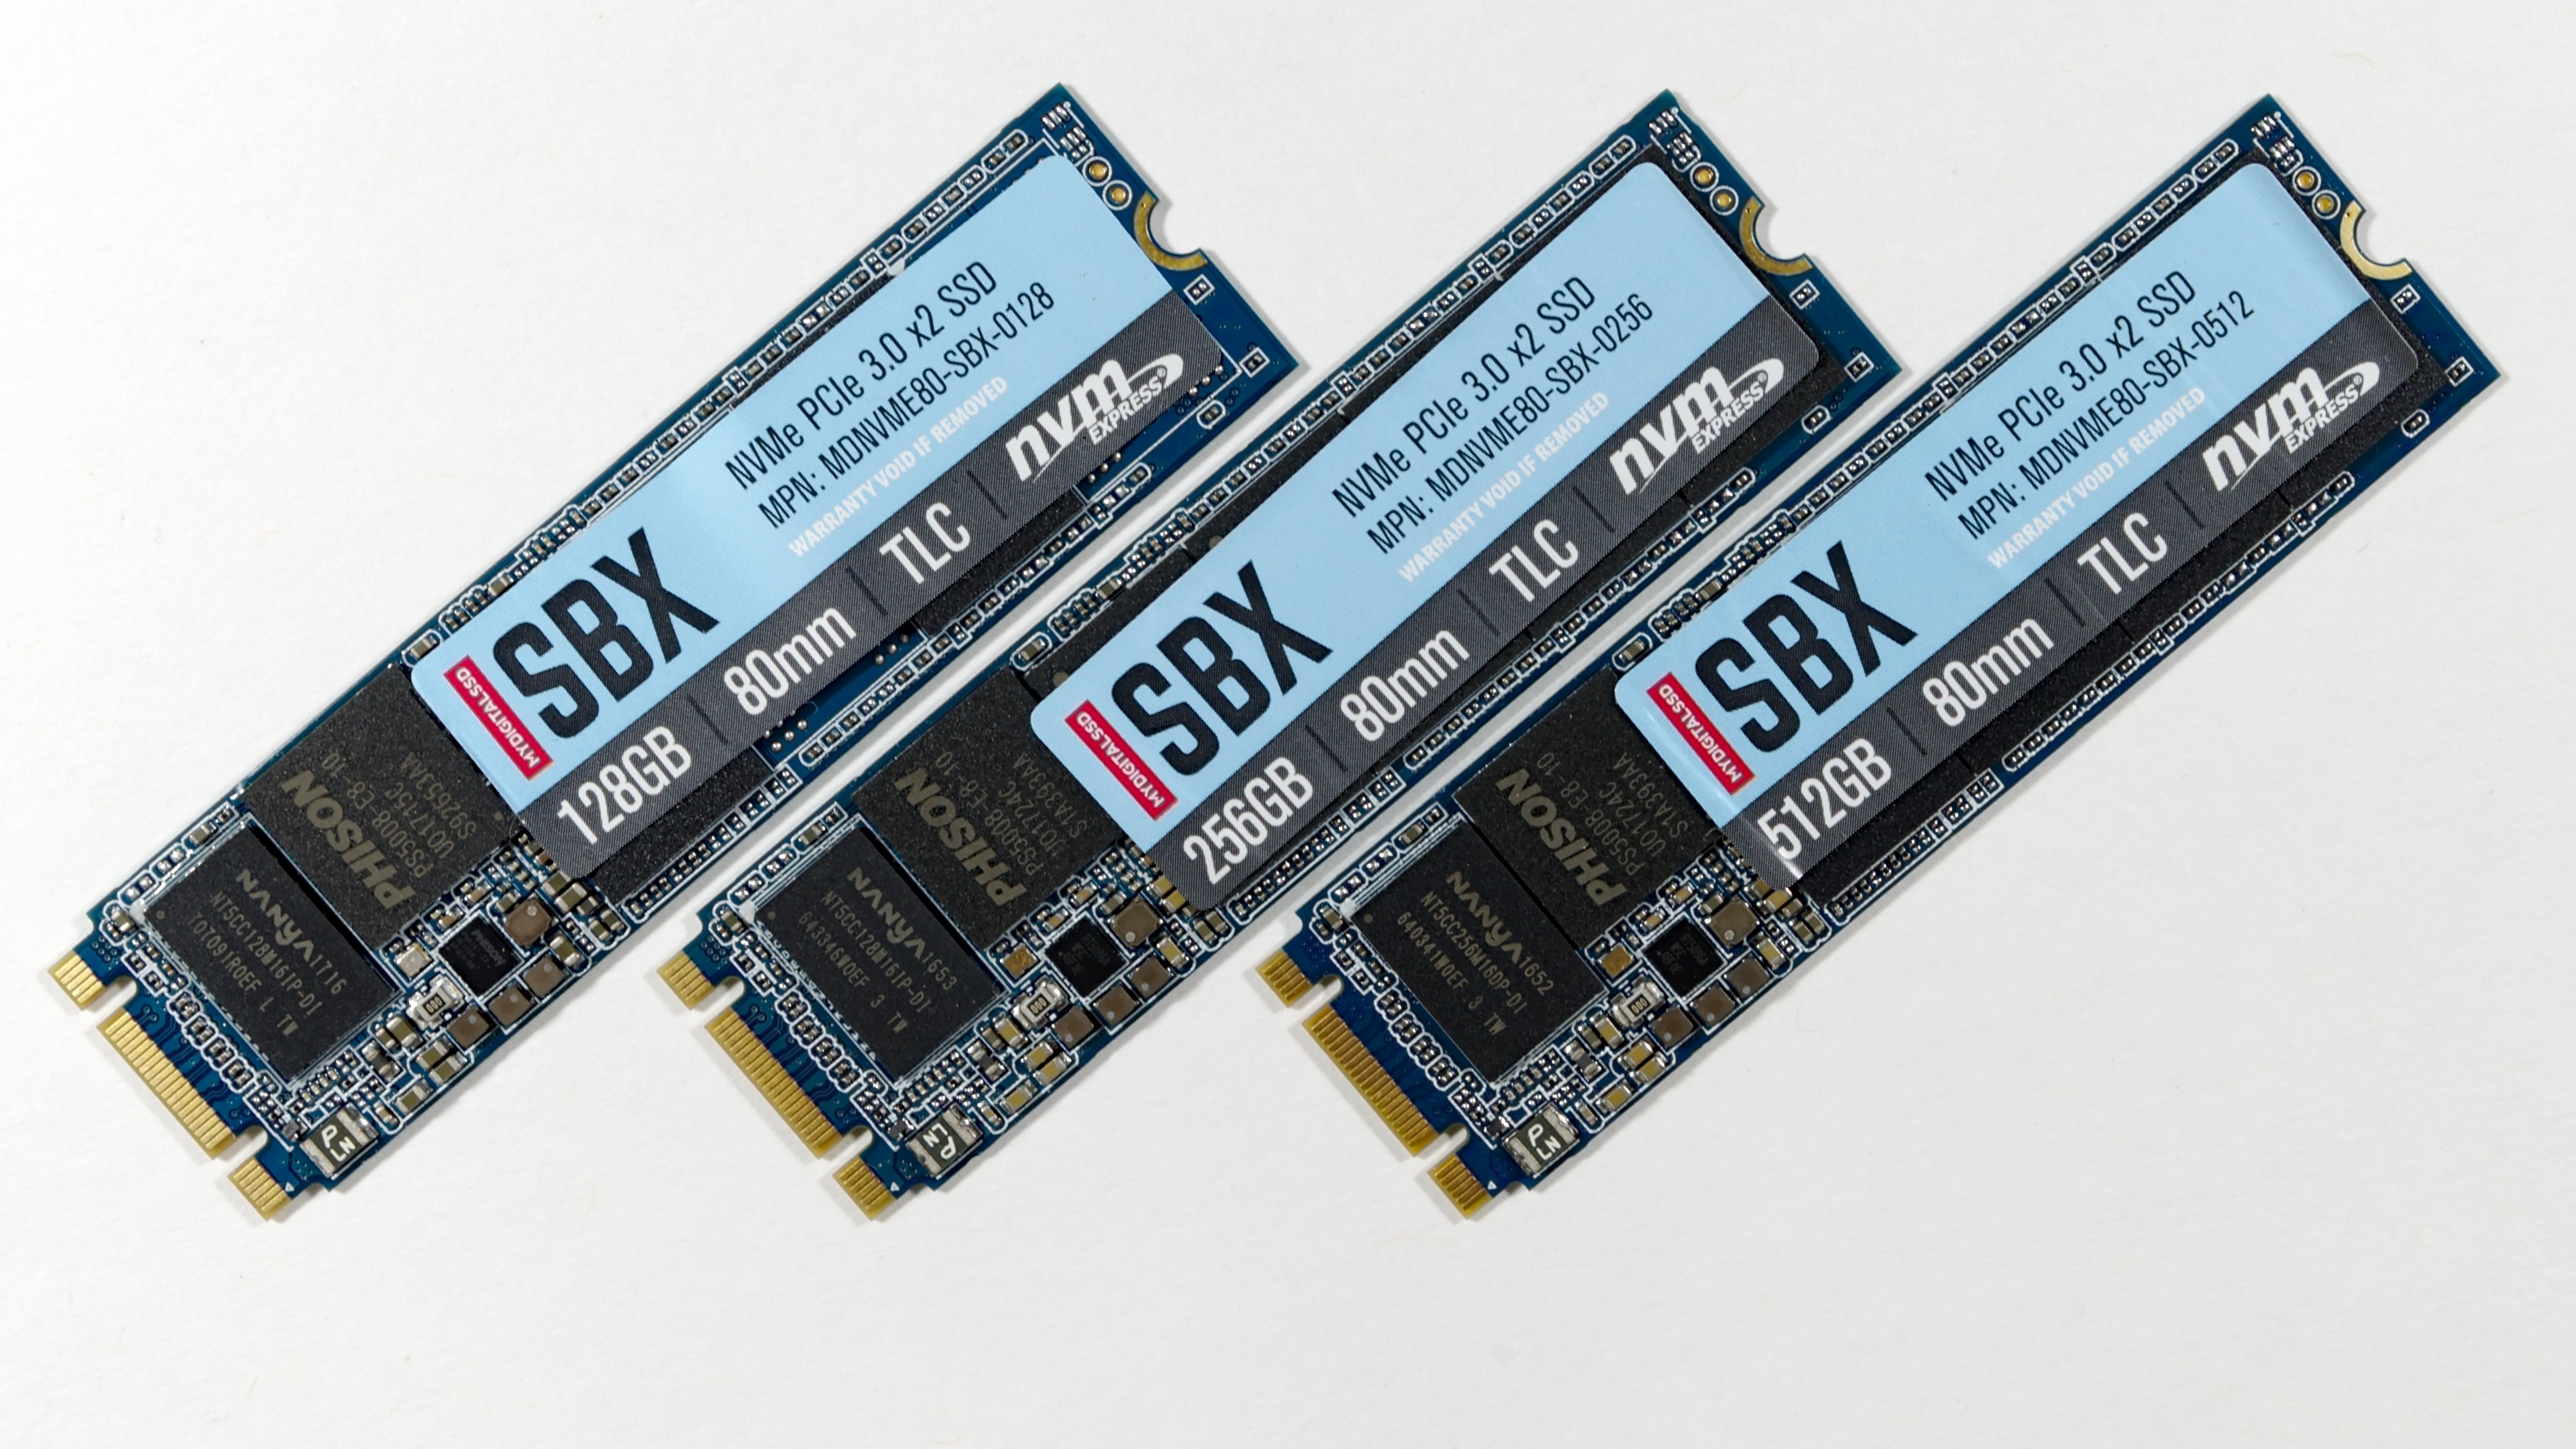
MyDigitalSSD's business model revolves around selling drives based on Phison reference designs. Like any other small SSD brand, MyDigitalSSD lacks the resources to develop their own SSD controller or even write their own firmware from scratch. The way MyDigitalSSD distinguishes themselves from the many competing brands is by offering drives for substantially lower prices and by being one of the first to market with new controllers from Phison. The SBX checks both boxes: it is priced below the Samsung 860 EVO SATA SSD, and it hit the market in December 2017 as the first Phison E8 drive to ship and one of the earliest retail SSDs to feature Toshiba/SanDisk 64-layer 3D NAND.
As one of the cheapest NVMe SSDs on the retail market, the MyDigitalSSD SBX is a good indicator of the progress NVMe drives have made toward replacing SATA SSDs instead of merely coexisting as a premium high-end alternative.
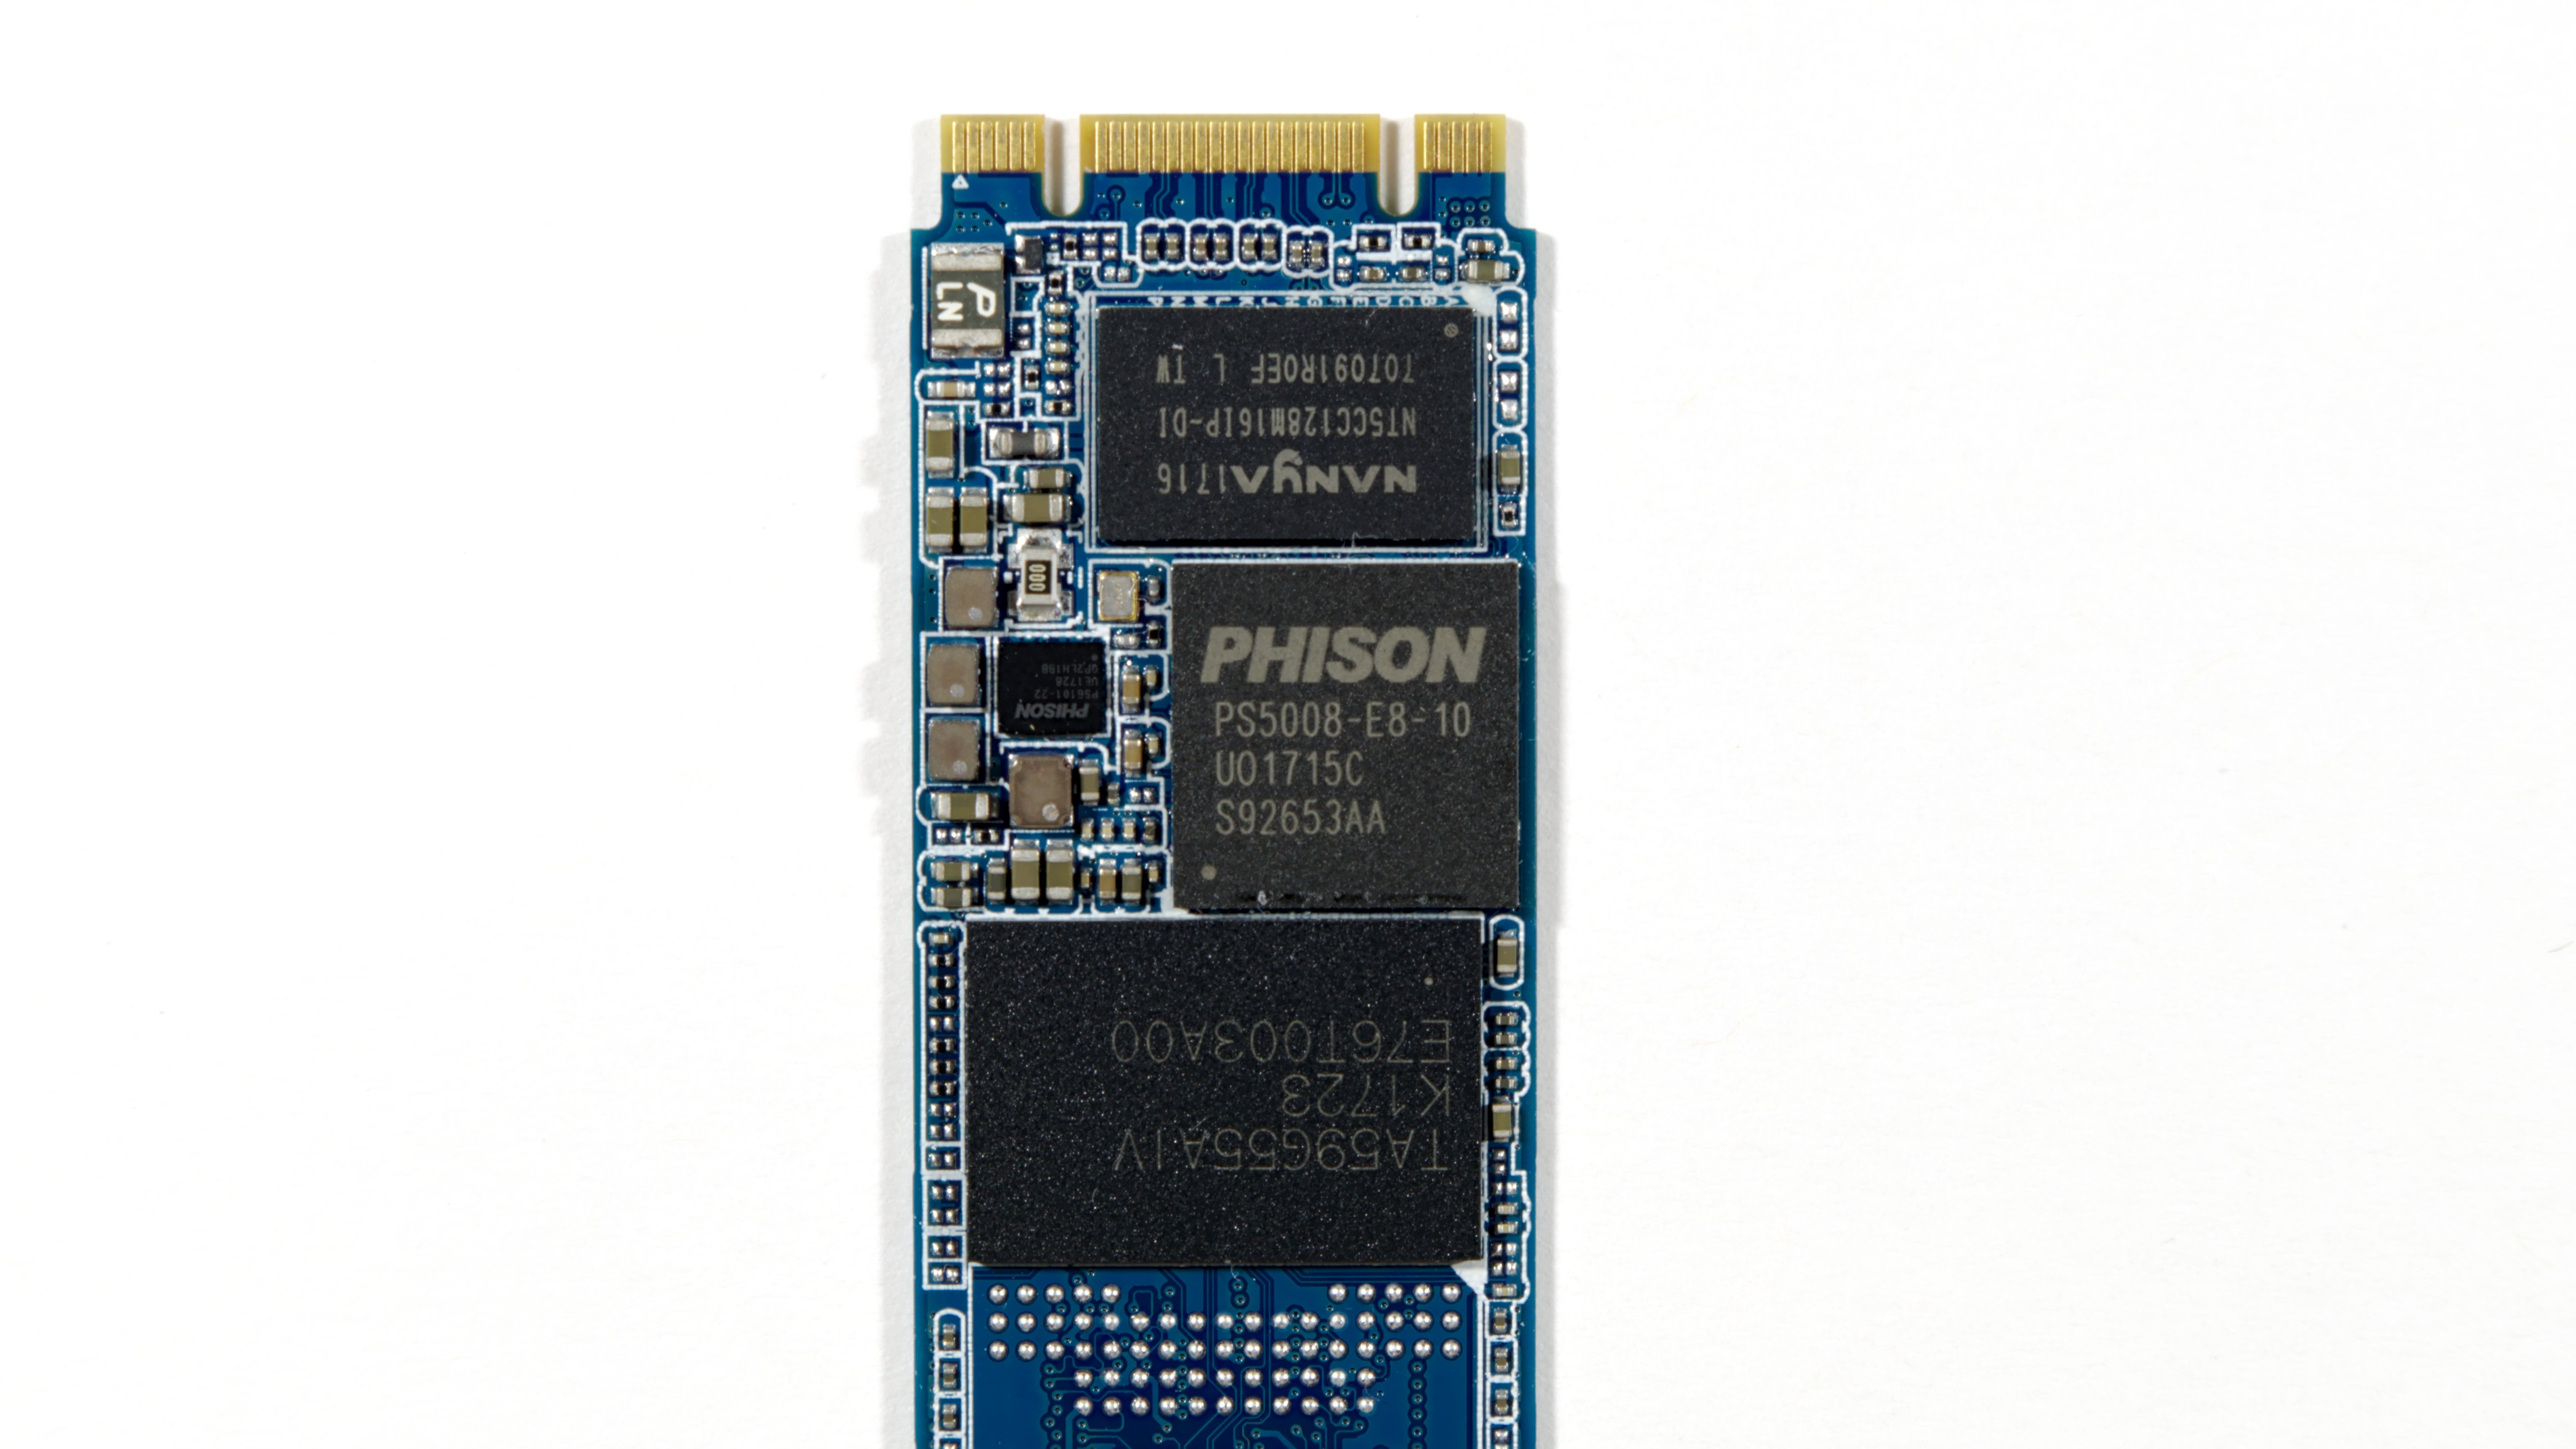
The Phison E8 controller is one of Phison's low-end options from their second generation of NVMe SSD controllers. The E8 features just two PCIe lanes instead of the usual 4 enabled by an M.2 slot, and a four-channel interface to the NAND—half what is typical for high-end NVMe SSDs. These restrictions combined with a 40nm fabrication process allow the E8 to be a much smaller and cheaper controller than those aiming for the high-end part of the market. To cut costs even further, drive makers can opt for the Phison E8T variant that drops the external DRAM interface. The E8T supports the NVMe Host Memory Buffer feature to mitigate the performance impact DRAMless SSDs usually suffer from, but the E8T hasn't caught on in the consumer SSD market yet.


Despite its low-end role, the Phison E8 is in several ways more advanced than Phison's E7, their first NVMe SSD controller. Major improvements to the error correction capabilities have allowed the E8 to support 3D TLC NAND instead of being confined to the 15nm planar MLC used by E7 drives. The E8 and E8T controllers will also be joined by a high-end E12 controller later this year to round out Phison's second generation of NVMe controllers.
| MyDigitalSSD SBX Specifications | |||||
| Capacity | 128 GB | 256 GB | 512 GB | 1 TB | |
| Form Factor | M.2 2280 | ||||
| Interface | PCIe 3.1 x2, NVMe 1.2 | ||||
| Controller | Phison PS5008-E8 | ||||
| NAND | Toshiba BiCS3 64-layer 3D TLC | ||||
| DRAM | DDR3 | ||||
| Sequential Read | 1600 MB/s | ||||
| Sequential Write | 1300 MB/s | ||||
| 4KB Random Read | 240k IOPS | ||||
| 4KB Random Write | 180k IOPS | ||||
| Max Power | 5 W | ||||
| Write Endurance | 120 TB 0.5 DWPD |
200 TB 0.4 DWPD |
375 TB 0.4 DWPD |
800 TB 0.4 DWPD |
|
| Warranty | 5 years | ||||
| Amazon Price | $52.99 (41¢/GB) | $84.99 (33¢/GB) | $157.99 (31¢/GB) | $309.99 (30¢/GB) | |
This review will primarily compare the SBX against other recent NVMe SSDs, but a few SATA results are included for context. As the cheapest NVMe SSD we have tested so far, the SBX isn't quite in direct competition to all the NVMe SSDs it is being compared against. We have other low-end NVMe SSD reviews in the works including Kingston's A1000 (their take on the Phison E8 platform), and the HP EX900 featuring Silicon Motion's low-end SM2263XT controller. ADATA's SX6000 is the main alternative to the SBX for a NVMe drive in this price range, but we have not had the chance to test the SX6000 or any other drives using Realtek's SSD controller.
We did not test the MyDigitalSSD BPX, the SBX's predecessor based on the Phison E7 platform with 15nm planar MLC NAND. Instead, we have results from the Patriot Hellfire and Team T-Force Cardea, two other M.2 drives based on the same reference design.
| AnandTech 2017/2018 Consumer SSD Testbed | |
| CPU | Intel Xeon E3 1240 v5 |
| Motherboard | ASRock Fatal1ty E3V5 Performance Gaming/OC |
| Chipset | Intel C232 |
| Memory | 4x 8GB G.SKILL Ripjaws DDR4-2400 CL15 |
| Graphics | AMD Radeon HD 5450, 1920x1200@60Hz |
| Software | Windows 10 x64, version 1709 |
| Linux kernel version 4.14, fio version 3.1 | |
- Thanks to Intel for the Xeon E3 1240 v5 CPU
- Thanks to ASRock for the E3V5 Performance Gaming/OC
- Thanks to G.SKILL for the Ripjaws DDR4-2400 RAM
- Thanks to Corsair for the RM750 power supply, Carbide 200R case, and Hydro H60 CPU cooler
- Thanks to Quarch for the XLC Programmable Power Module and accessories
- Thanks to StarTech for providing a RK2236BKF 22U rack cabinet.
AnandTech Storage Bench - The Destroyer
The Destroyer is an extremely long test replicating the access patterns of very IO-intensive desktop usage. A detailed breakdown can be found in this article. Like real-world usage, the drives do get the occasional break that allows for some background garbage collection and flushing caches, but those idle times are limited to 25ms so that it doesn't take all week to run the test. These AnandTech Storage Bench (ATSB) tests do not involve running the actual applications that generated the workloads, so the scores are relatively insensitive to changes in CPU performance and RAM from our new testbed, but the jump to a newer version of Windows and the newer storage drivers can have an impact.
We quantify performance on this test by reporting the drive's average data throughput, the average latency of the I/O operations, and the total energy used by the drive over the course of the test.
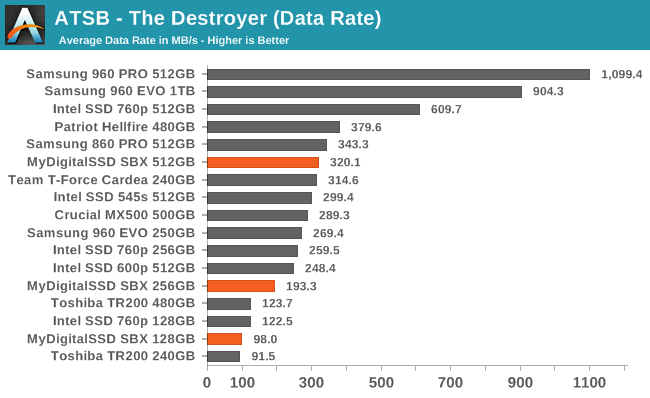
The average data rates from the MyDigitalSSD SBX on The Destroyer are faster than most but not all SATA SSDs of comparable capacity. As expected, the SBX is one of the slowest NVMe SSDs, but it does outperform the Intel SSD 600p.
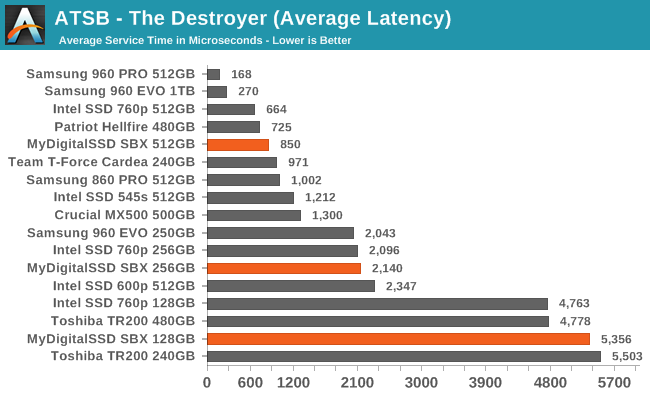
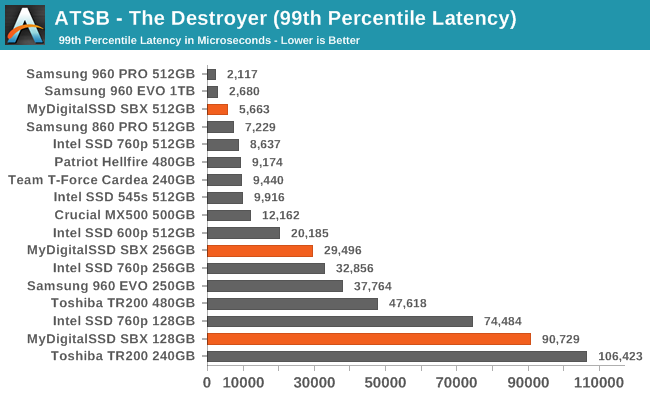
Average and 99th percentile latencies from the SBX on The Destroyer are generally higher than for other NVMe SSDs, but it isn't a drastic outlier like a DRAMless SATA drive. The larger two capacities actually beat several competitors for 99th percentile latency.
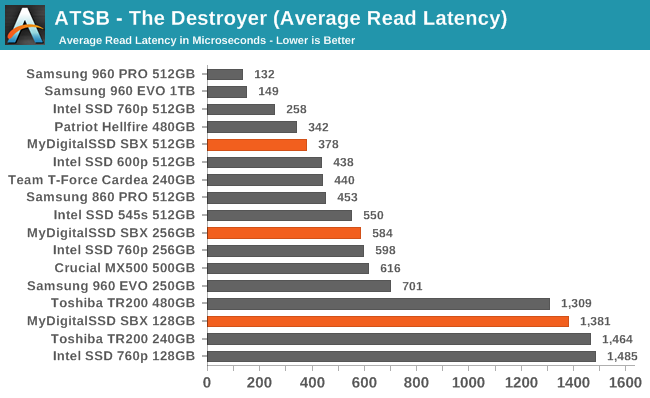
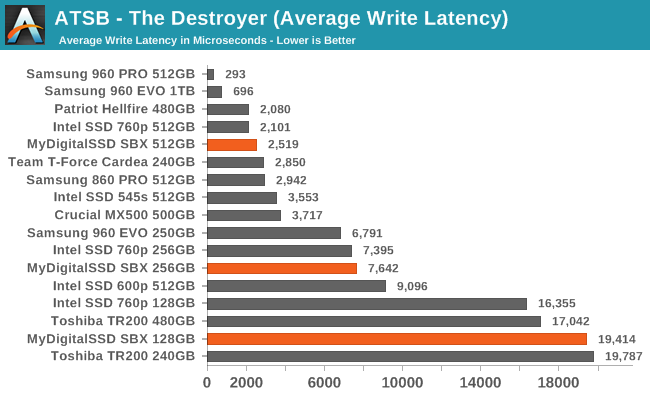
The smaller two capacities of the MyDigitalSSD SBX have slightly better average read latency than the Intel SSD 760p. Otherwise, average read and write latencies are higher than most other NVMe SSDs but are still better than SATA drives.
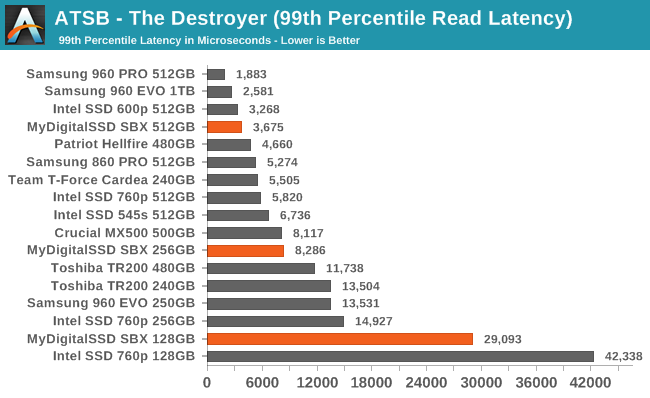
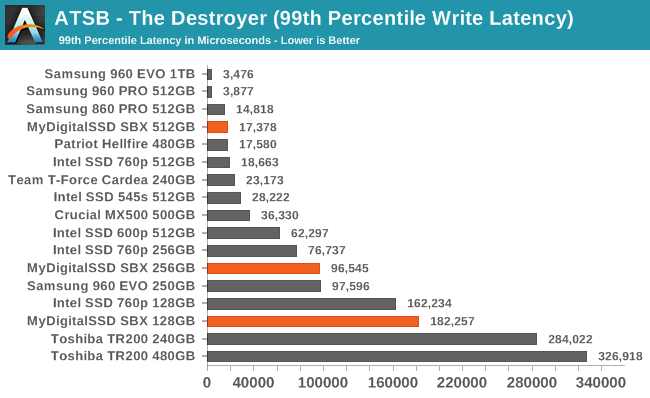
The MyDigitalSSD SBX has reasonable 99th percentile read and write latency scores—especially the 512GB model. The smaller capacities have much higher tail latencies, but are not as bad as the Intel 760p.
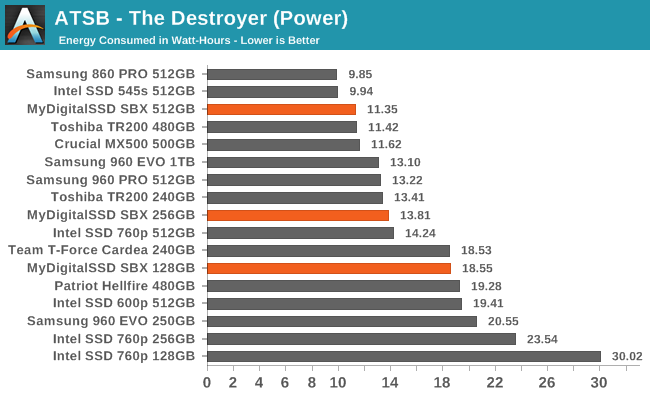
Energy usage by the MyDigitalSSD SBX on The Destroyer varies widely between the different capacities. The 512GB SBX uses very little energy by NVMe standards, but the smaller drives take much longer to complete the test and use substantially more total energy by the time they finish.
AnandTech Storage Bench - Heavy
Our Heavy storage benchmark is proportionally more write-heavy than The Destroyer, but much shorter overall. The total writes in the Heavy test aren't enough to fill the drive, so performance never drops down to steady state. This test is far more representative of a power user's day to day usage, and is heavily influenced by the drive's peak performance. The Heavy workload test details can be found here. This test is run twice, once on a freshly erased drive and once after filling the drive with sequential writes.
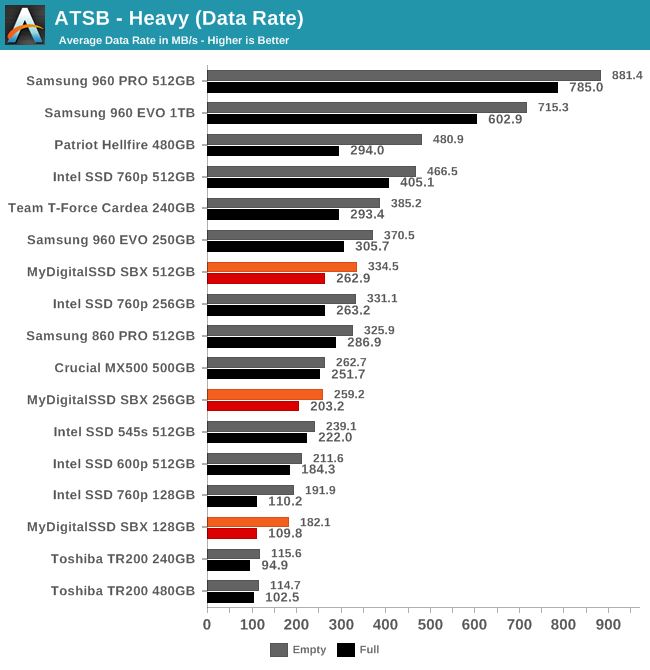
The average data rates of the MyDigitalSSD SBX on the Heavy test make it clear that while it is not the slowest NVMe SSD we've tested, it is the slowest we've encountered so far from the current generation. The Intel SSD 760p is tied with the SBX at 128GB but has a clear performance advantage at higher capacities. Compared to the SATA SSDs, the SBX doesn't have much advantage over the 860 PRO but is clearly faster than more mainstream drives like the Crucial MX500.
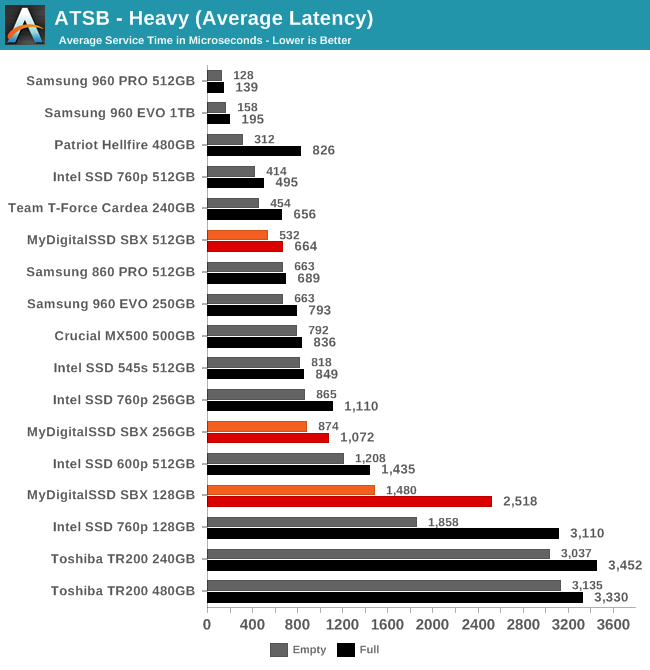
The average and 99th percentile latency results show that the 128GB SBX suffers significantly more than its larger siblings when the test is run on a full drive. The 128GB Intel 760p shows an even larger impact that puts its average latency up in the range of the DRAMless SATA drives.
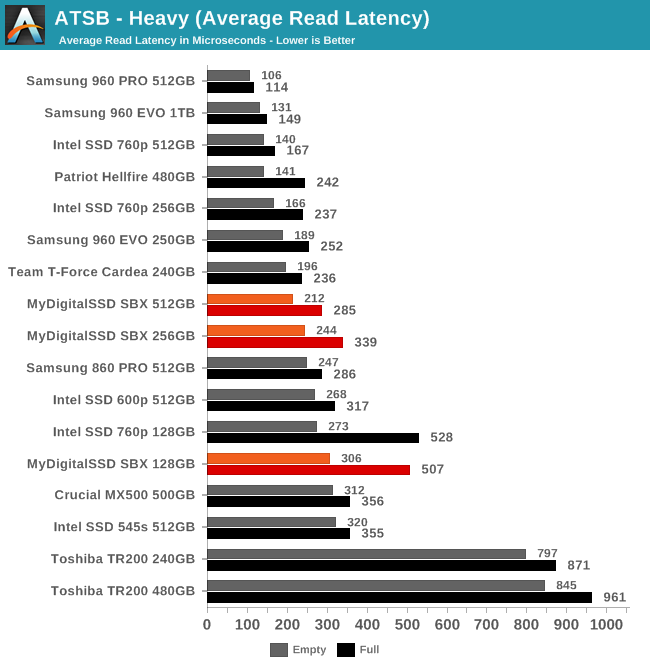
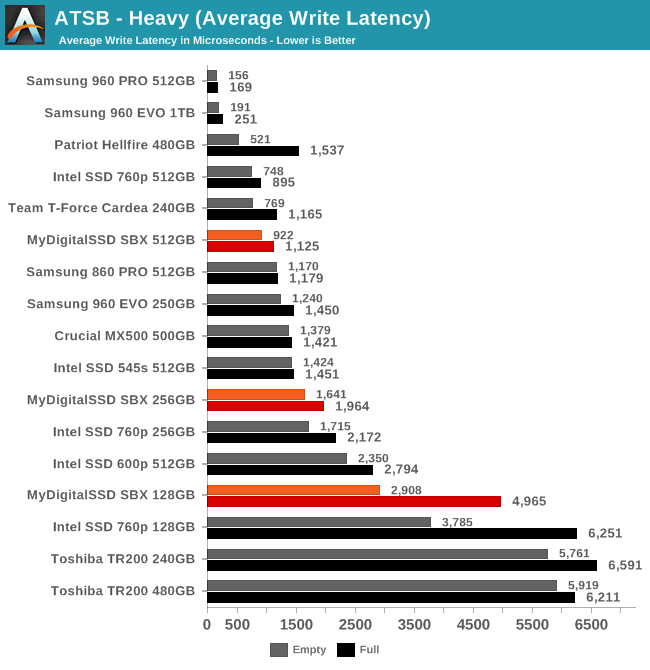
The average write latency scores show much greater variation between drives than the average read latency scores. For both scores, the SBX ranks about where expected: worse than most other NVMe drives but usually better than SATA drives.
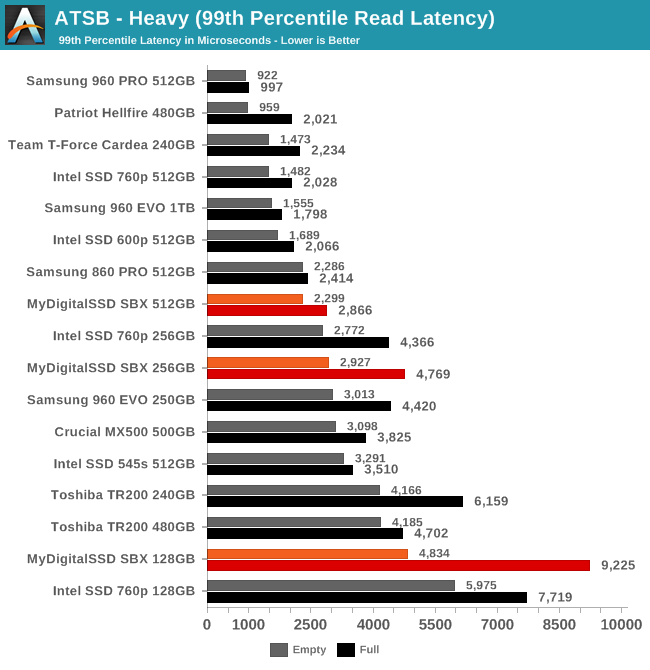
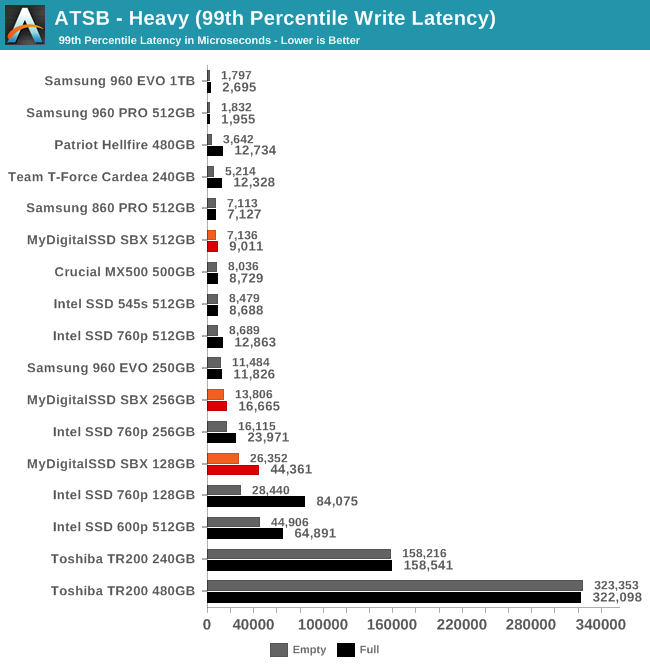
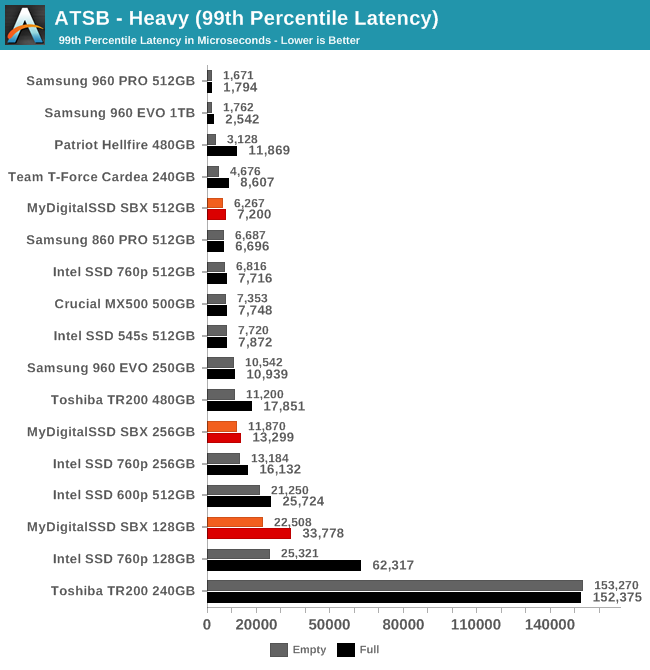
The 99th percentile read latency scores highlight how the 128GB SBX is particularly challenged by its low capacity. All capacities of the SBX have reasonable QoS on the write side of things, where the SBX consistently scores better than the Intel 760p.
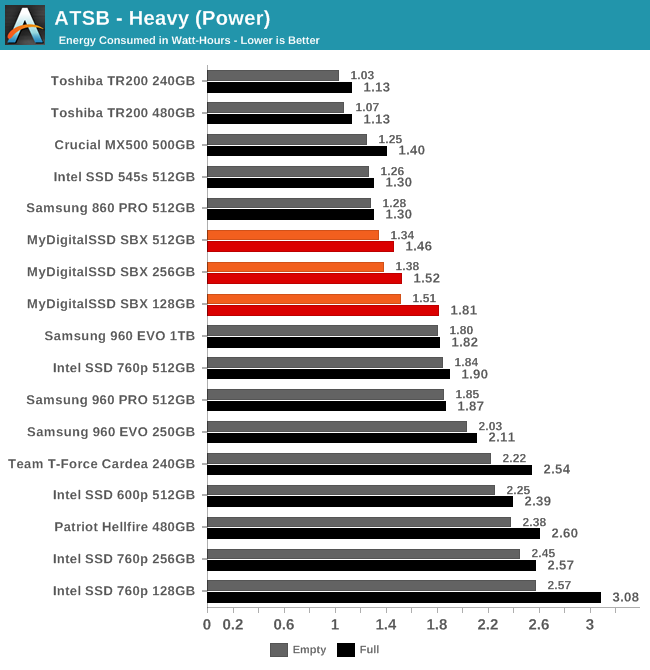
The MyDigitalSSD SBX completes the Heavy test while using less energy overall than almost all NVMe SSDs. Its energy usage is slightly higher than typical for mainstream SATA SSDs, but this is no surprise: even a two-lane PCIe link requires more power than a SATA link.
AnandTech Storage Bench - Light
Our Light storage test has relatively more sequential accesses and lower queue depths than The Destroyer or the Heavy test, and it's by far the shortest test overall. It's based largely on applications that aren't highly dependent on storage performance, so this is a test more of application launch times and file load times. This test can be seen as the sum of all the little delays in daily usage, but with the idle times trimmed to 25ms it takes less than half an hour to run. Details of the Light test can be found here. As with the ATSB Heavy test, this test is run with the drive both freshly erased and empty, and after filling the drive with sequential writes.
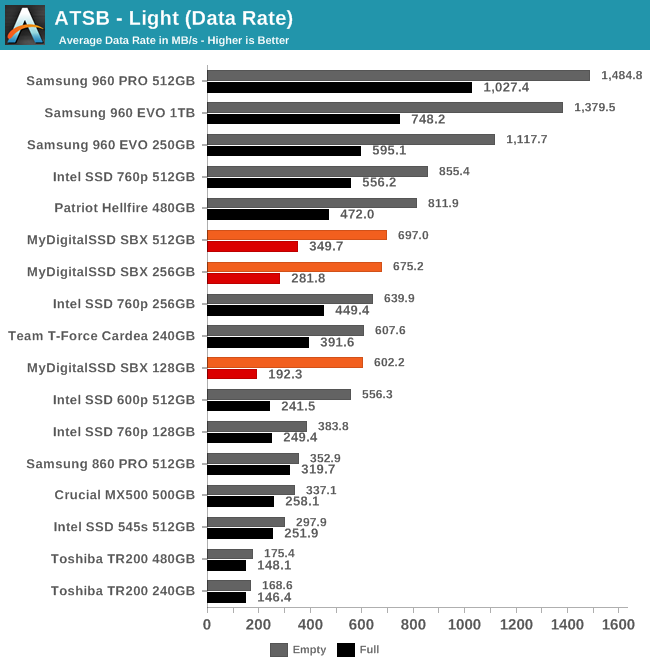
On the Light test, almost all NVMe SSDs have the opportunity to significantly outpace all SATA SSDs—when the test is run on an empty drive. When the drives are full, only some of the faster NVMe drives still need the extra bandwidth of PCI Express. The MyDigitalSSD SBX suffers more than most drives from being full, and the effect is more severe at lower capacities. The SBX is still faster than SATA drives in those difficult conditions.
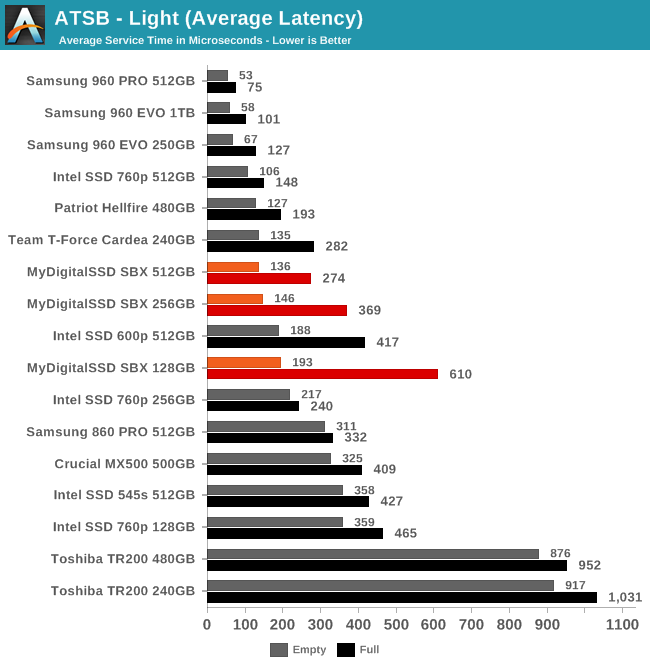
The full-drive test runs show significantly higher average and 99th percentile latency, especially for the smaller capacities of the SBX. The empty-drive test runs show latency that is much more in line with other NVMe drives and is generally much better than how the smaller Intel 760p drives behave.
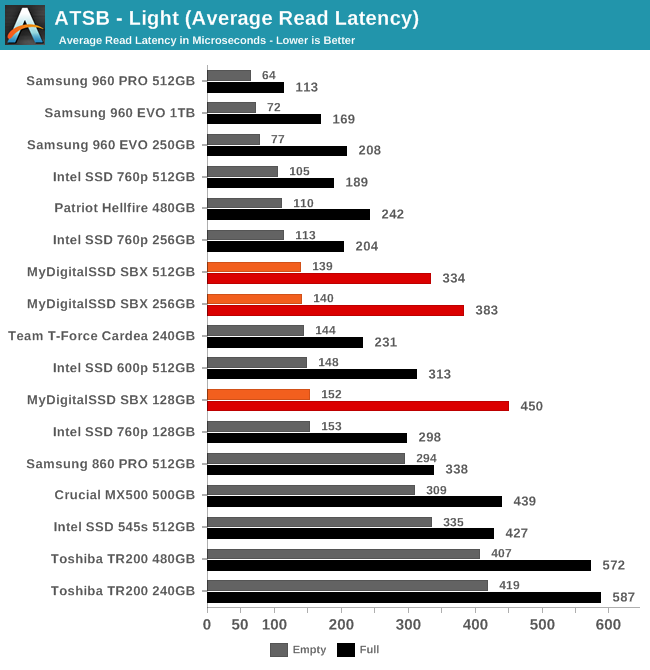
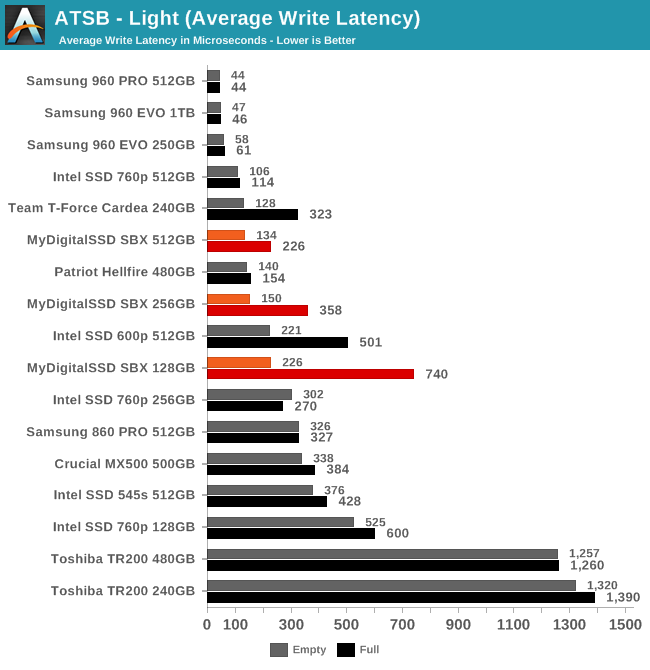 Almost everything shows a fairly large disparity in average read latency between full and empty drive conditions for the Light test, so the MyDigitalSSD SBX doesn't stand out too much. The full-drive average write latency scores for the SBX aren't the only poor results in the bunch, but they are still outliers compared to NVMe drives in general.
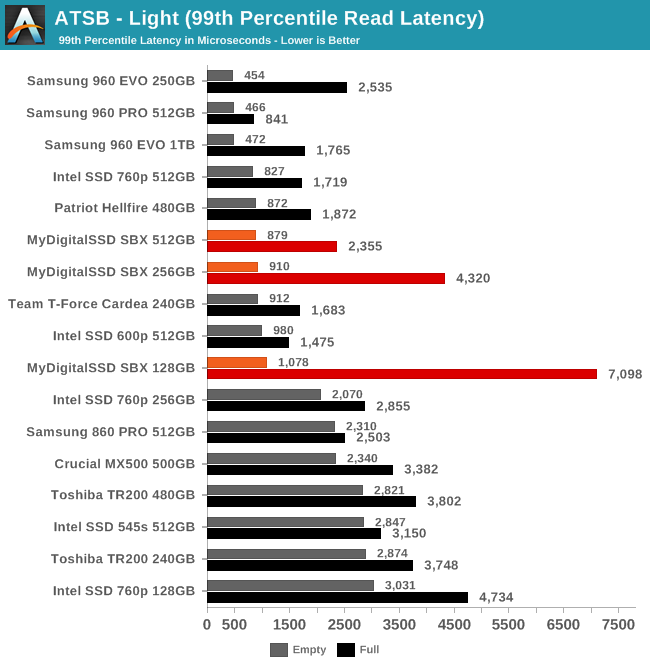
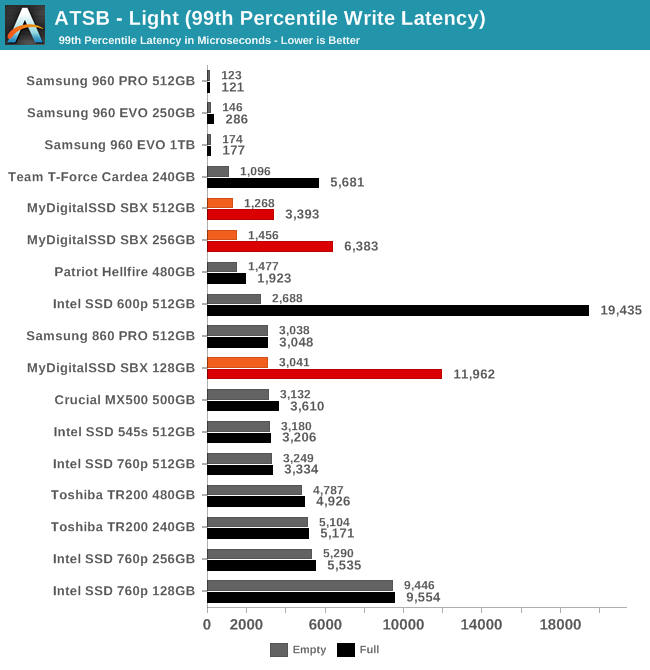
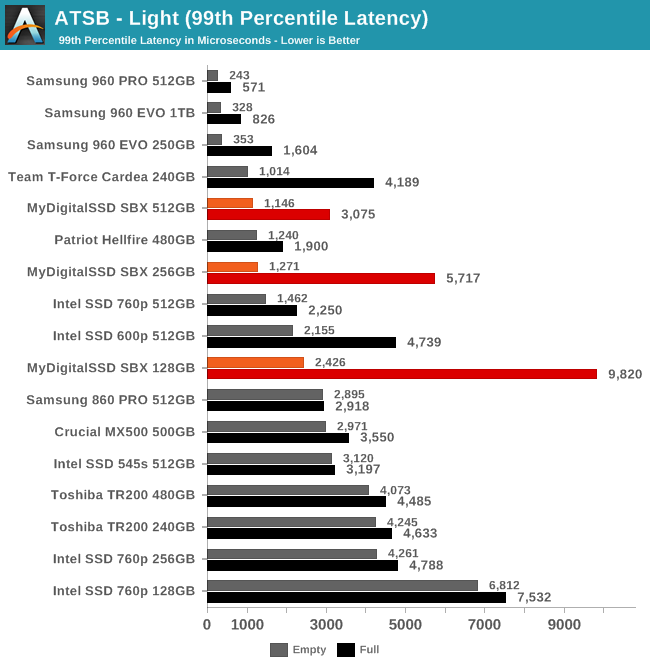
The 99th percentile read and write scores for the MyDigitalSSD SBX show reasonable QoS for the empty-drive test runs, but some of the worst results we've measured for full drive performance. The Intel 760p's results are probably worse for real-world scenarios, because its empty drive latency is almost as bad as the full drive latency.
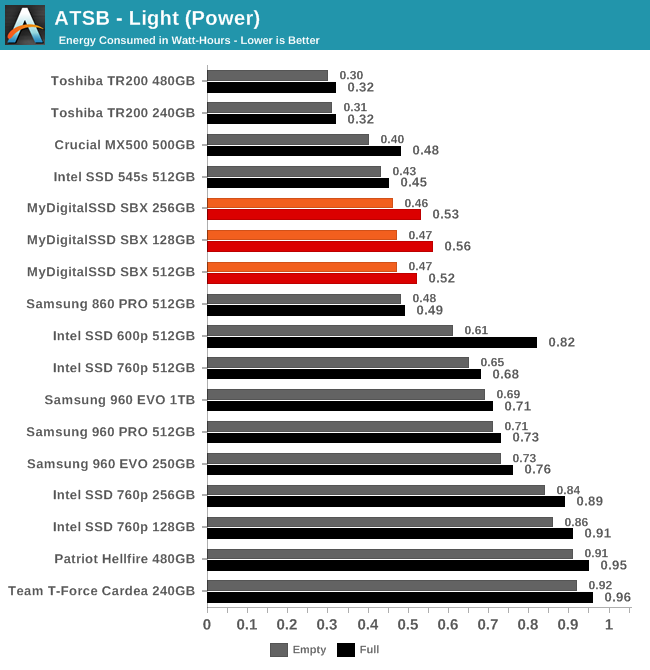
The three capacities of the MyDigitalSSD SBX all have about the same energy usage on the Light test. Their efficiency scores are great by NVMe standards, but mediocre by the standards of modern SATA drives. The SBX has reduced energy usage almost by half compared to the Phison E7 drives.
Random Read Performance
Our first test of random read performance uses very short bursts of operations issued one at a time with no queuing. The drives are given enough idle time between bursts to yield an overall duty cycle of 20%, so thermal throttling is impossible. Each burst consists of a total of 32MB of 4kB random reads, from a 16GB span of the disk. The total data read is 1GB.
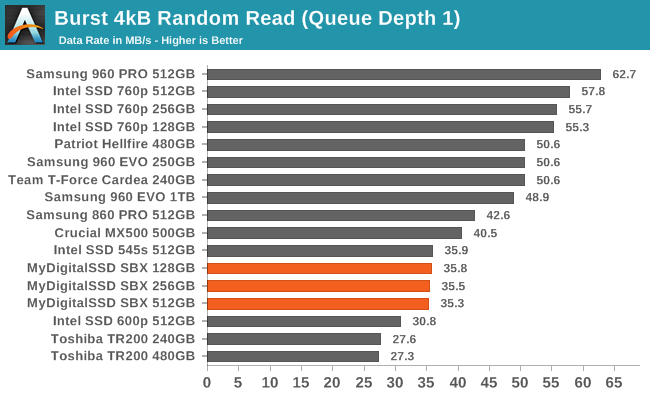
The QD1 burst random read performance of the MyDigitalSSD SBX is relatively poor, falling behind the top tier of SATA SSDs. The SBX is faster than the Intel SSD 600p, but the newer Intel 760p is more than 50% faster than the SBX.
Our sustained random read performance is similar to the random read test from our 2015 test suite: queue depths from 1 to 32 are tested, and the average performance and power efficiency across QD1, QD2 and QD4 are reported as the primary scores. Each queue depth is tested for one minute or 32GB of data transferred, whichever is shorter. After each queue depth is tested, the drive is given up to one minute to cool off so that the higher queue depths are unlikely to be affected by accumulated heat build-up. The individual read operations are again 4kB, and cover a 64GB span of the drive.
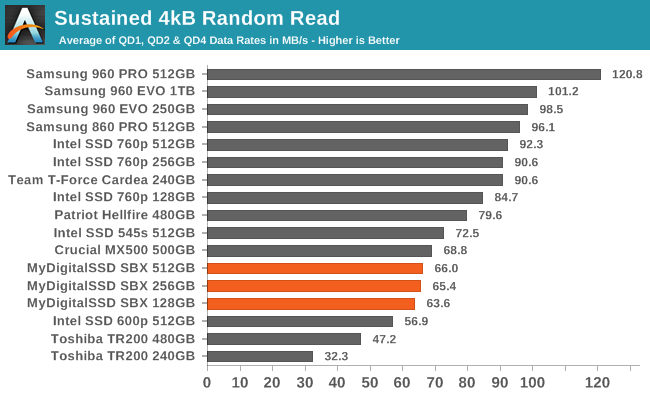
The ranking of the MyDigitalSSD SBX doesn't change much on the longer random read test, but many of the faster drives have traded places. Even with some higher queue depths involved, the SBX can't quite match the best SATA SSDs for random read performance.
 |
|||||||||
| Power Efficiency in MB/s/W | Average Power in W | ||||||||
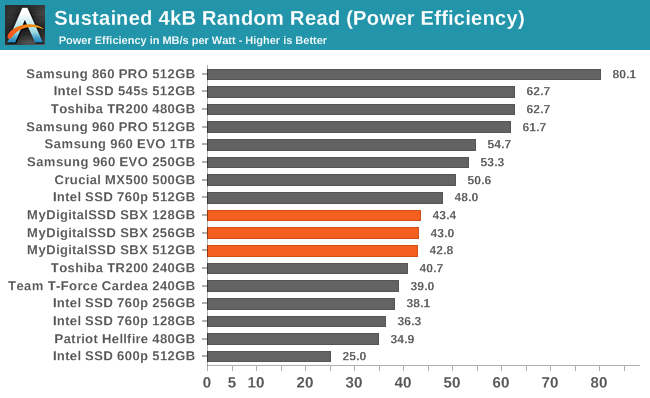
The MyDigitalSSD SBX draws substantially less power during the random read test than most NVMe SSDs, which leads to an efficiency score that is about average. Many of the SATA drives have a significant efficiency advantage, as do several of the fastest NVMe SSDs.
 |
|||||||||
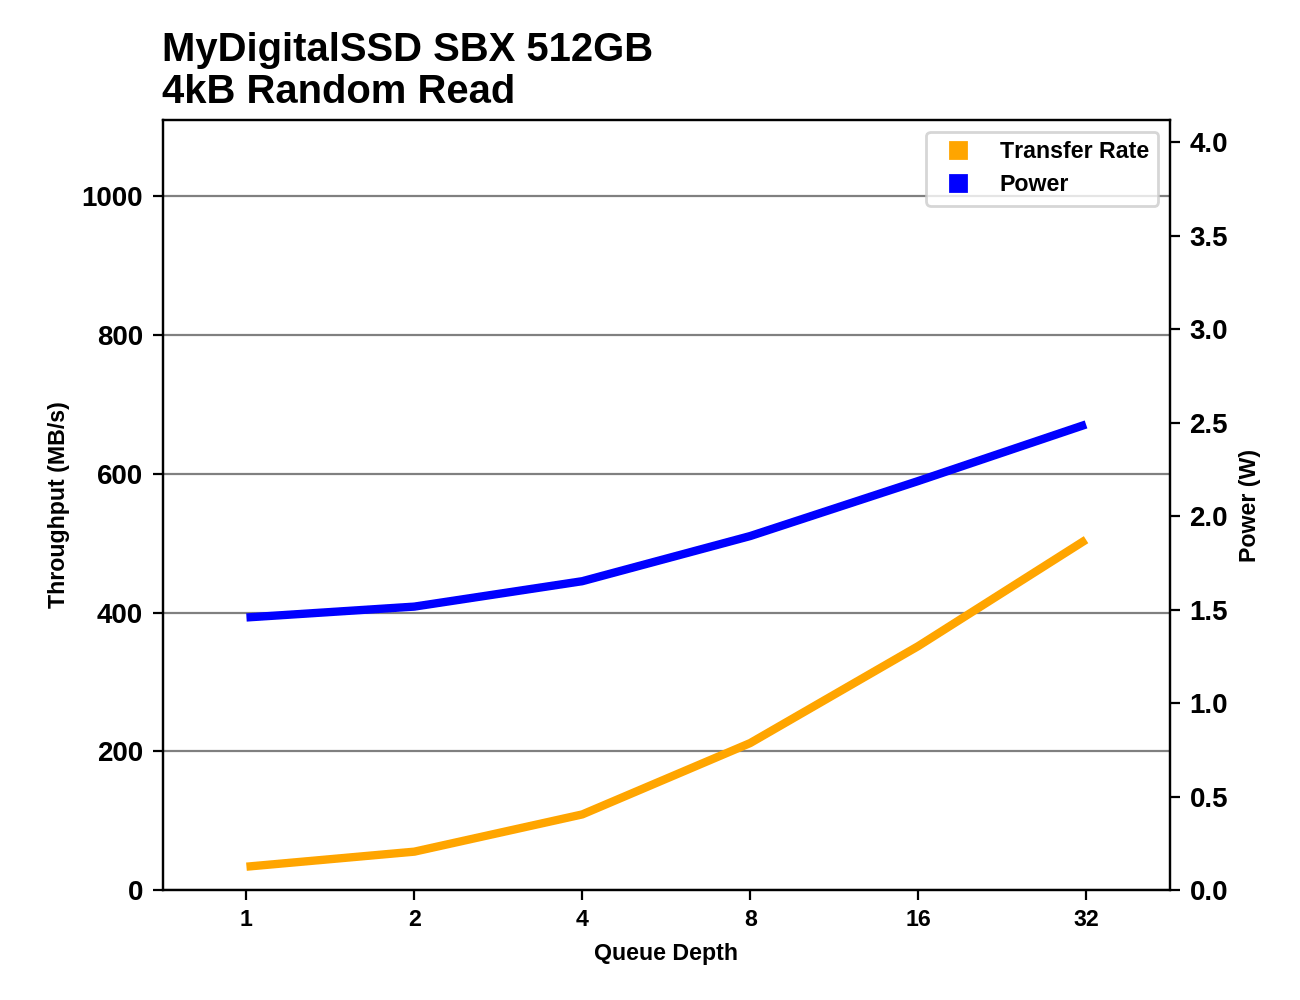
The 512GB SBX clearly has room for further throughput increases past QD32, but the smaller capacities start falling behind past QD4 and are close to saturation by QD32. The Intel SSD 760p shows similar performance scaling that is almost always a bit faster than the SBX, but also requires significantly more power across the board.
Random Write Performance
Our test of random write burst performance is structured similarly to the random read burst test, but each burst is only 4MB and the total test length is 128MB. The 4kB random write operations are distributed over a 16GB span of the drive, and the operations are issued one at a time with no queuing.
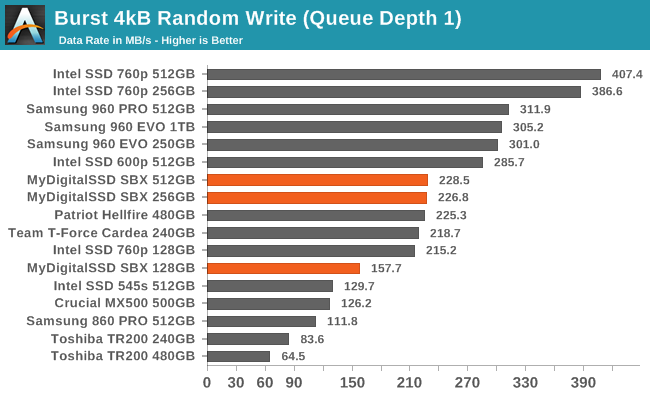
The burst random write performance of the MyDigitalSSD SBX can't match the unusually good performance from the Intel SSD 760p, but it is certainly reasonable for a low-end NVMe SSD. The 128GB SBX is about 30% slower than the larger capacities, but is still faster than the SATA drives.
As with the sustained random read test, our sustained 4kB random write test runs for up to one minute or 32GB per queue depth, covering a 64GB span of the drive and giving the drive up to 1 minute of idle time between queue depths to allow for write caches to be flushed and for the drive to cool down.
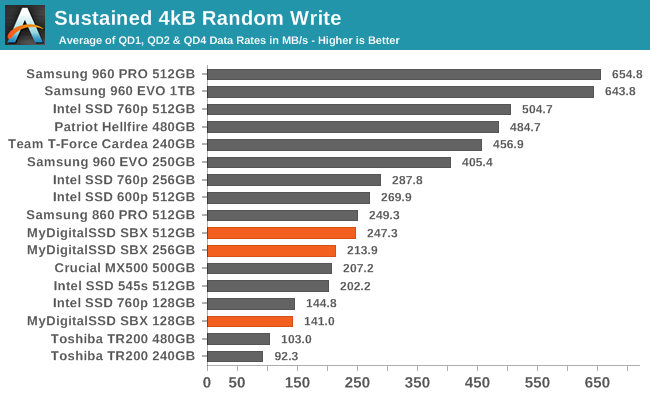
On the longer random write test, SLC cache size limitations come into play and the 128GB drives end up near the bottom of the chart, above only the DRAMless SATA drives. The larger capacities aren't quite as fast as the top SATA SSDs, and the more expensive NVMe SSDs offer more than double the throughput of the SBX even at these relatively low queue depths.
 |
|||||||||
| Power Efficiency in MB/s/W | Average Power in W | ||||||||
The SBX is again using much less power than the other NVMe SSDs, but its poor performance leaves it with a fairly low efficiency score.
 |
|||||||||
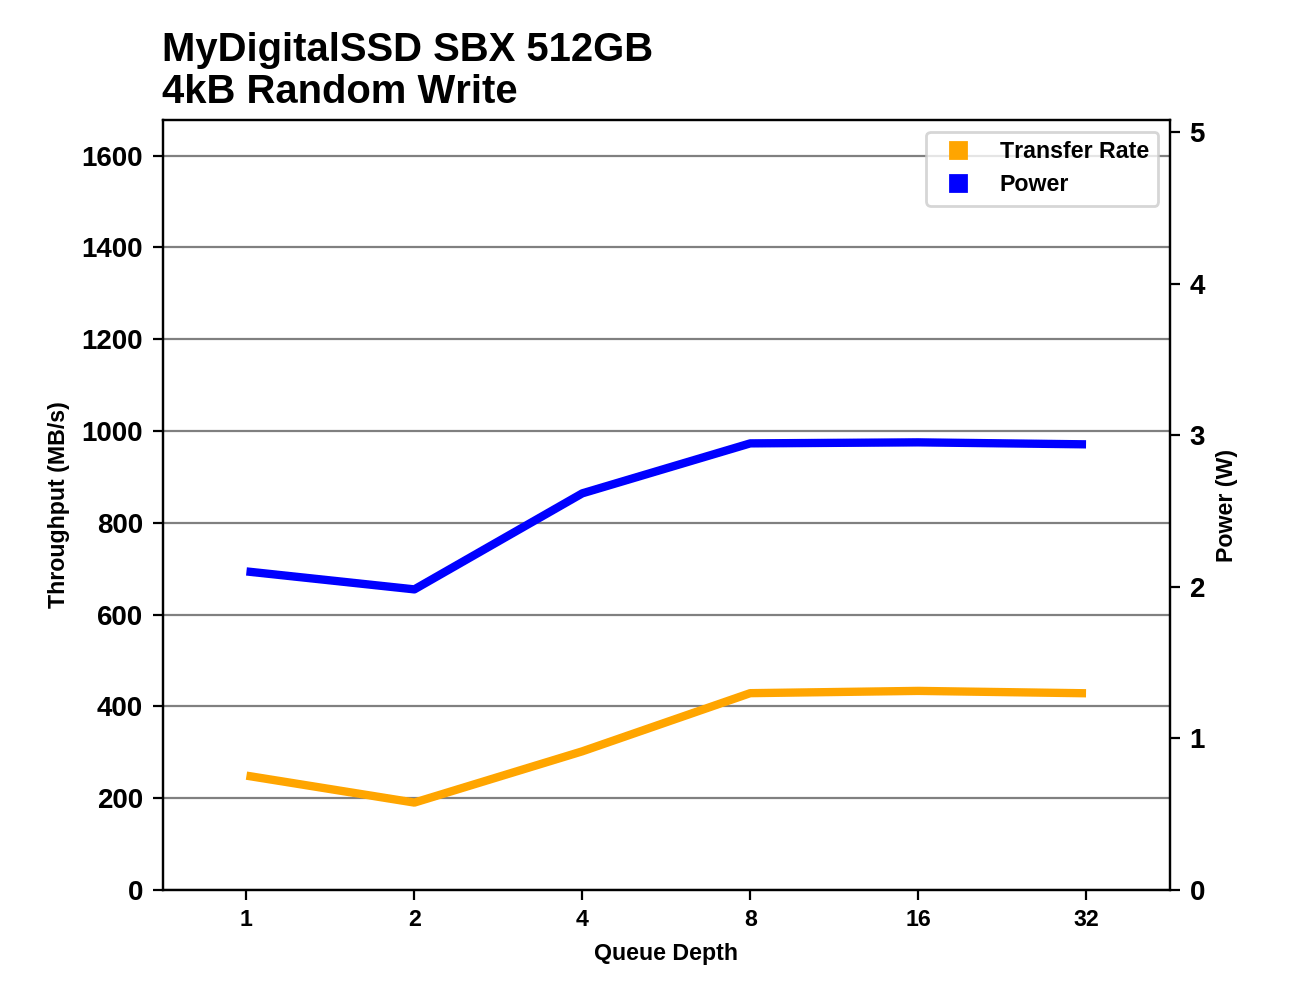
Performance from the SBX drops during the early phases of the random write test as the SLC write cache is quickly filled. Only the 512GB model manages to recover performance later at high queue depths, but its eventual limit is not far above the performance offered by SATA drives.
Sequential Read Performance
Our first test of sequential read performance uses short bursts of 128MB, issued as 128kB operations with no queuing. The test averages performance across eight bursts for a total of 1GB of data transferred from a drive containing 16GB of data. Between each burst the drive is given enough idle time to keep the overall duty cycle at 20%.
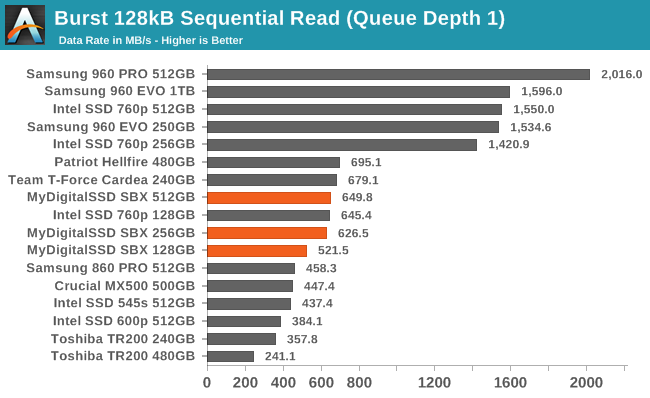
The burst sequential read speed of the MyDigitalSSD SBX is clearly faster than what SATA drives offer, but the Samsung drives and even the larger capacities of the Intel SSD 760p are in an entirely different league. The Phison E7 drives with planar MLC offer about the same performance as the SBX.
Our test of sustained sequential reads uses queue depths from 1 to 32, with the performance and power scores computed as the average of QD1, QD2 and QD4. Each queue depth is tested for up to one minute or 32GB transferred, from a drive containing 64GB of data.
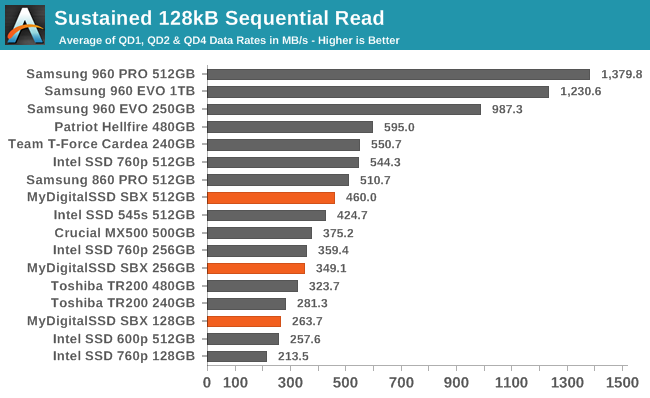
The flash is clearly much more of a bottleneck than the PCIe x2 interface on the longer sequential read test, where the internal fragmentation left over from the random write test prevents the SBX from delivering data any faster than the SATA SSDs. The Intel SSD 760p performs even worse at 128GB, but beats the SBX at 512GB.
 |
|||||||||
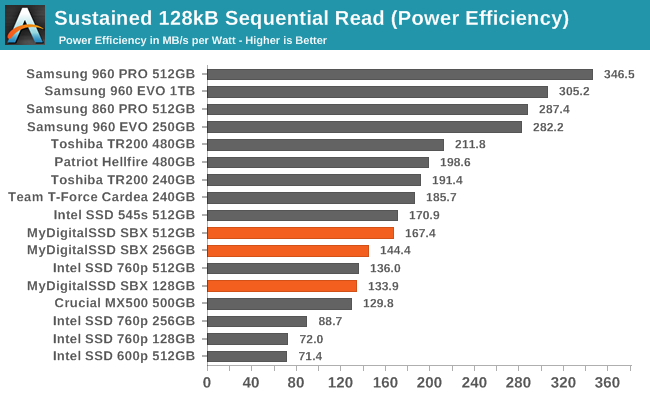
| Power Efficiency in MB/s/W | Average Power in W | ||||||||
Power efficiency continues to be a downside to the MyDigitalSSD SBX even though its power draw in absolute terms is substantially lower than the other NVMe drives. The Intel 760p is clearly worse off this time with much lower efficiency at every capacity, while Samsung's high-end drives are fast enough to offer efficiency as good or better than SATA drives.
 |
|||||||||
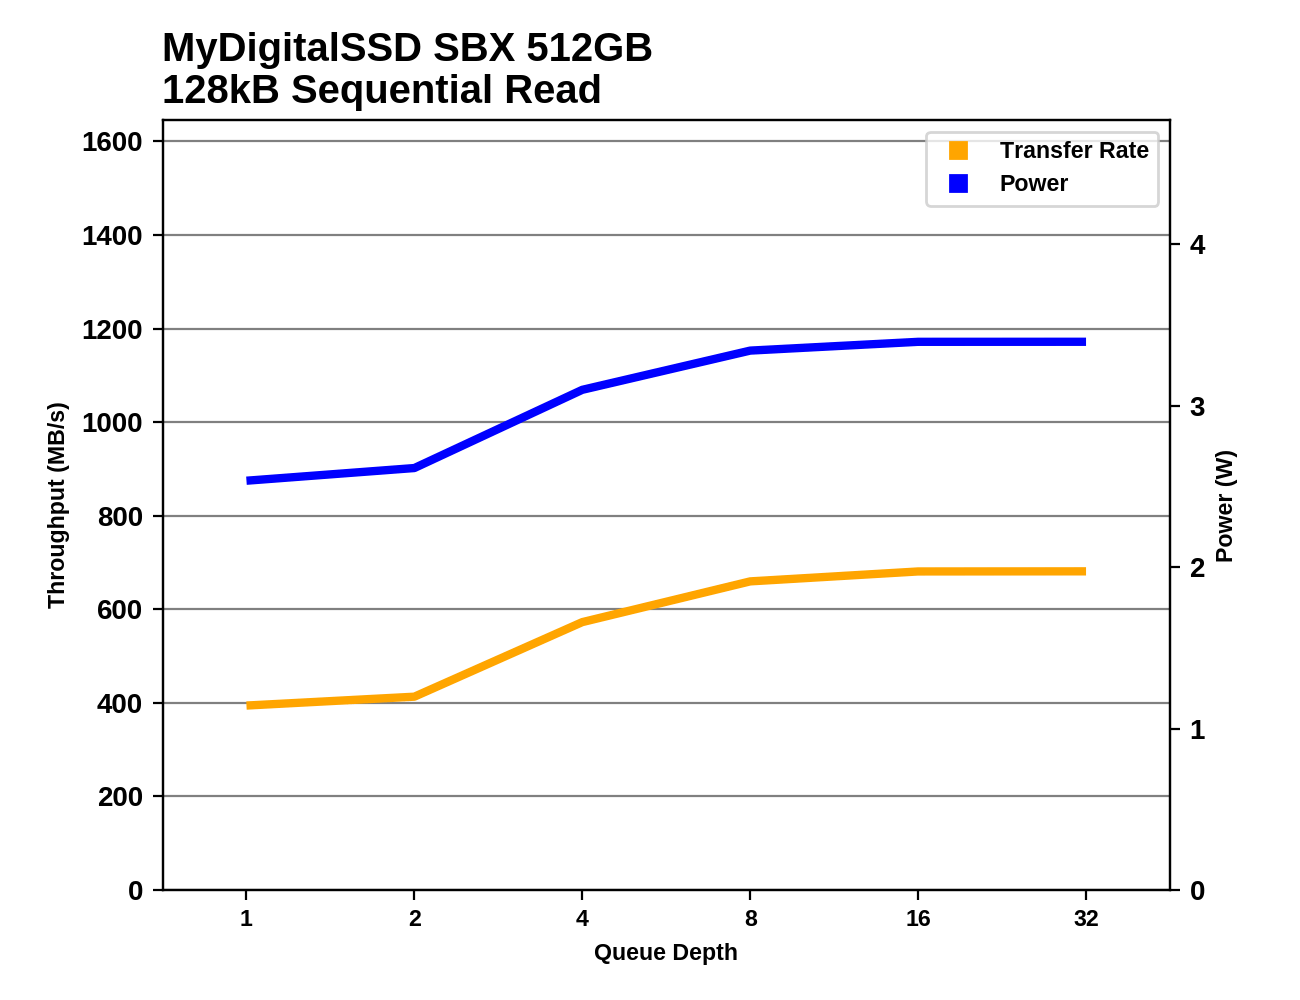
The sequential read performance of the SBX improves a bit between QD2 and QD8, allowing it to eventually surpass the Intel 760p that is generally better at QD1 but doesn't scale up with higher queue depths.
Sequential Write Performance
Our test of sequential write burst performance is structured identically to the sequential read burst performance test save for the direction of the data transfer. Each burst writes 128MB as 128kB operations issued at QD1, for a total of 1GB of data written to a drive containing 16GB of data.
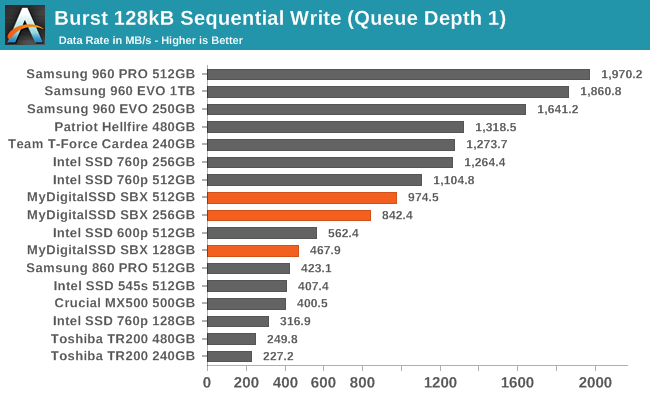
The burst sequential write speed of the MyDigitalSSD SBX exceeds that of SATA SSDs, though only barely in the case of the 128GB SBX. The 128GB Intel 760p fails to keep up with mainstream SATA drives, while the larger capacities have a clear lead over the SBX.
Our test of sustained sequential writes is structured identically to our sustained sequential read test, save for the direction of the data transfers. Queue depths range from 1 to 32 and each queue depth is tested for up to one minute or 32GB, followed by up to one minute of idle time for the drive to cool off and perform garbage collection. The test is confined to a 64GB span of the drive.
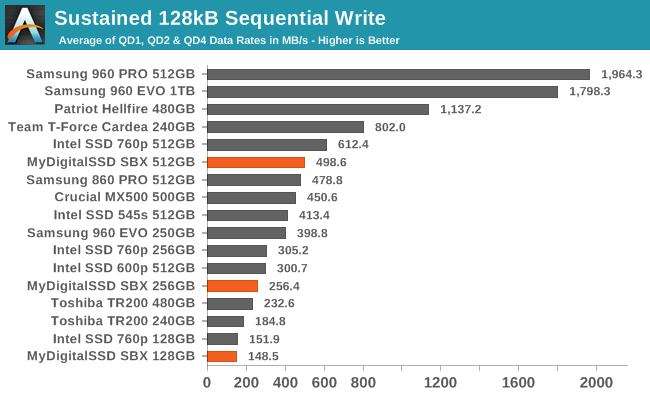
On the longer sequential write test, only the 512GB SBX is able to stay ahead of mainstream SATA SSDs. The Intel 760p has a minimal performance lead over the SBX at 128GB, growing to a 22% advantage at 512GB.
 |
|||||||||
| Power Efficiency in MB/s/W | Average Power in W | ||||||||
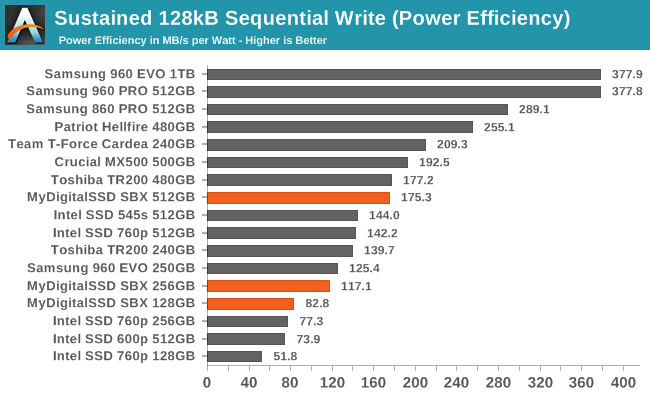
The MyDitigalSSD SBX's power efficiency during sequential writes is better than Intel's drives, but not much else. The SBX is paying the power cost of PCIe (albeit only two lanes) but delivering SATA performance.
 |
|||||||||
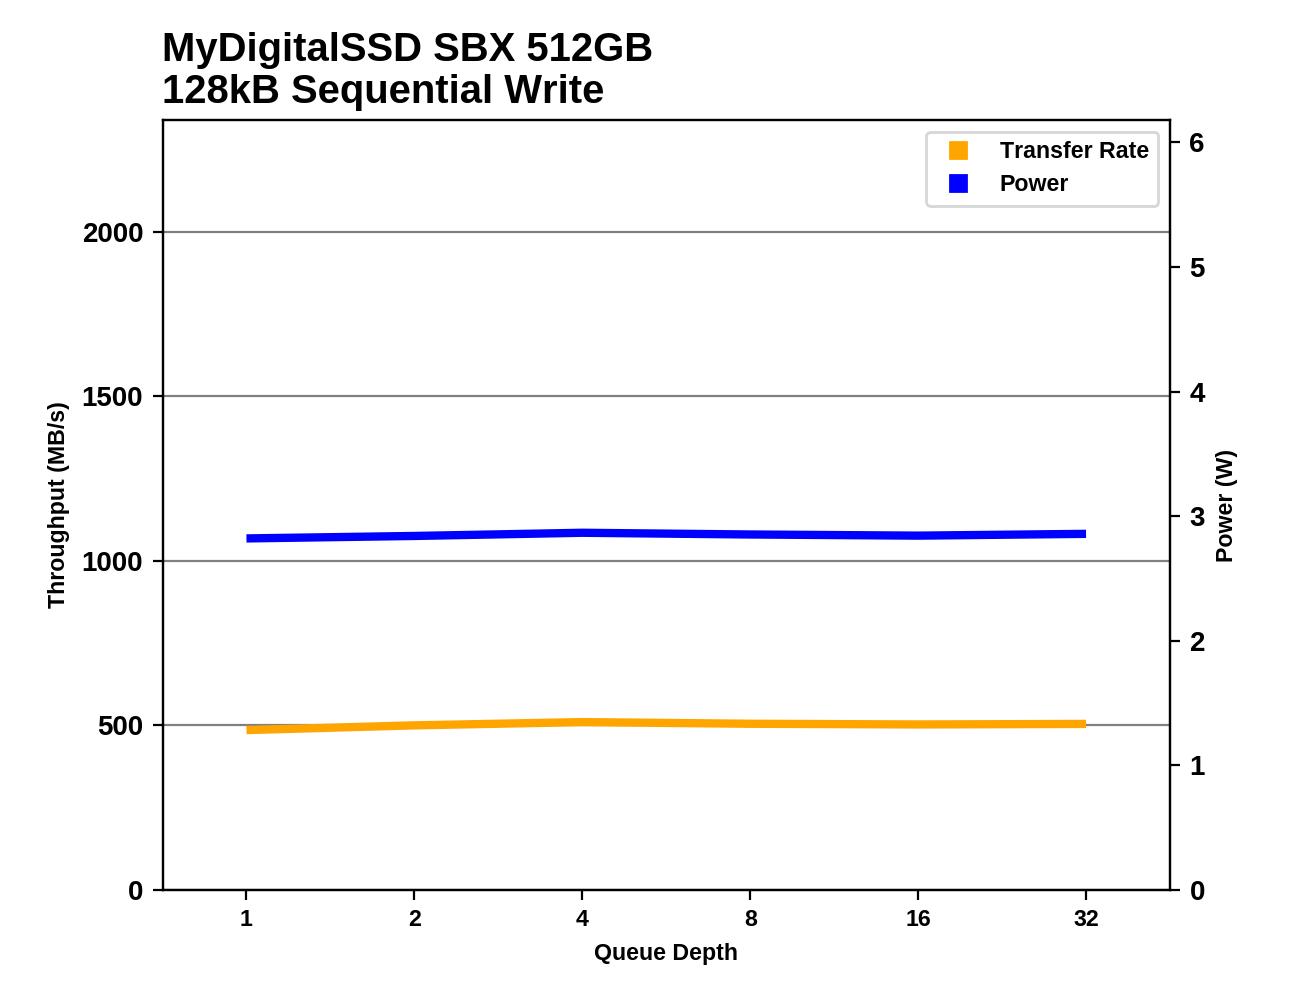
The MyDigitalSSD SBX delivers essentially the same sequential write performance at all tested queue depths, and power usage is also flat. The results from the SBX are most comparable to mainstream SATA drives, while the high-end NVMe drives are generally much faster and more power hungry.
Mixed Random Performance
Our test of mixed random reads and writes covers mixes varying from pure reads to pure writes at 10% increments. Each mix is tested for up to 1 minute or 32GB of data transferred. The test is conducted with a queue depth of 4, and is limited to a 64GB span of the drive. In between each mix, the drive is given idle time of up to one minute so that the overall duty cycle is 50%.
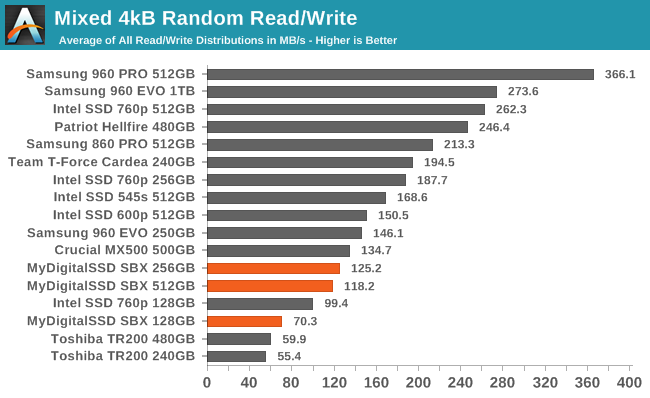
The mixed random I/O performance of the MyDigitalSSD SBX is worse than mainstream SATA drives and all of the NVMe competition. The 512GB SBX even manages to be a bit slower than the 256GB model.
 |
|||||||||
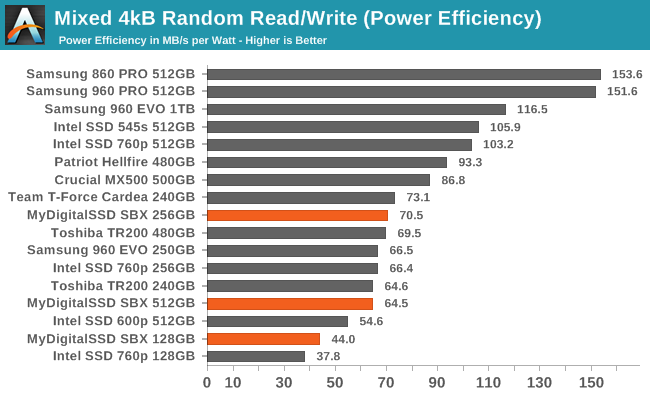
| Power Efficiency in MB/s/W | Average Power in W | ||||||||
Despite poor performance, the larger two capacities of the SBX have reasonable power efficiency on the mixed random I/O test, and the smallest is at least more efficient than the Intel 760p. Looking at power consumption in absolute terms, there is a clear gap between all of the PCIe x4 drives using at least 2.2W and the SBX topping out at 1.8W.
 |
|||||||||
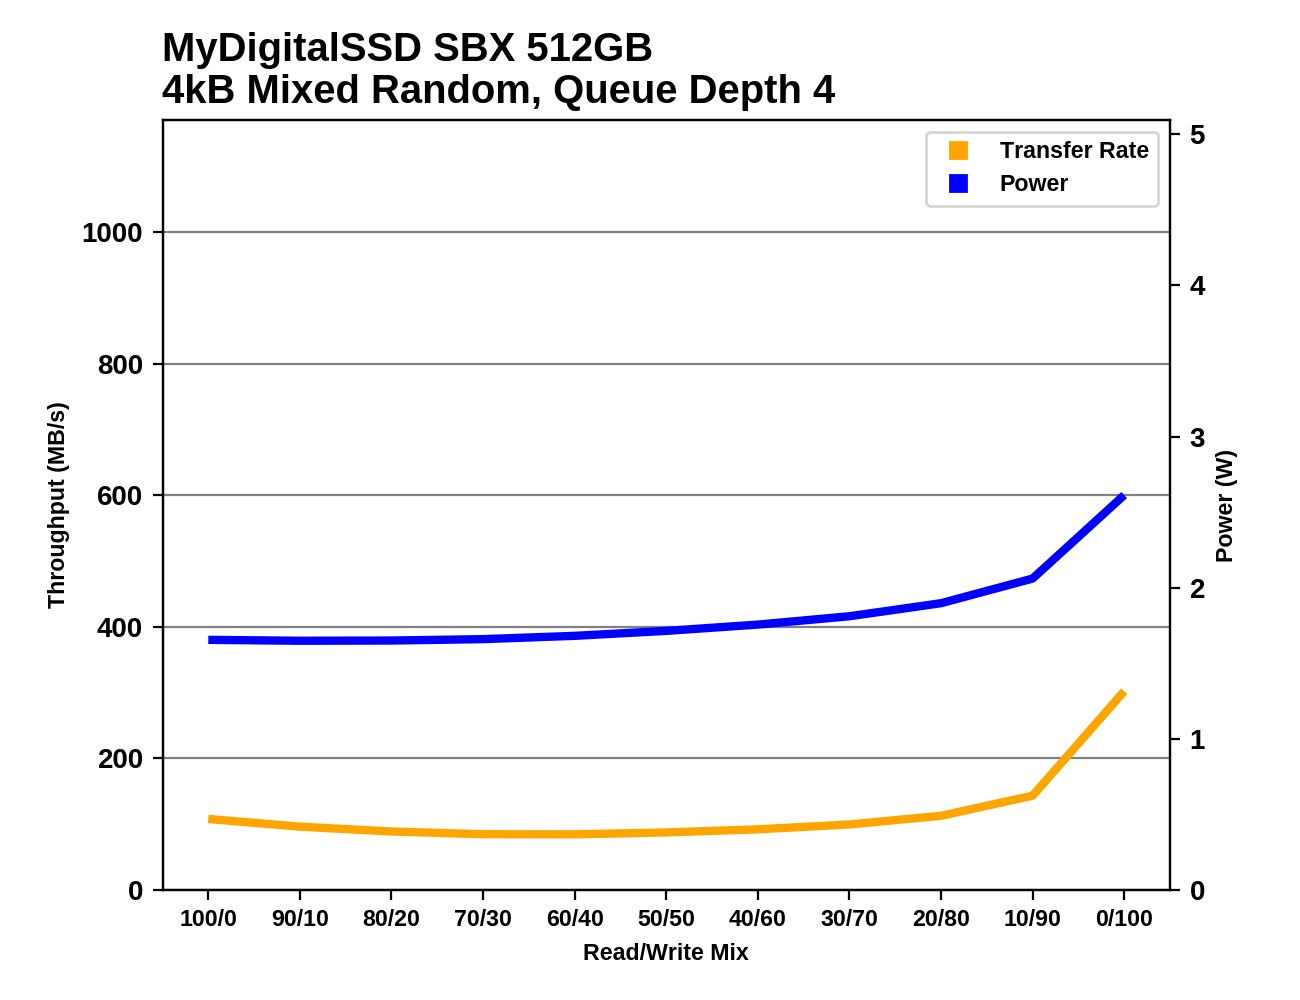
The shape of the performance curves for the SBX on the mixed random I/O test is typical: performance is low and mostly flat or slightly U-shaped for most of the test, then a clear increase in performance as the workload approaches pure random writes. That late boost in performance during the most write-heavy phases of the test is much smaller for the SBX than most high-end drives, and it isn't able to surpass the limits of SATA SSDs.
Mixed Sequential Performance
Our test of mixed sequential reads and writes differs from the mixed random I/O test by performing 128kB sequential accesses rather than 4kB accesses at random locations, and the sequential test is conducted at queue depth 1. The range of mixes tested is the same, and the timing and limits on data transfers are also the same as above.
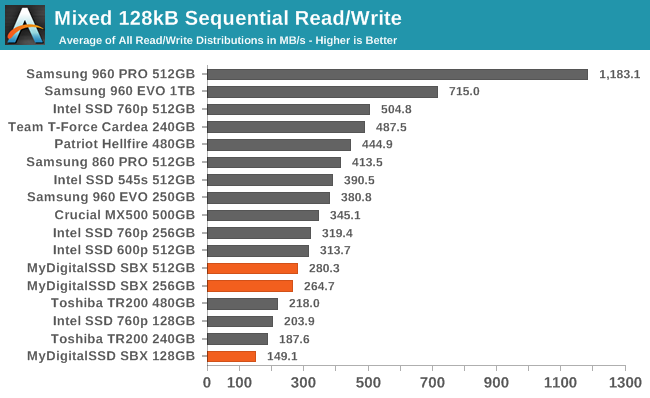
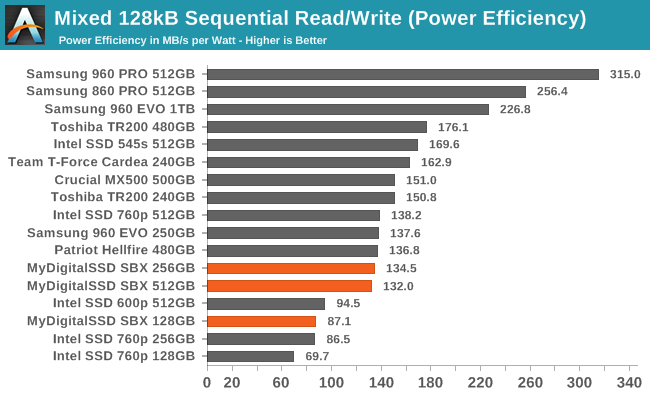
As with the mixed random I/O test, the performance results for the mixed sequential test put the MyDigitalSSD SBX below the current crop of mainstream SSDs and below all the other NVMe SSDs in this comparison—though the latter result is more or less expected. It's disappointing to see even the Intel 600p outperform the SBX.
 |
|||||||||
| Power Efficiency in MB/s/W | Average Power in W | ||||||||
The power efficiency from the MyDigitalSSD SBX is low, but only the 128GB model stands out as being well below average, and it is at least joined at the bottom of the charts by several Intel drives. As usual, the absolute power draw of the SBX is more typical for a SATA drive than a NVMe drive.
 |
|||||||||
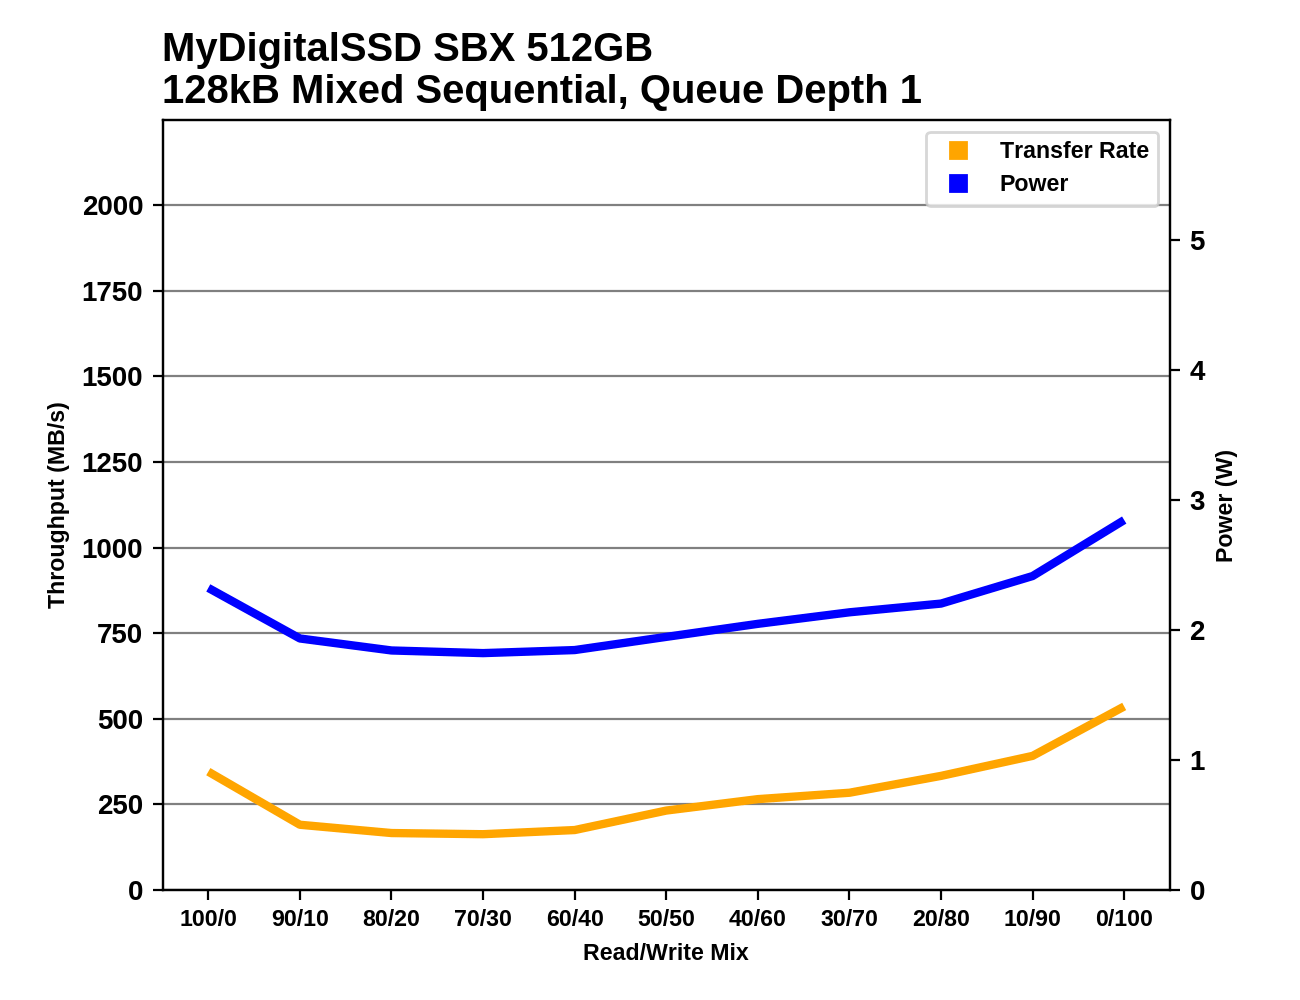
The performance of the MyDigitalSSD SBX drops during the early phases of the test, reaching a minimum with a relatively read-heavy workload before recovering slightly. In the second half of the test as the workload is more write-heavy, the 512GB SBX picks up speed but the 256GB and 128GB models stay at a roughly constant performance level. The 128GB then drops again in the final phase of the test with a pure write workload.
Power Management Features
Real-world client storage workloads leave SSDs idle most of the time, so the active power measurements presented earlier in this review only account for a small part of what determines a drive's suitability for battery-powered use. Especially under light use, the power efficiency of a SSD is determined mostly be how well it can save power when idle.
For many NVMe SSDs, the closely related matter of thermal management can also be important. M.2 SSDs can concentrate a lot of power in a very small space. They may also be used in locations with high ambient temperatures and poor cooling, such as tucked under a GPU on a desktop motherboard, or in a poorly-ventilated notebook.
| MyDigitalSSD SBX NVMe Power and Thermal Management Features |
|||
| Controller | Phison PS5008-E8 | ||
| Firmware | E8FM11.4 | ||
| NVMe Version |
Feature | Status | |
| 1.0 | Number of operational (active) power states | 3 | |
| 1.1 | Number of non-operational (idle) power states | 2 | |
| Autonomous Power State Transition (APST) | Supported | ||
| 1.2 | Warning Temperature | 81°C | |
| Critical Temperature | 85°C | ||
| 1.3 | Host Controlled Thermal Management | Not Supported | |
| Non-Operational Power State Permissive Mode | Not Supported | ||
The E8 controller supports two idle power states, implemented as NVMe Power States 3 and 4 (power states 0, 1 and 2 are operational states with successively lower power limits). The firmware version E8FM11.4 used by the MyDigitalSSD SBX doesn't use power state 4 when the NVMe Autonomous Power State Transition (APST) feature is enabled, which is what most systems in the real world rely on for NVMe power management. The drives can be put into PS4 when APST is disabled and the OS manually manages the drive's power states. The relatively new power and thermal management features from the version 1.3 NVMe spec are not implemented.
| MyDigitalSSD SBX NVMe Power States |
|||||
| Controller | Phison PS5008-E8 | ||||
| Firmware | E8FM11.4 | ||||
| Power State |
Maximum Power |
Active/Idle | Entry Latency |
Exit Latency |
|
| PS 0 | 3 W | Active | - | - | |
| PS 1 | 2 W | Active | - | - | |
| PS 2 | 1 W | Active | - | - | |
| PS 3 | 0.1 W | Idle | 1 ms | 1 ms | |
| PS 4* | 0.005 W | Idle | 400 ms | 90 ms | |
(PS4 not usable by APST with current firmware)
Note that the above tables reflect only the information provided by the drive to the OS. The power and transition latency numbers are often very conservative estimates, but they are what the OS uses to determine which idle states to use and how long to wait before dropping to a deeper idle state.
Idle Power Measurement
SATA SSDs are tested with SATA link power management disabled to measure their active idle power draw, and with it enabled for the deeper idle power consumption score and the idle wake-up latency test. Our testbed, like any ordinary desktop system, cannot trigger the deepest DevSleep idle state.
Idle power management for NVMe SSDs is far more complicated than for SATA SSDs. NVMe SSDs can support several different idle power states, and through the Autonomous Power State Transition (APST) feature the operating system can set a drive's policy for when to drop down to a lower power state. There is typically a tradeoff in that lower-power states take longer to enter and wake up from, so the choice about what power states to use may differ for desktop and notebooks.
We report two idle power measurements. Active idle is representative of a typical desktop, where none of the advanced PCIe link or NVMe power saving features are enabled and the drive is immediately ready to process new commands. The idle power consumption metric is measured with PCIe Active State Power Management L1.2 state enabled and NVMe APST enabled if supported.
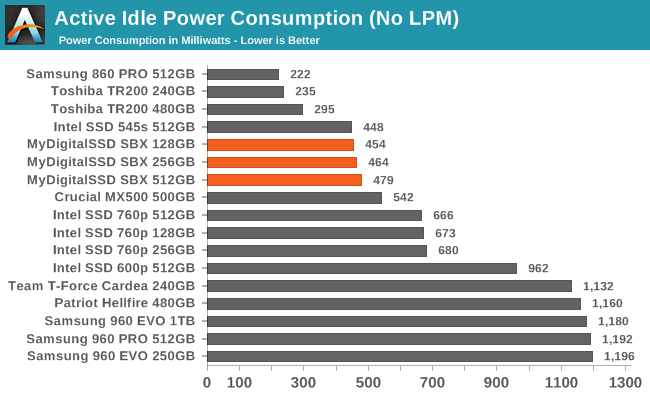
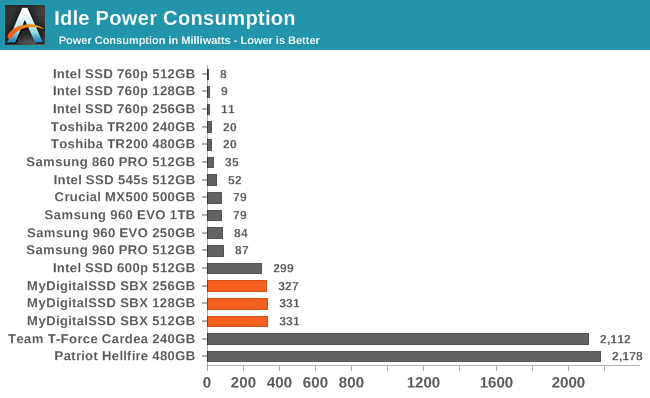
The active idle power draw of the MyDigitalSSD SBX is pretty good for a NVMe drive and on par with many mainstream SATA SSDs. The situation when PCIe ASPM and NVMe APST are enabled isn't great, but at least the Phison controllers are no longer freaking out and paradoxically increasing power consumption. The power savings we observed seem to come mostly from PCIe ASPM, and it makes little difference whether the drive is asked to use APST or not. The drive doesn't stay within its own declared limit of 100mW for PS3.
Also important to the E8 platform's overall idle power consumption is how background processing is handled. When idle, the drive will periodically wake up to perform background processing such as garbage collection. For the first few minutes after the drive is powered on, the interval between those wake-ups is 0.8 seconds, then the drive slows to waking up once every 5 seconds. These wake-ups continue whether or not the drive has background garbage collection or SLC cache flushing to do. Since the drive's power spikes to just over 1W during these active periods and they last for about 200ms each, this increases the overall idle power draw by more than 20%.
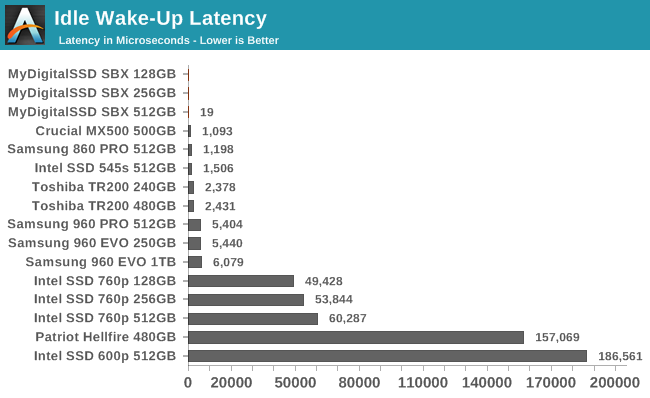
The idle wake-up latency test shows no significant difference in performance for the SBX between having all the power management features enabled or disabled—sometimes the measurements are faster with power management enabled, but still within the margin of error, so we're showing the latency as just zero in those cases. It is clear that no deep power saving measures are being taken within the SSD in this configuration, so there is nothing that would impose a significant wake-up delay.
Conclusion
The MyDigitalSSD SBX sits at the bottom of the NVMe SSD market, with prices that have closed the gap between SATA and NVMe SSDs. The SBX isn't quite cheap enough to be competing head-to-head against mainstream SATA SSDs, so the SBX still needs to offer compelling advantages over those SATA drives. Against other NVMe SSDs, the SBX seldom comes out ahead on performance comparisons, but it has the advantage of significantly lower prices and power consumption.
The main selling point for the SBX over SATA drives is performance. Mid-range and high-end SATA drives offer nearly identical real-world performance thanks to the limitations of the SATA interface. The PCIe x2 interface used by the MyDigitalSSD SBX is half as wide as that used by most NVMe SSDs, but still gives the SBX plenty of room to outperform SATA SSDs. The SBX doesn't always use all of that interface bandwidth, but it does manage to deliver real-world performance that exceeds SATA SSDs. For most users looking to step up from a mainstream SATA drive, the added performance the SBX brings will be much more useful than the added endurance of a similarly-priced premium MLC-based SATA SSD.
Because the MyDigitalSSD SBX is a low-end drive (within its NVMe market), it makes some sacrifices compared to most NVMe SSDs. The SBX is clearly optimized for peak performance on common client/consumer workloads. When subjected to particularly harsh workloads or the difficult operating conditions of a nearly-full drive, the performance of the SBX drops substantially. Previous budget-oriented SSDs like the Intel SSD 600p and the first-generation WD Black SSD have been similarly afflicted, but unlike those drives the MyDigitalSSD SBX manages to keep its performance at or above the level of mainstream SATA SSDs even on our harder tests.
With an emphasis on low price, it's no surprise to see the SBX product line including smaller capacities that many high-end NVMe SSDs have dropped. The MyDigitalSSD SBX is not able to avoid the performance hit that especially small SSDs suffer as a result of having fewer NAND flash devices to use in parallel. The 128GB SBX performs very differently from the 512GB SBX, but each is still a step up from SATA drives of similar capacity. The smallest capacities of the SBX also don't seem to be as acutely limited as the smallest Intel SSD 760p drives, which tend to offer better worst-case performance than the SBX at the cost of lower peak performance for common workloads.
Aside from pricing, the most significant and consistent disadvantage NVMe drives have compared to SATA drives is with power consumption: efficiency needs to be sacrificed in order to deliver the highest performance. The MyDigitalSSD SBX is without question the lowest-power NVMe SSD we have tested, but its low performance means that it doesn't provide any real improvements to power efficiency. The low power draw of the SBX means that it is no more susceptible to overheating than SATA drives, but the SBX won't give you the same battery life that a good SATA drive will.
This is especially true when taking into account the difficulties with NVMe power management. Phison-based drives are far from the only NVMe SSDs that have severe power management issues, but the earlier Phison E7 controller platform produced some of the most embarrassing power management quirks we've seen. The Phison E8 controller used by the SBX is a clear improvement, but the firmware still needs work. As tested and currently shipping, the SBX cannot use its deepest idle power state and cannot stay in its intermediate sleep state for more than a few seconds without waking back up. The MyDigitalSSD SBX is a poor choice for battery-powered systems, but this may be fixable with a firmware update.
| NVMe SSD Price Comparison | ||||
| 120-128GB | 240-256GB | 400-512GB | 960-1200GB | |
| MyDigitalSSD SBX | $52.99 (41¢/GB) | $84.99 (33¢/GB) | $157.99 (31¢/GB) | $309.99 (30¢/GB) |
| Intel SSD 600p | $84.78 (66¢/GB) | $151.00 (59¢/GB) | $199.00 (39¢/GB) | |
| Intel SSD 760p | $79.99 (62¢/GB) | $118.99 (46¢/GB) | $199.99 (39¢/GB) | $442.30 (43¢/GB) |
| Samsung 960 EVO | $119.95 (48¢/GB) | $199.99 (40¢/GB) | $449.99 (45¢/GB) | |
| ADATA SX6000 | $47.99 (37¢/GB) | $74.99 (29¢/GB) | $139.99 (27¢/GB) | |
| ADATA SX7000 | $54.99 (43¢/GB) | $129.99 (51¢/GB) | $154.95 (30¢/GB) | |
| SATA SSDs: | ||||
| Crucial BX300 | $42.99 (36¢/GB) | $87.99 (37¢/GB) | $144.99 (30¢/GB) | |
| Crucial MX500 | $69.99 (28¢/GB) | $114.99 (23¢/GB) | $249.99 (25¢/GB) | |
| Samsung 860 EVO | $79.99 (32¢/GB) | $139.99 (28¢/GB) | $279.99 (28¢/GB) | |
| Toshiba TR200 | $59.99 (25¢/GB) | $129.78 (27¢/GB) | $279.99 (29¢/GB) | |
ADATA is one of the only brands offering NVMe SSDs at anything close to the pricing of the MyDigitalSSD SBX. Their SX6000 is a bit cheaper than the SBX but uses a Realtek SSD controller. Realtek is relatively new to the SSD controller space and we have never tested one of their drives, so we cannot say much about its performance. The ADATA SX7000 uses the Silicon Motion SM2260 controller and first-generation Micron 32L 3D TLC, which make it similar to the Intel SSD 600p in design and performance. The MyDigitalSSD beats the ADATA SX7000 on performance and usually on price as well.
Above the SBX on the price scale are drives that are truly high-end, with much higher benchmark performance results but only marginally better real-world performance. These drives should only be considered by consumers with heavy storage workloads, those who need a NVMe SSD with better power management for a notebook, or those who simply want bragging rights.
The value proposition of mainstream SATA SSDs is still hard to argue against, especially as prices are finally in decline. For all that it may be low-end by NVMe standards, the MyDigitalSSD is still a more premium product than something like the Crucial MX500, and the SBX requires you to pay at least 20% more per GB for its added performance. NVMe drives are getting more affordable, but they aren't for everybody yet.


