Original Link: https://www.anandtech.com/show/15571/intel-nuc10i7fnh-frost-canyon-review
Intel NUC10i7FNH Frost Canyon Review: Hexa-Core NUC Delivers a Mixed Bag
by Ganesh T S on March 2, 2020 9:00 AM EST
Small form-factor (SFF) PCs and gaming systems have represented the bulk of the growing segment in the PC market over the last few years. Intel's NUC line-up has enjoyed unprecedented success, prompting the company to branch off the NUC family to target a variety of market segments and price points. Continuing that momentum, in November 2019, Intel announced the NUC10 series in their line of mainstream ultra-compact form-factor (UCFF) systems, bumping up their NUCs to using the company's latest Comet Lake processors.
More recently, Intel finally began sampling the systems for review, sending us the NUC10i7FNHAA - an Intel NUC10 Mini-PC with Windows 10. The system sports a 256GB NVMe SSD and a 1TB 2.5" hard drive along with a pre-installed copy of Windows 10 Home x64. Traditionally, most SFF PCs we evaluate sport a single storage device, so the inclusion of hybrid storage is stil a bit of an unsteady eara for vendors who are not Apple. In fact, it's so uncommon that this is the first hybrid storage system to cross my desk; Intel's latest NUC doesn't really have any peers as far as any other reviewed systems are concerned.
To that end, we've decided to simplify things a bit for Frost Canyon and take out the 2.5" HDD – essentially reducing it to the barebones version of this NUC, the NUC10i7FNH. This makes for better apples-to-apples comparisons, and in particular avoids the power and performance drag from having rotating rust in the storage mix.
So how does Intel's first Comet Lake NUC fare? Let's find out.
Introduction and Platform Analysis
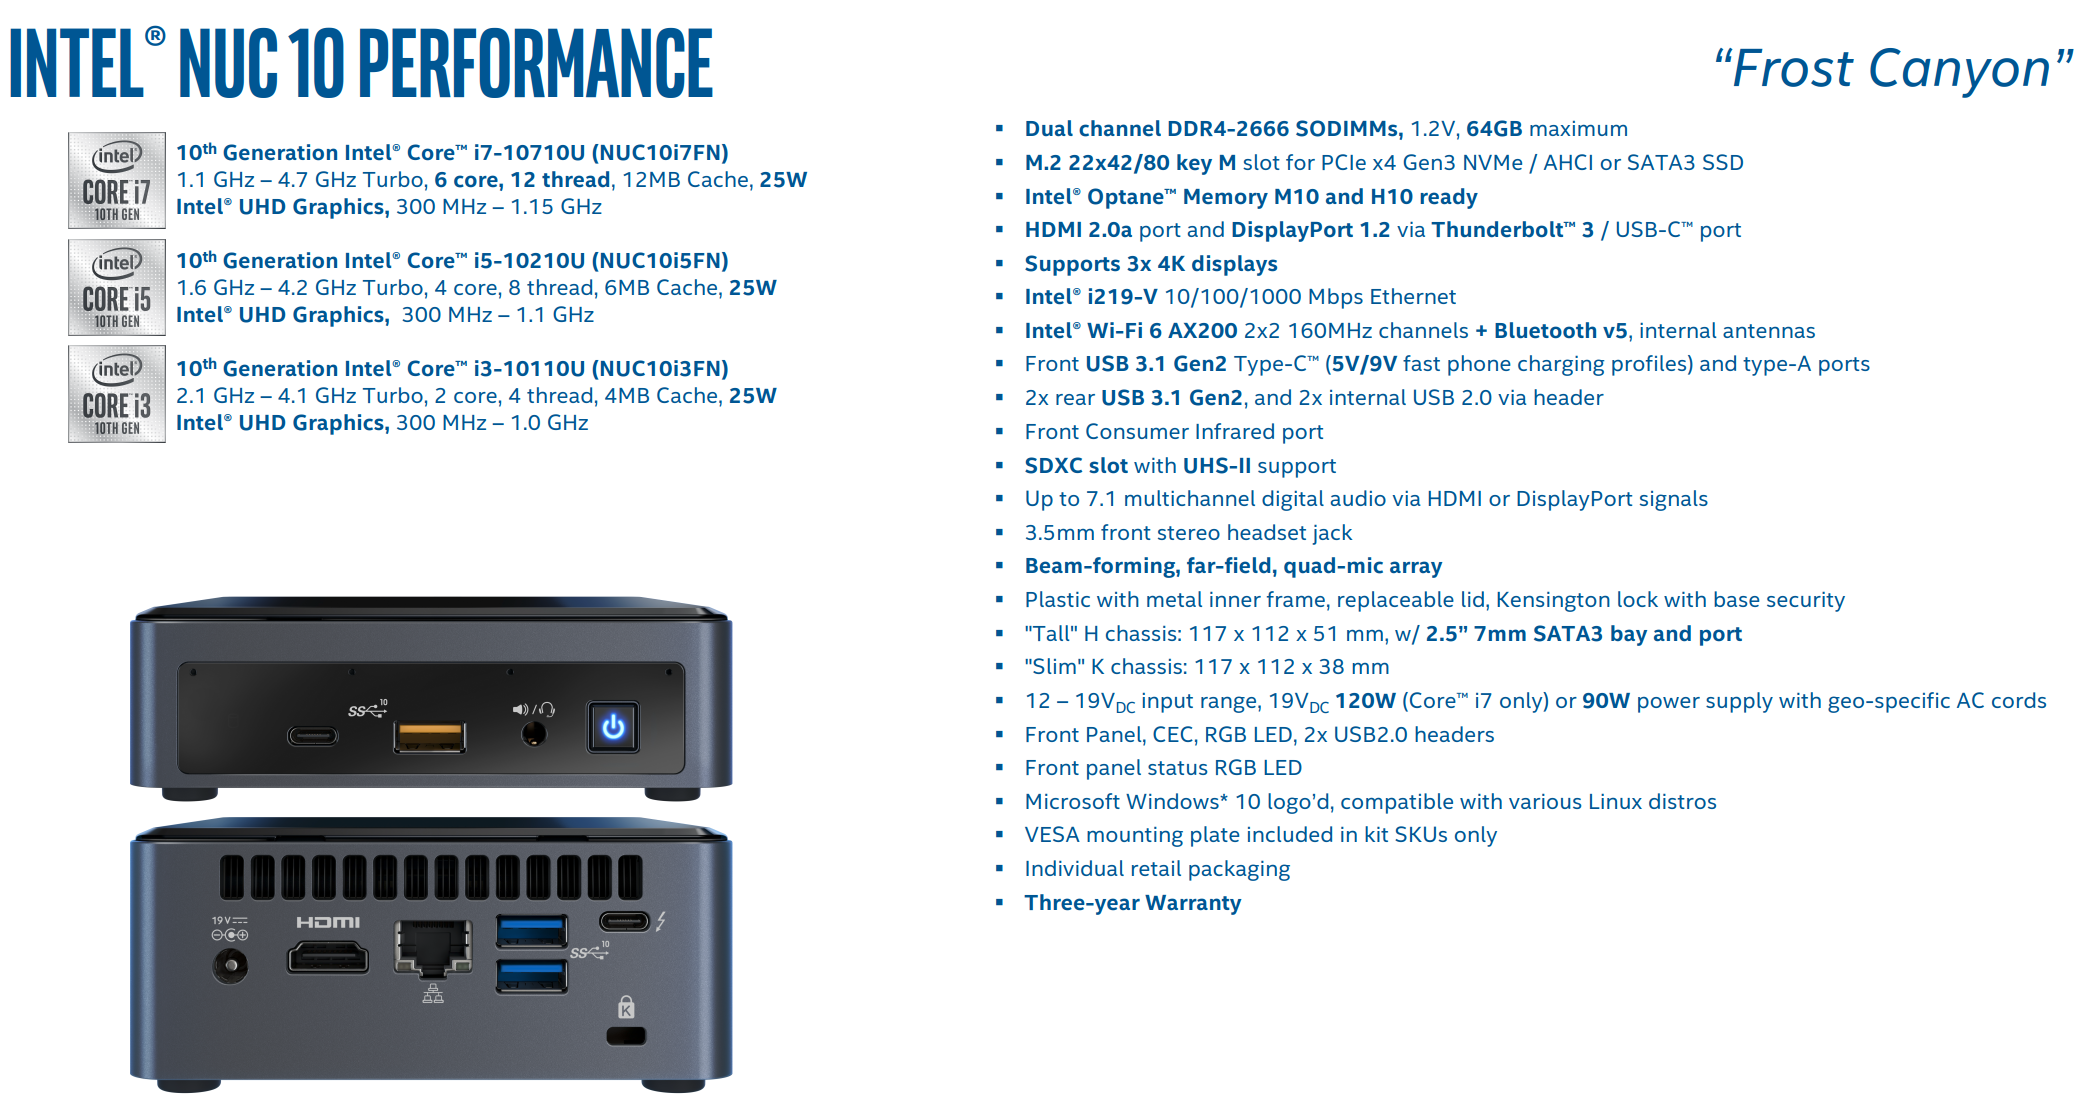
The NUC10i7FNH is Intel's mainstream HDD-kit NUC with a 100mm x 100mm main-board housed in a 117 x 112 x 51mm chassis. The board comes with a soldered processor - the Core i7-10710U. This belongs to the Comet Lake-U family, and is the first U-series processor with 6 cores and hyper-threading enabled. Thanks to Intel's use of cTDP-up, the TDP of the processor is nominally at 25W, though the default BIOS settings set the PL1 (sustained) and PL2 (burst mode) levels to 30W and 64W respectively. Meanwhile the PL1 Time Window is set to 28 seconds by default.
Switching to peripherals and networking, the board's WLAN component is also soldered - the Wi-Fi 6 AX201 enables the NUC10 family to be the first UCFF PC from Intel to come with Wi-Fi 6 / 802.11ax support. As for storage, for the barebones version end-users have the flexibility to choose their own storage device and RAM. For best performance, a PCIe 3.0 x4 NVMe SSD can be used, and DDR4-2666 SODIMMs are supported. The system also comes with a host of value-additions such as a quad-microphone array in the front panel, and an infrared receiver (strangely disabled by default in the BIOS).
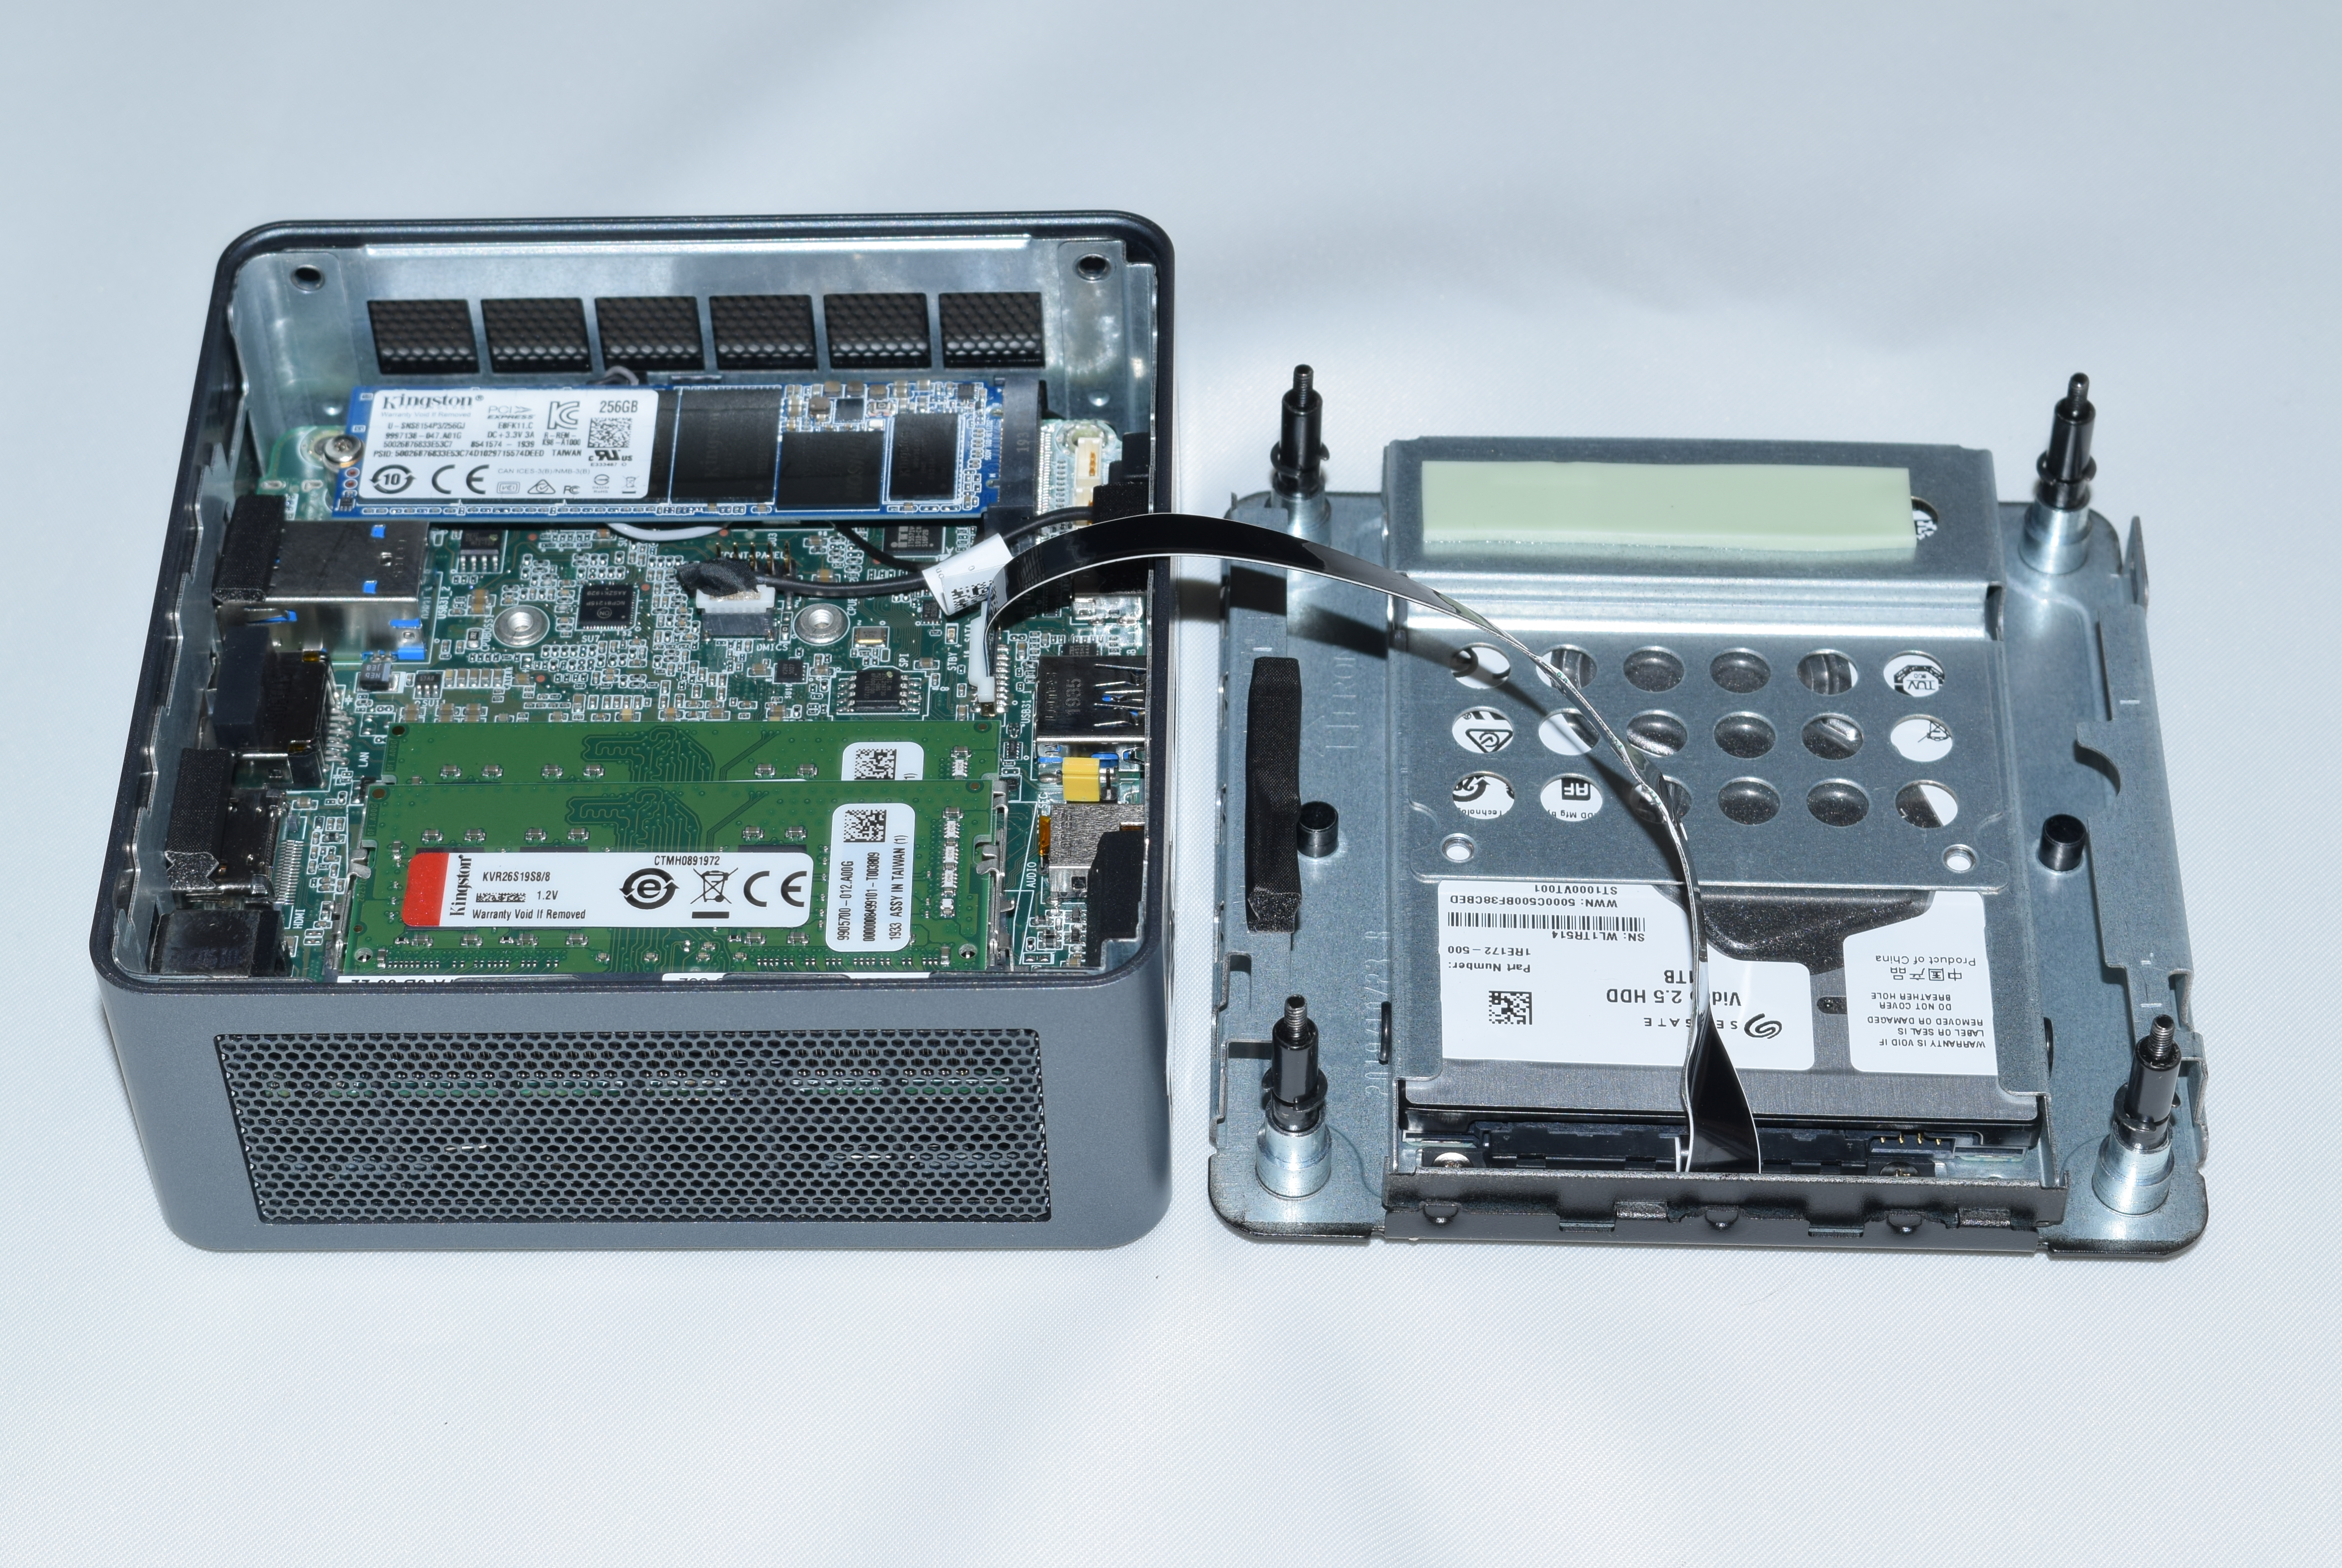
Our NUC10i7FNHAA sample came with the following components pre-installed:
- Kingston Design-In SSD U-SNS8154P3/256GJ (essentially an OEM version of the Kingston A1000) PCIe 3.0 x2 NVMe SSD
- 2x Kingston ValueRAM KVR26S19S8/8 DDR4 SODIMM for 16GB of DRAM
- Seagate ST1000VT001 1TB 5400RPM 2.5" Video HDD
The hard drive is connected to the board using a slender ribbon cable that can be easily slotted in and out, as shown in the picture below. Our evaluation was processed with the hard drive disconnected completely from the board.
The specifications of our Intel NUC10i7FNH review configuration are summarized in the table below.
| Intel NUC10i7FNH (Frost Canyon) Specifications | |
| Processor | Intel Core i7-10710U Comet Lake-U, 6C/12T, 1.1 (4.7) GHz 12MB L2+L3, 14nm (optimized), 25W TDP |
| Memory | Kingston ValueRAM KVR26S19S8/8 DDR4 SODIMM 19-19-19-43 @ 2666 MHz 2x8 GB |
| Graphics | Intel UHD Graphics |
| Disk Drive(s) | Kingston Design-In SSD U-SNS8154P3/256GJ (256 GB; M.2 Type 2280 PCIe 3.0 x2 NVMe; Toshiba 64L 3D TLC) (Phison E8-based, similar to the Kingston A1000) |
| Networking | Intel Wi-Fi 6 AX201 (2x2 802.11ax - 2400 Mbps) 1x Intel I219-V Gigabit Ethernet Controller |
| Audio | 3.5mm Headphone Jack Capable of 5.1/7.1 digital output with HD audio bitstreaming (HDMI) |
| Miscellaneous I/O Ports | 2x USB 3.2 Gen 2 (10 Gbps) Type-A (rear) 1x Thunderbolt 3 Type-C (rear) 1x USB 3.2 Gen 2 (10 Gbps) Type-A (front) 1x USB 3.2 Gen 2 (10 Gbps) Type-C (front) 1x SDXC (side) |
| Operating System | Retail unit is barebones, but we installed Windows 10 Enterprise x64 NUC10i7FNHAA comes with Windows 10 Home x64 pre-installed |
| Pricing (As configured) | $605 (barebones) $752 (as configured) $940 (NUC10i7FNHAA Bundle with 16GB RAM, 1TB HDD, 256GB SSD, and Windows 10 Home x64) |
| Full Specifications | Intel Frost Canyon NUC Kit - NUC10i7FNH Specifications Intel Frost Canyon NUC Mini-PC - NUC10i7FNHAA Specifications |
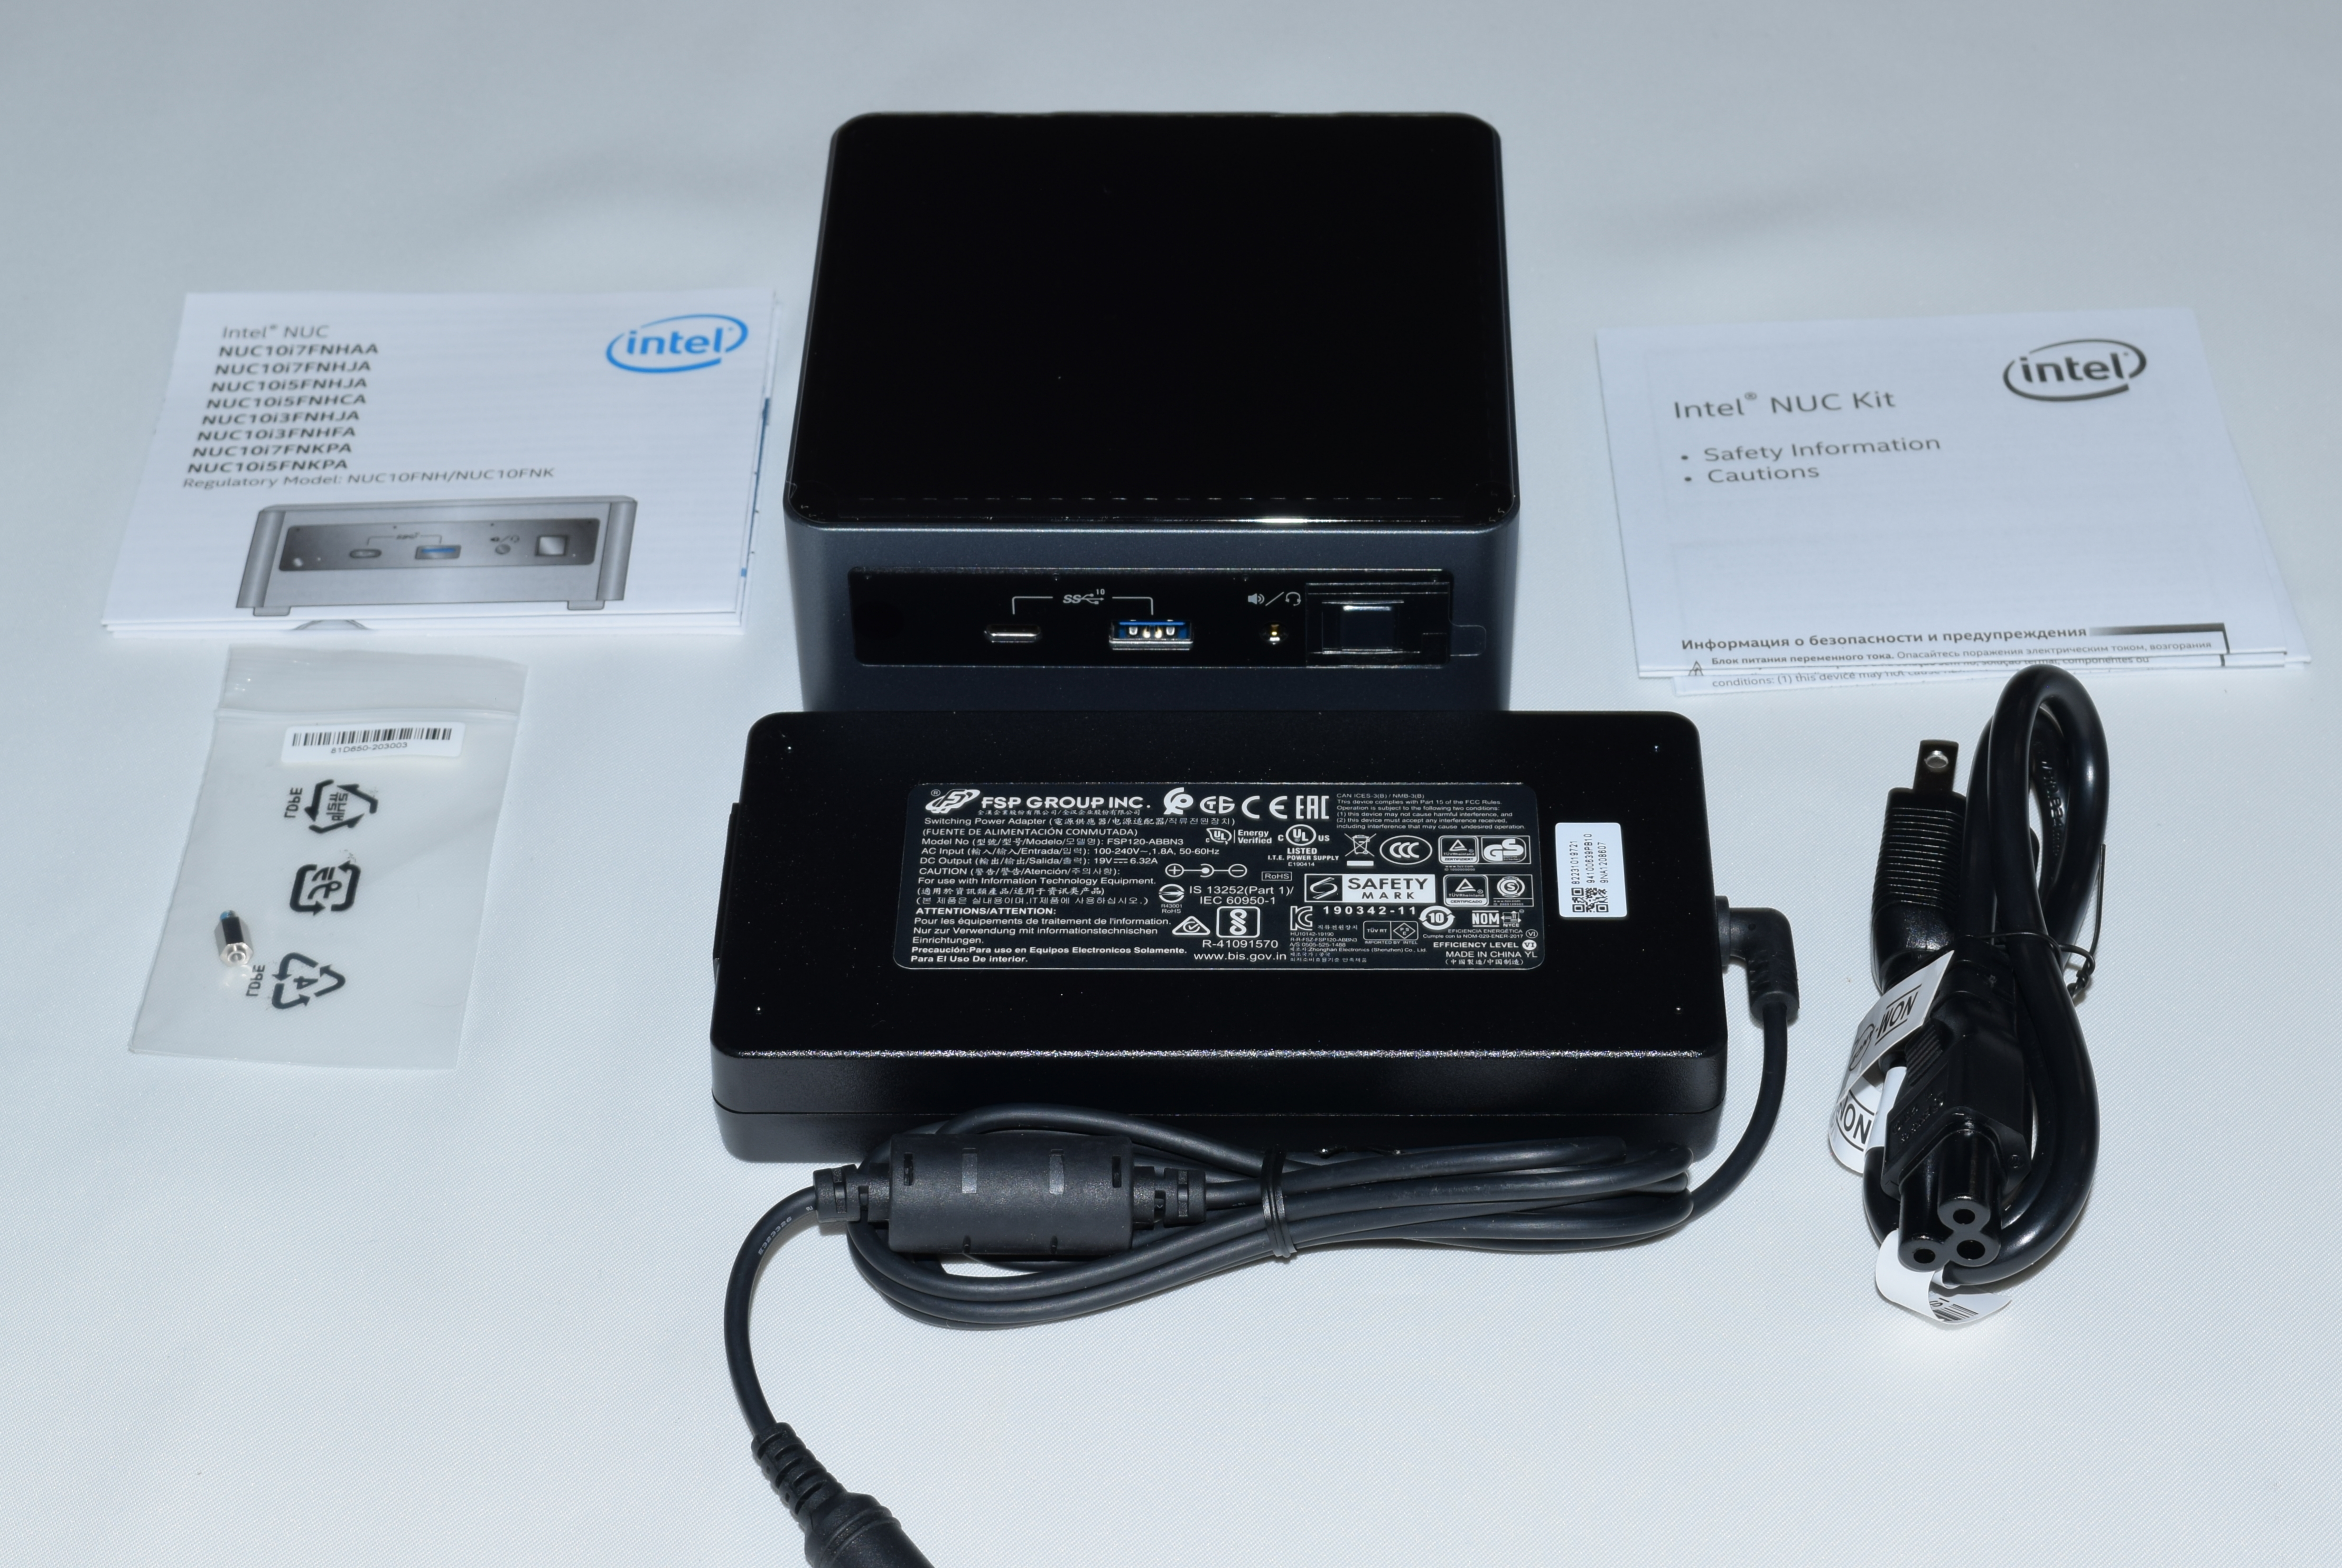
The contents of the package include a 120W power adapter, and an additional screw for a M.2 SSD. Since the 2.5" drive comes pre-installed, the ribbon cable for the SATA data and power is already inside the system. Other components of the package include a US power cord, safety information, and a product manual.
The Visual BIOS has undergone a major re-design for the NUC10 series. While the core functionality has obviously not changed, the screens are more streamlined - a vertical organization of the various options compared to a horizontal-heavy layout in the BIOS for the older models. A new set of value-added features include the ability to configure a RAM disk in the BIOS, mount iSCSI volumes prior to boot, and set up various network interface characteristics. Given that these are the first NUCs to support up to 64GB of DRAM, the ability to configure RAM disks is welcome.


The block diagram of the components on the board are presented in the diagram below.
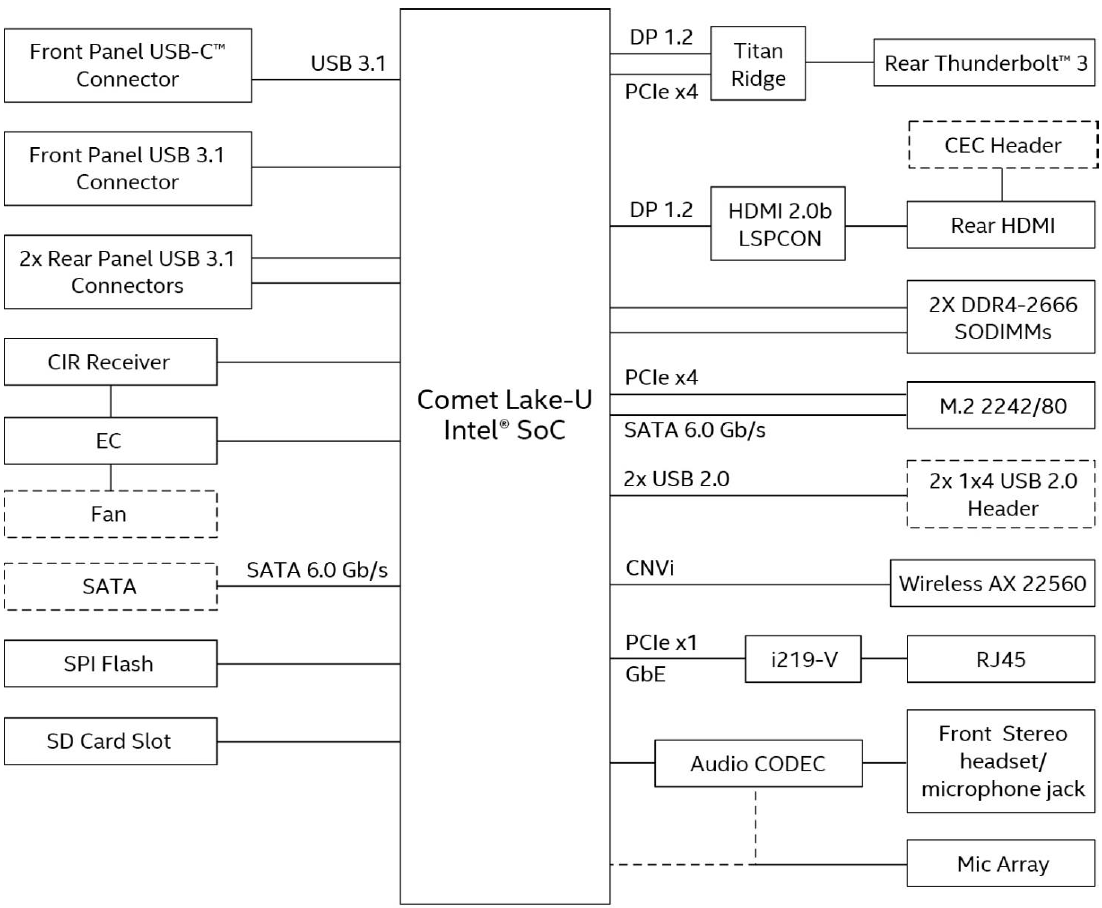
The AIDA64 system report provides a breakdown of the usage of the PCIe lanes and confirms the above block diagram:
- PCIe 3.0 x4 port #5 In Use @ x4 (Intel Titan Ridge Thunderbolt 3 Controller)
- PCIe 3.0 x4 port #9 In Use @ x2 (Phison PS5008 PCIe 3.0 x2 NVMe 1.2 SSD Controller)
- PCIe 3.0 x1 port #14 In Use @ x1 (Genesys Logic PCI-E Card Reader)
In the table below, we have an overview of the various systems that we are comparing the Intel NUC10i7FNH against. Note that they may not belong to the same market segment. The relevant configuration details of the machines are provided so that readers have an understanding of why some benchmark numbers are skewed for or against the Intel NUC10i7FNH when we come to those sections.
| Comparative PC Configurations | ||
| Aspect | Intel NUC10i7FNH (Frost Canyon) | |
| CPU | Intel Core i7-10710U | Intel Core i7-10710U |
| GPU | Intel UHD Graphics | Intel UHD Graphics |
| RAM | Kingston ValueRAM KVR26S19S8/8 DDR4 SODIMM 19-19-19-43 @ 2666 MHz 2x8 GB |
Kingston ValueRAM KVR26S19S8/8 DDR4 SODIMM 19-19-19-43 @ 2666 MHz 2x8 GB |
| Storage | Kingston Design-In SSD U-SNS8154P3/256GJ (256 GB; M.2 Type 2280 PCIe 3.0 x2 NVMe; Toshiba 64L 3D TLC) (Phison E8-based, similar to the Kingston A1000) |
Kingston Design-In SSD U-SNS8154P3/256GJ (256 GB; M.2 Type 2280 PCIe 3.0 x2 NVMe; Toshiba 64L 3D TLC) (Phison E8-based, similar to the Kingston A1000) |
| Wi-Fi | Intel Wi-Fi 6 AX201 (2x2 802.11ax - 2400 Mbps) |
Intel Wi-Fi 6 AX201 (2x2 802.11ax - 2400 Mbps) |
| Price (in USD, when built) | $605 (barebones) $752 (as configured) $940 (NUC10i7FNHAA Bundle with 16GB RAM, 1TB HDD, 256GB SSD, and Windows 10 Home x64) |
$605 (barebones) $752 (as configured) $940 (NUC10i7FNHAA Bundle with 16GB RAM, 1TB HDD, 256GB SSD, and Windows 10 Home x64) |
BAPCo SYSmark 2018
The Intel NUC10i7FNH (Frost Canyon) was evaluated using our Fall 2018 test suite for small-form factor PCs. In the first section, we will be looking at SYSmark 2018.
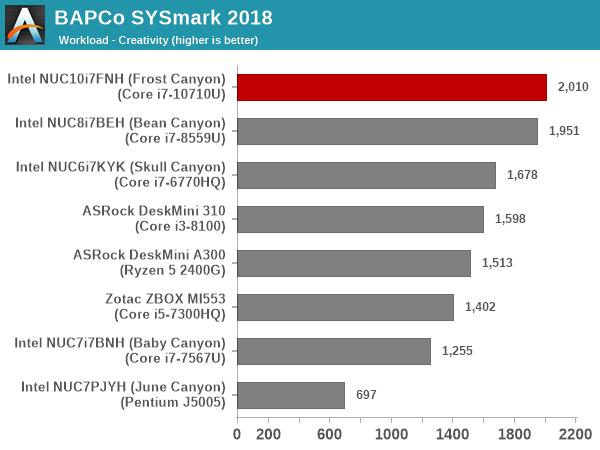
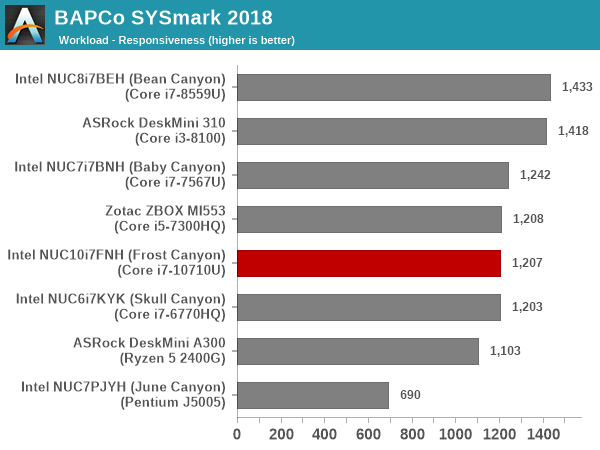
BAPCo's SYSmark 2018 is an application-based benchmark that uses real-world applications to replay usage patterns of business users in the areas of productivity, creativity, and responsiveness. The 'Productivity Scenario' covers office-centric activities including word processing, spreadsheet usage, financial analysis, software development, application installation, file compression, and e-mail management. The 'Creativity Scenario' represents media-centric activities such as digital photo processing, AI and ML for face recognition in photos and videos for the purpose of content creation, etc. The 'Responsiveness Scenario' evaluates the ability of the system to react in a quick manner to user inputs in areas such as application and file launches, web browsing, and multi-tasking.
Scores are meant to be compared against a reference desktop (the SYSmark 2018 calibration system, a Dell Optiplex 5050 tower with a Core i3-7100 and 4GB of DDR4-2133 memory to go with a 128GB M.2 SATA III SSD). The calibration system scores 1000 in each of the scenarios. A score of, say, 2000, would imply that the system under test is twice as fast as the reference system.
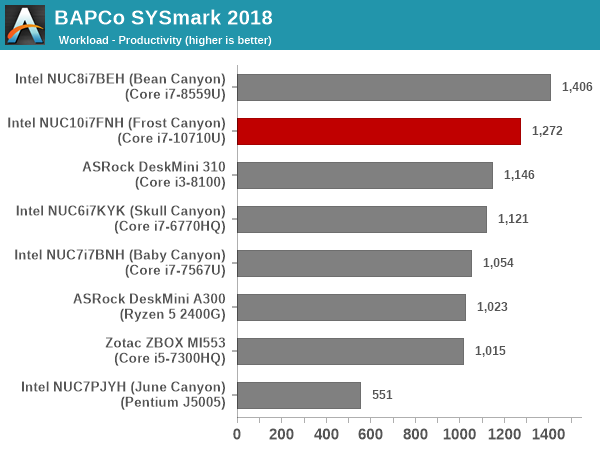
SYSmark 2018 also adds energy measurement to the mix. A high score in the SYSmark benchmarks might be nice to have, but, potential customers also need to determine the balance between power consumption and the efficiency of the system. For example, in the average office scenario, it might not be worth purchasing a noisy and power-hungry PC just because it ends up with a 2000 score in the SYSmark 2014 SE benchmarks. In order to provide a balanced perspective, SYSmark 2018 also allows vendors and decision makers to track the energy consumption during each workload. In the graphs below, we find the total energy consumed by the PC under test for a single iteration of each SYSmark 2018 workload. For reference, the calibration system consumes 5.36 Wh for productivity, 7.71 Wh for creativity, 5.61 Wh for responsiveness, and 18.68 Wh overall.
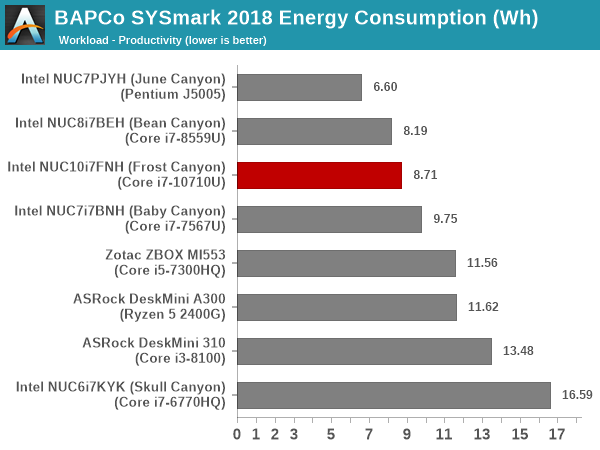
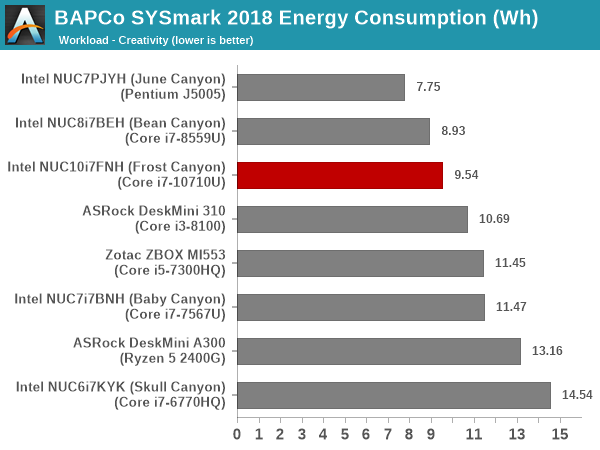
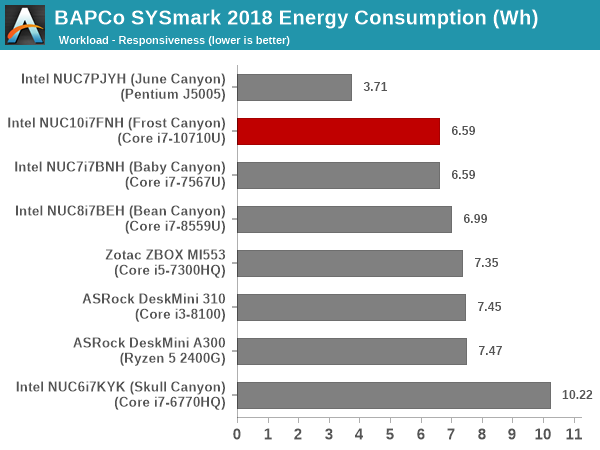
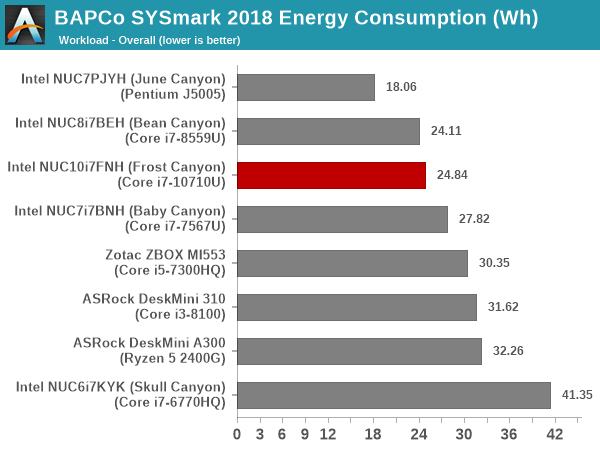
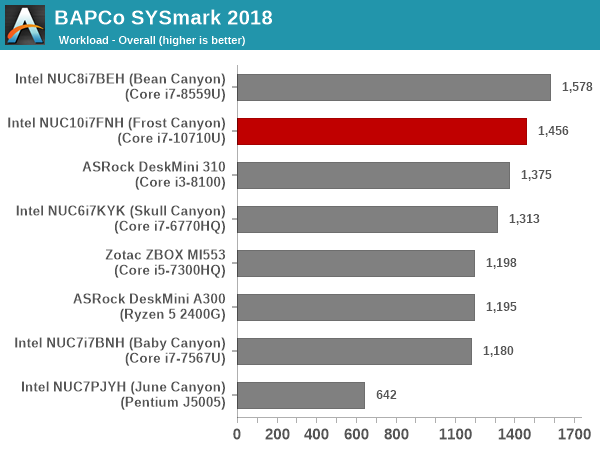
The 'Creativity' workload benefits from the extra cores in Frost Canyon compared to the Core i7-8559U in the Bean Canyon. Our Bean Canyon review configuration is also equipped with a WD Black 3D NVMe SSD (PCIe 3.0 x4) that delivers much better performance compared to the PCIe 3.0 x2 Kingston A1000-class in the Frost Canyon configuration. This results in the responsiveness score for the NUC10i7FNH coming in the middle of the pack compared to the other systems in the sample set. This pulls down the Frost Canyon NUC well below the Bean Canyon NUC in the overall score. The energy consumption is also worse off.
UL Benchmarks: PCMark and 3DMark
This section deals with a selection of the UL Futuremark benchmarks - PCMark 10, PCMark 8, and 3DMark. While the first two evaluate the system as a whole, 3DMark focuses on the graphics capabilities.
PCMark 10
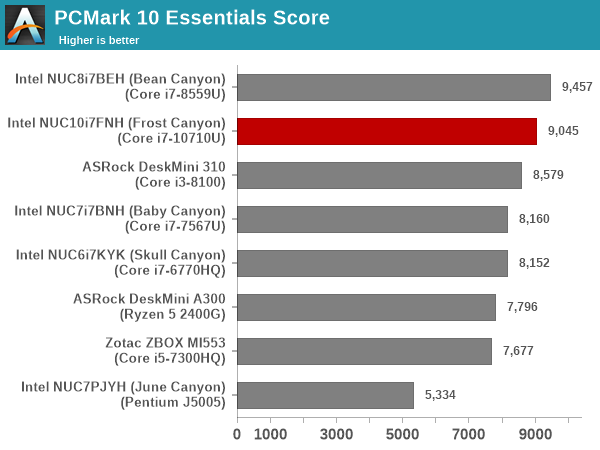
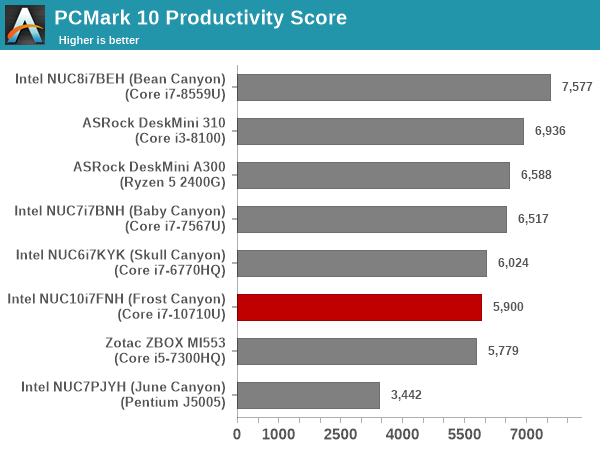
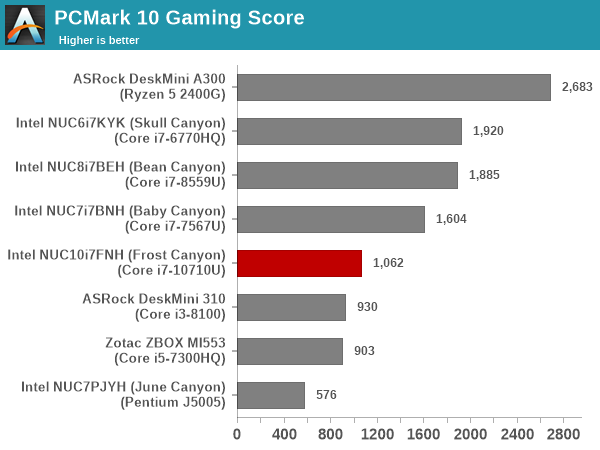
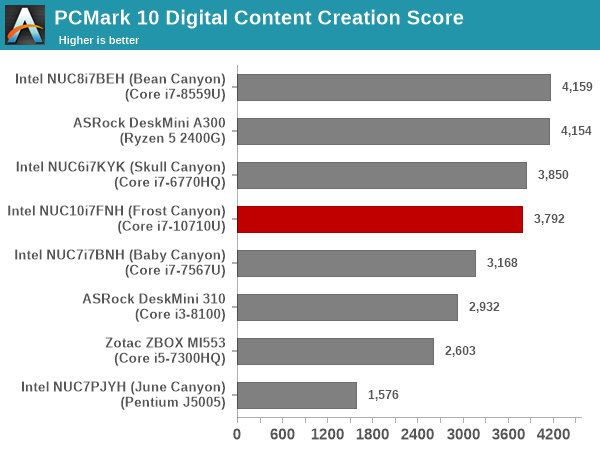
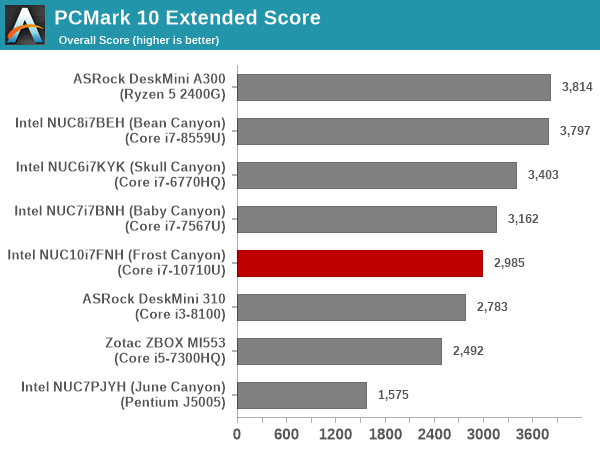
UL's PCMark 10 evaluates computing systems for various usage scenarios (generic / essential tasks such as web browsing and starting up applications, productivity tasks such as editing spreadsheets and documents, gaming, and digital content creation). We benchmarked select PCs with the PCMark 10 Extended profile and recorded the scores for various scenarios. These scores are heavily influenced by the CPU and GPU in the system, though the RAM and storage device also play a part. The power plan was set to Balanced for all the PCs while processing the PCMark 10 benchmark.
The Frost Canyon NUC comes in the middle of the pack, getting bettered by either systems with CPUs capable of higher TDP or better-performing storage. The hexa-core capabilities do not deliver any substantial benefits across various PCMark 10 scenarios, and the absence of Iris Plus Graphics / eDRAM pulls down the 'Gaming Score'.
PCMark 8
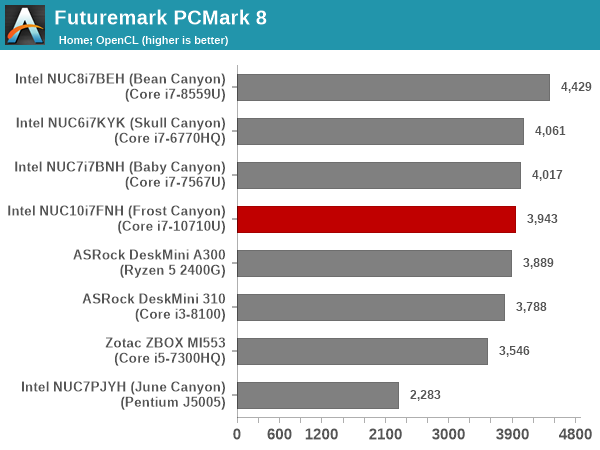
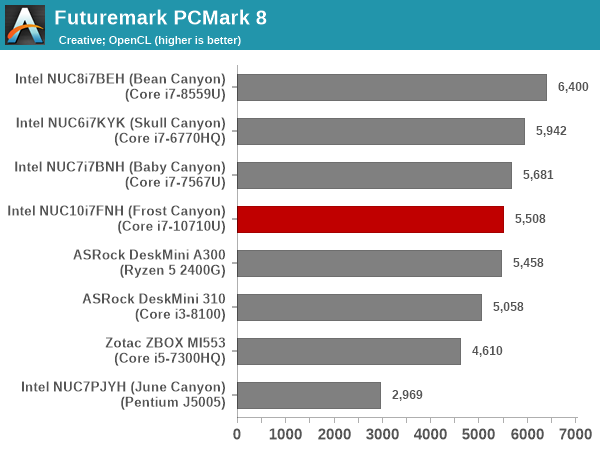
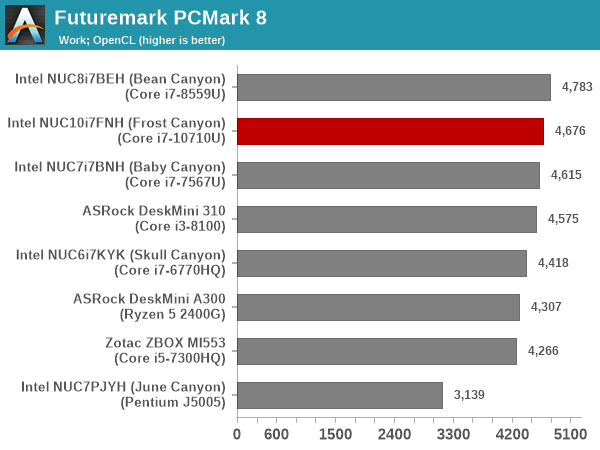
We continue to present PCMark 8 benchmark results (as those have more comparison points) while our PCMark 10 scores database for systems grows in size. PCMark 8 provides various usage scenarios (home, creative and work) and offers ways to benchmark both baseline (CPU-only) as well as OpenCL accelerated (CPU + GPU) performance. We benchmarked select PCs for the OpenCL accelerated performance in all three usage scenarios. These scores are heavily influenced by the CPU in the system, and the scores roughly track what was observed in the PCMark 10 workloads.
3DMark
UL's 3DMark comes with a diverse set of graphics workloads that target different Direct3D feature levels. Correspondingly, the rendering resolutions are also different. We use 3DMark 2.4.4264 to get an idea of the graphics capabilities of the system. In this section, we take a look at the performance of the Intel NUC10i7FNH (Frost Canyon) across the different 3DMark workloads.
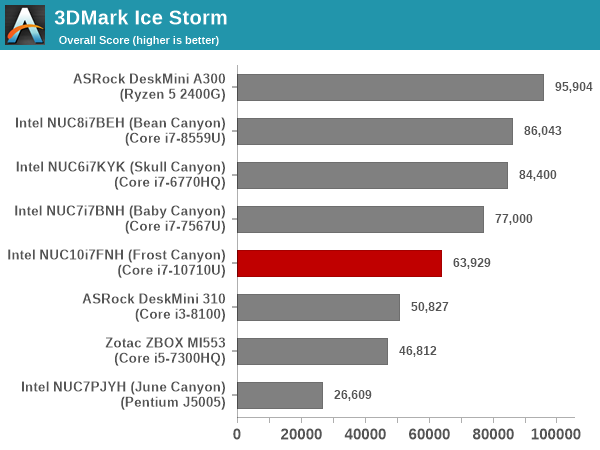
3DMark Ice Storm
This workload has three levels of varying complexity - the vanilla Ice Storm, Ice Storm Unlimited, and Ice Storm Extreme. It is a cross-platform benchmark (which means that the scores can be compared across different tablets and smartphones as well). All three use DirectX 11 (feature level 9) / OpenGL ES 2.0. While the Extreme renders at 1920 x 1080, the other two render at 1280 x 720. The graphs below present the various Ice Storm worloads' numbers for different systems that we have evaluated.
| UL 3DMark - Ice Storm Workloads | |||
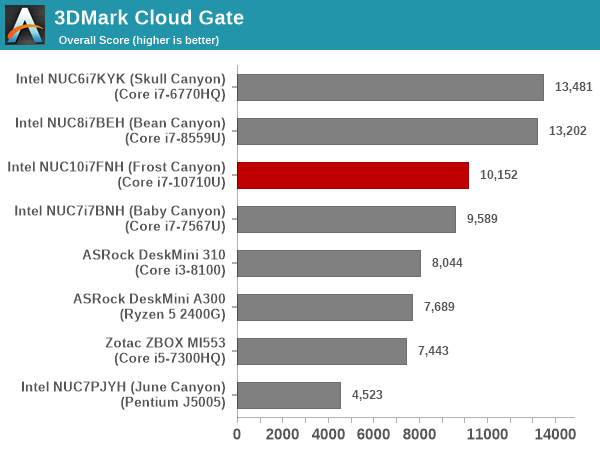
3DMark Cloud Gate
The Cloud Gate workload is meant for notebooks and typical home PCs, and uses DirectX 11 (feature level 10) to render frames at 1280 x 720. The graph below presents the overall score for the workload across all the systems that are being compared. The absence of eDRAM / Iris Plus Graphics results in the Frost Canyon performing significantly worse compared to the Bean Canyon.
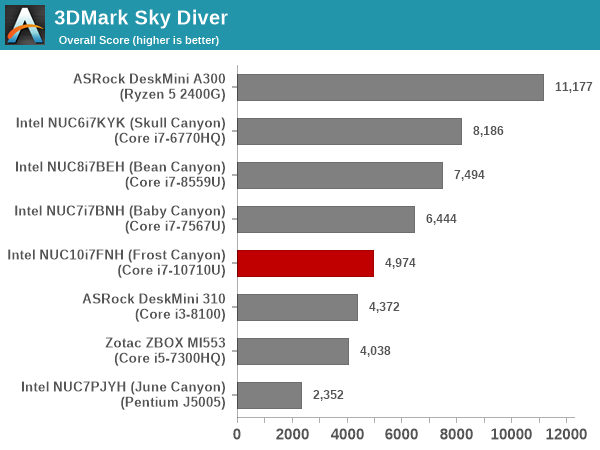
3DMark Sky Diver
The Sky Diver workload is meant for gaming notebooks and mid-range PCs, and uses DirectX 11 (feature level 11) to render frames at 1920 x 1080. The graph below presents the overall score for the workload across all the systems that are being compared. At 1080p, Frost Canyon falls further behind, and is below Baby Canyon's performance - pointing to the lack of GPU prowess.
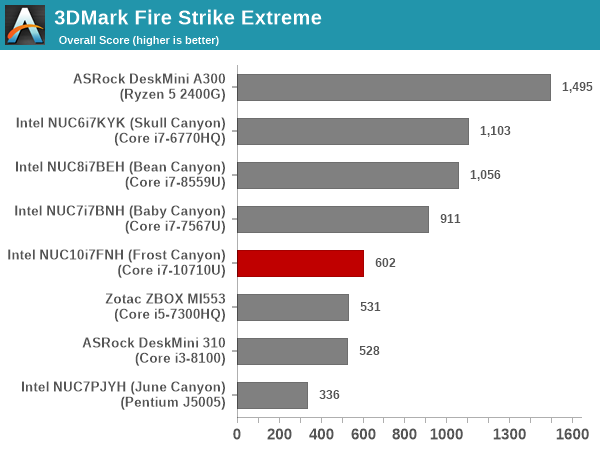
3DMark Fire Strike Extreme
The Fire Strike benchmark has three workloads. The base version is meant for high-performance gaming PCs. Similar to Sky Diver, it uses DirectX 11 (feature level 11) to render frames at 1920 x 1080. The Ultra version targets 4K gaming system, and renders at 3840 x 2160. However, we only deal with the Extreme version in our benchmarking - It renders at 2560 x 1440, and targets multi-GPU systems and overclocked PCs. The graph below presents the overall score for the Fire Strike Extreme benchmark across all the systems that are being compared. The results are similar to the Sky Diver workload.
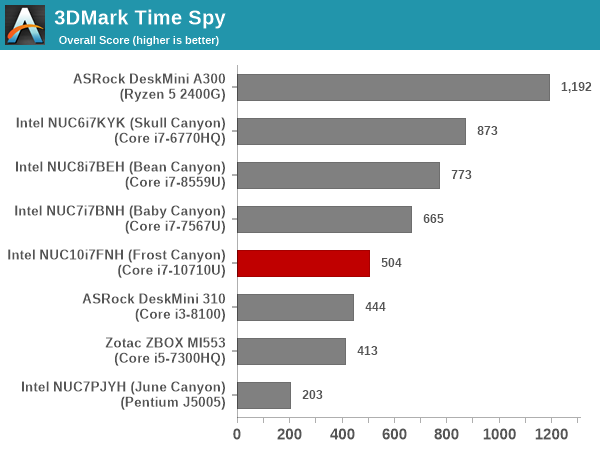
3DMark Time Spy
The Time Spy workload has two levels with different complexities. Both use DirectX 12 (feature level 11). However, the plain version targets high-performance gaming PCs with a 2560 x 1440 render resolution, while the Extreme version renders at 3840 x 2160 resolution. The graphs below present both numbers for all the systems that are being compared in this review, with results being similar to the 1080p Sky Diver workload.
| UL 3DMark - Time Spy Workloads | |||
3DMark Night Raid
The Night Raid workload is a DirectX 12 benchmark test. It is less demanding than Time Spy, and is optimized for integrated graphics. The graph below presents the overall score in this workload for different system configurations.
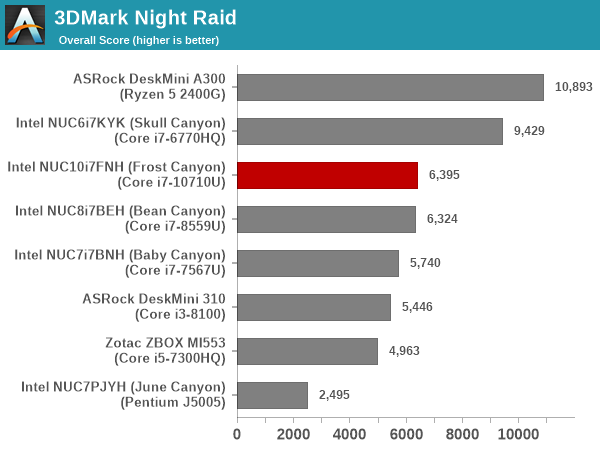
Overall, for CPU-bound graphics workloads, the Frost Canyon performs well, but, in other cases, the absence of eDRAM and the need to share the TDP with a hexa-core CPU block shows its effects. In almost all cases, the Bean Canyon NUC either vastly overperforms the Frost Canyon NUC, or, is neck-to-neck with it.
Miscellaneous Performance Metrics
This section looks at some of the other commonly used benchmarks representative of the performance of specific real-world applications.
3D Rendering - CINEBENCH R15
We use CINEBENCH R15 for 3D rendering evaluation. The program provides three benchmark modes - OpenGL, single threaded and multi-threaded. Evaluation of different PC configurations in all three modes provided us the following results. It must be noted that R15 is good enough for the current crop of SFF PCs. Once we start getting 16 cores or more, the shift to more modern versions of CINEBENCH will be made.
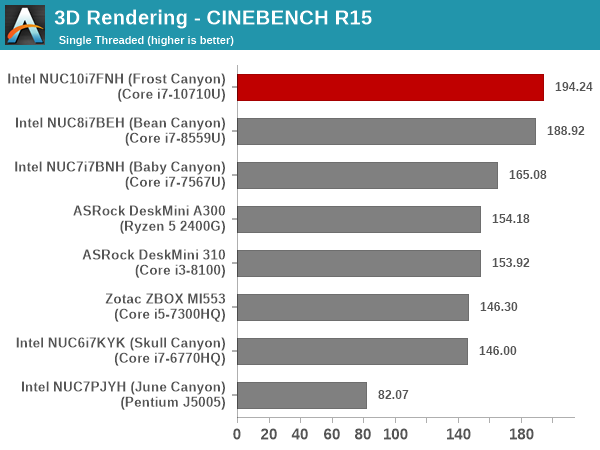
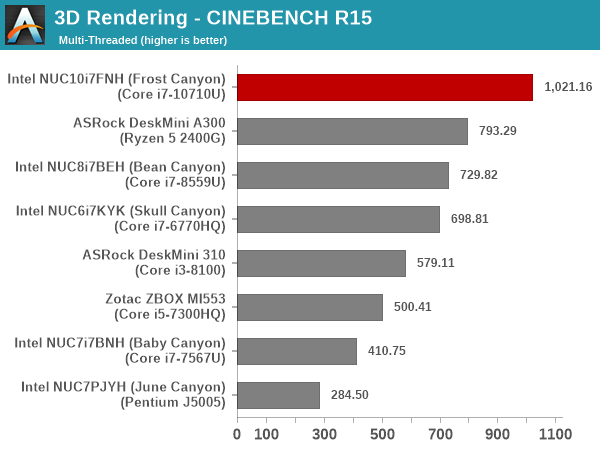
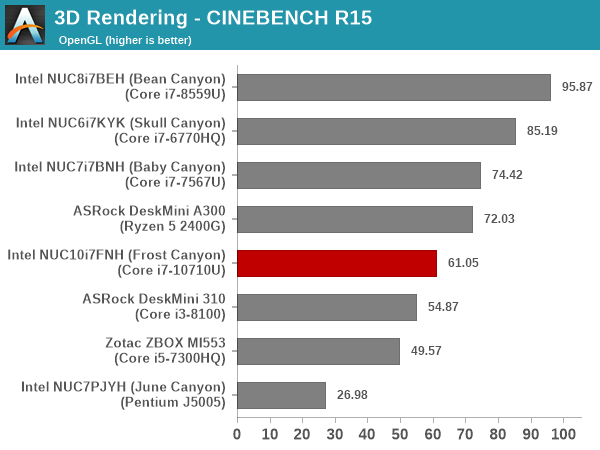
Except for the OpenGL case, both the single (ST) and multi-threaded (MT) versions bring out Frost Canyon on top. As expected, there is negligible difference in the ST performance of the Bean Canyon and Frost Canyon NUCs, as the CPUs are both based on the same Skylake microarchitecture, with the optimizations allowing for higher clocks getting compensated by the increased core count in the processor.
x265 Benchmark
Next up, we have some video encoding benchmarks using x265 v2.8. The appropriate encoder executable is chosen based on the supported CPU features. In the first case, we encode 600 1080p YUV 4:2:0 frames into a 1080p30 HEVC Main-profile compatible video stream at 1 Mbps and record the average number of frames encoded per second.
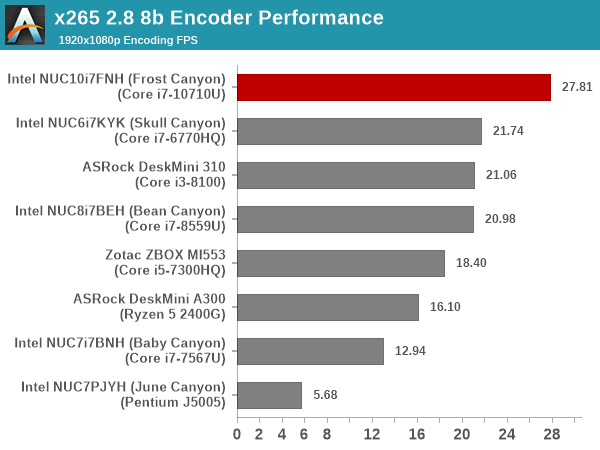
Our second test case is 1200 4K YUV 4:2:0 frames getting encoded into a 4Kp60 HEVC Main10-profile video stream at 35 Mbps. The encoding FPS is recorded.
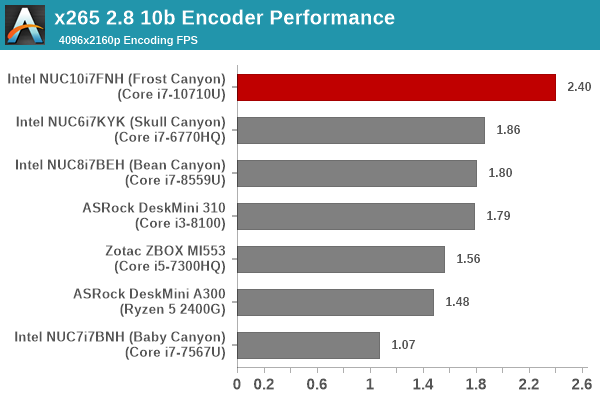
In both cases, the hexa-core nature of Frost Canyon stands in good stead, even enabling it to get a sizable lead over competing systems sporting processors with higher TDPs.
7-Zip
7-Zip is a very effective and efficient compression program, often beating out OpenCL accelerated commercial programs in benchmarks even while using just the CPU power. 7-Zip has a benchmarking program that provides tons of details regarding the underlying CPU's efficiency. In this subsection, we are interested in the compression and decompression rates when utilizing all the available threads for the LZMA algorithm.
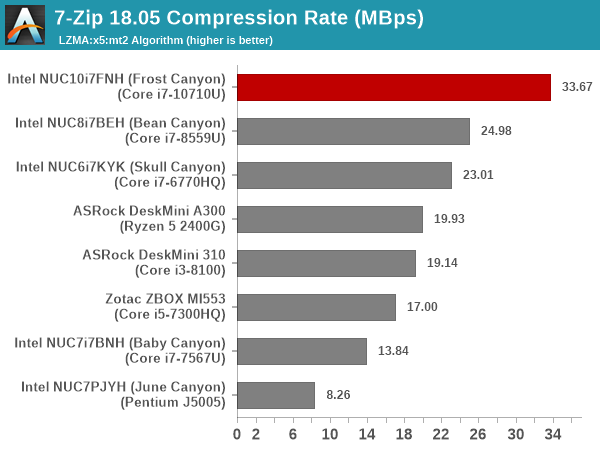
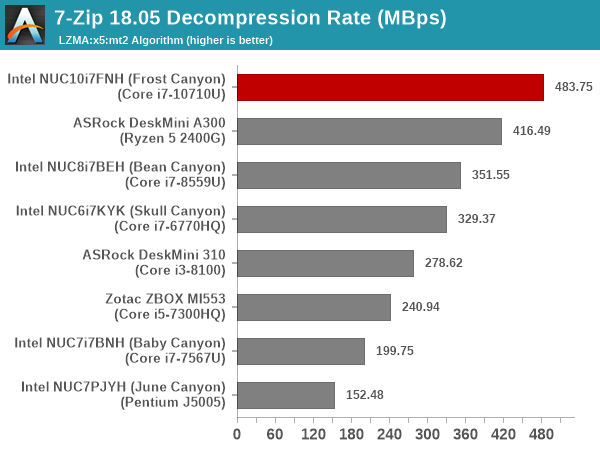
Here, we again see the hexa-core feature enabling Frost Canyon to surpass the performance of systems sporting processors with higher TDPs.
Cryptography Benchmarks
Cryptography has become an indispensable part of our interaction with computing systems. Almost all modern systems have some sort of hardware-acceleration for making cryptographic operations faster and more power efficient. In this sub-section, we look at two different real-world applications that may make use of this acceleration.
BitLocker is a Windows features that encrypts entire disk volumes. While drives that offer encryption capabilities are dealt with using that feature, most legacy systems and external drives have to use the host system implementation. Windows has no direct benchmark for BitLocker. However, we cooked up a BitLocker operation sequence to determine the adeptness of the system at handling BitLocker operations. We start off with a 2.5GB RAM drive in which a 2GB VHD (virtual hard disk) is created. This VHD is then mounted, and BitLocker is enabled on the volume. Once the BitLocker encryption process gets done, BitLocker is disabled. This triggers a decryption process. The times taken to complete the encryption and decryption are recorded. This process is repeated 25 times, and the average of the last 20 iterations is graphed below.
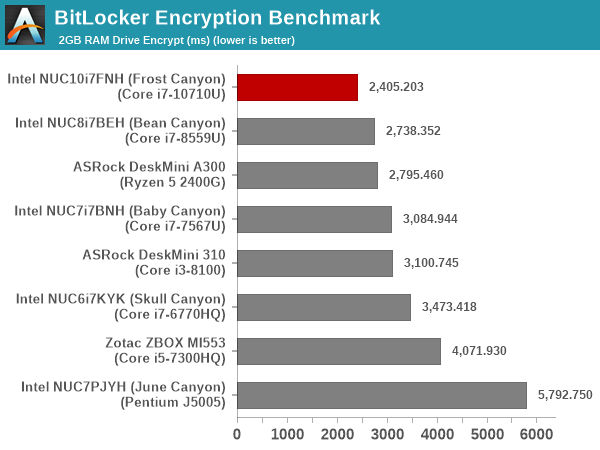
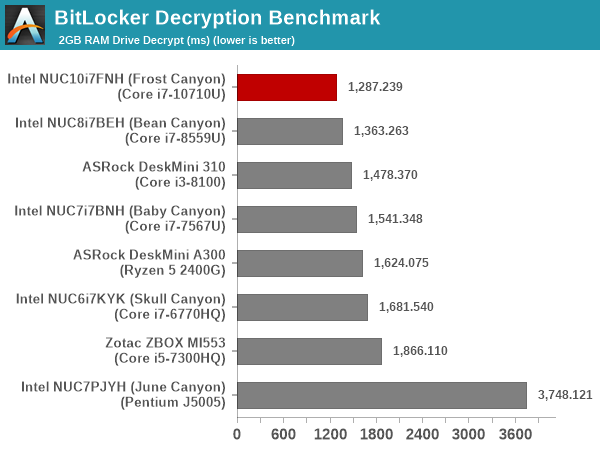
The availability of 6 cores to issue AES-NI operations on enables BitLocker to perform better on the Frost Canyon compared to Bean Canyon, despite the Bean Canyon configuration sporting a much higher performing memory sub-system with a DDR4-3000 SODIMM kit at a lower latency.
Creation of secure archives is best done through the use of AES-256 as the encryption method while password protecting ZIP files. We re-use the benchmark mode of 7-Zip to determine the AES256-CBC encryption and decryption rates using pure software as well as AES-NI. Note that the 7-Zip benchmark uses a 48KB buffer for this purpose.
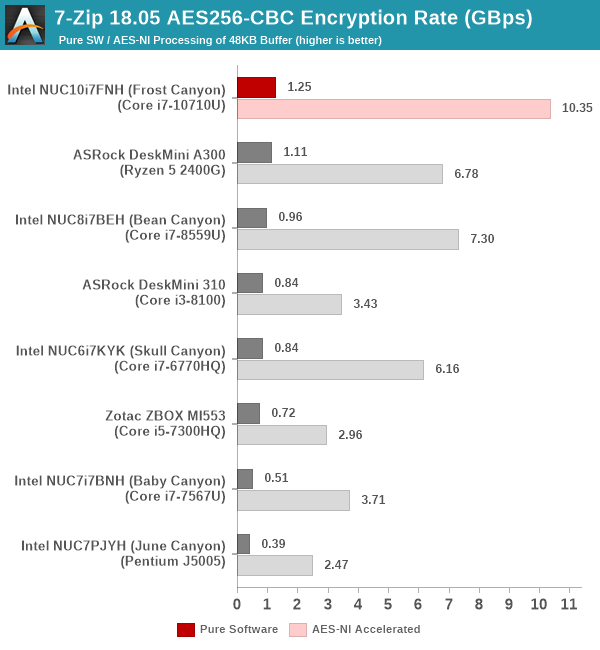
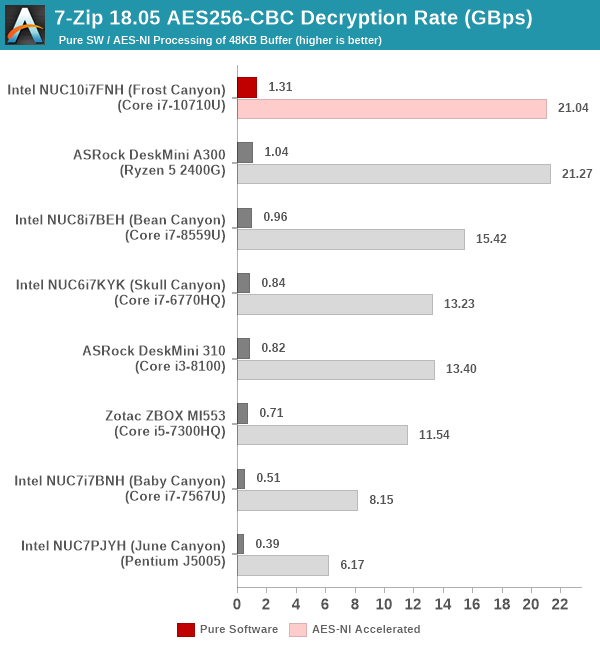
The observations we made for the BitLocker workload work for 7-Zip too. The Ryzen 5 2400G, for some reason, seems to offer much faster / optimized hardware acceleration for certain cryptographic operations, enabling it to be neck-and-neck with the Frost Canyon for AES256-CBC decryption in the above case. Obviously, the TDP difference (65W vs 25W) needs to be taken into account, though it is likely that the Frost Canyon NUC was at turbo-speeds in PL2 for at least the first few iterations of the benchmark.
Yet another cryptography application is secure network communication. OpenSSL can take advantage of the acceleration provided by the host system to make operations faster. It also has a benchmark mode that can use varying buffer sizes. We recorded the processing rate for a 8KB buffer using the hardware-accelerated AES256-CBC-HAC-SHA1 feature.
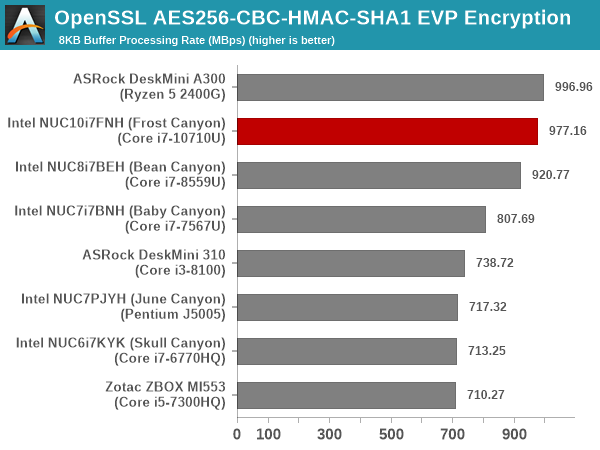
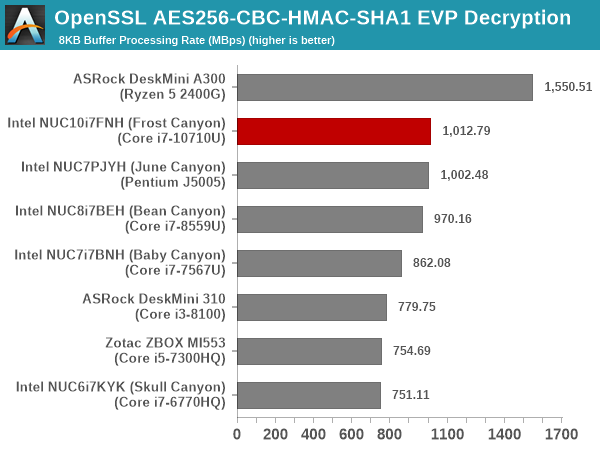
Here, we see the Ryzen 5 2400G completely outperform the Frost Canyon NUC due to better optimization of the workload for the hardware acceleration capabilities offered by the Ryzen processor.
Agisoft Photoscan
Agisoft PhotoScan is a commercial program that converts 2D images into 3D point maps, meshes and textures. The program designers sent us a command line version in order to evaluate the efficiency of various systems that go under our review scanner. The command line version has two benchmark modes, one using the CPU and the other using both the CPU and GPU (via OpenCL). We present the results from our evaluation using the CPU mode only. The benchmark (v1.3) takes 84 photographs and does four stages of computation:
- Stage 1: Align Photographs (capable of OpenCL acceleration)
- Stage 2: Build Point Cloud (capable of OpenCL acceleration)
- Stage 3: Build Mesh
- Stage 4: Build Textures
We record the time taken for each stage. Since various elements of the software are single threaded, and others multithreaded, it is interesting to record the effects of CPU generations, speeds, number of cores, and DRAM parameters using this software.
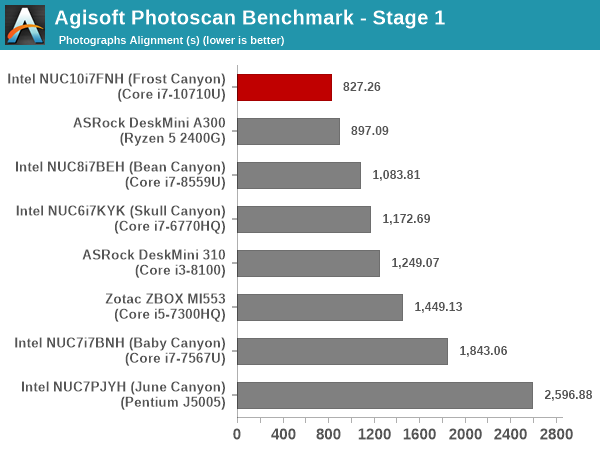
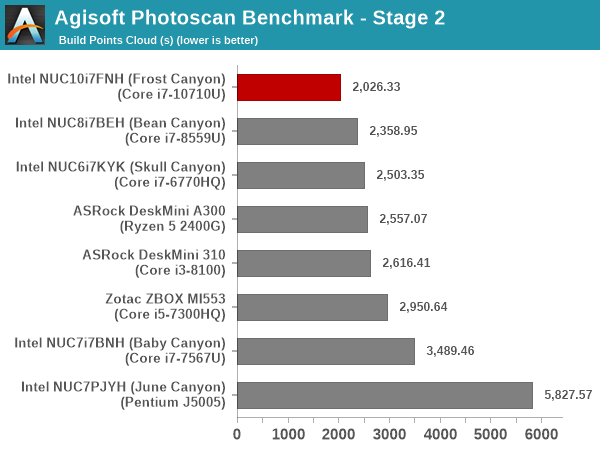
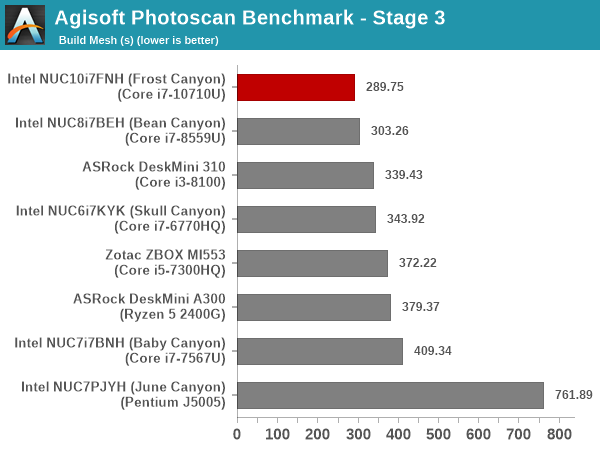
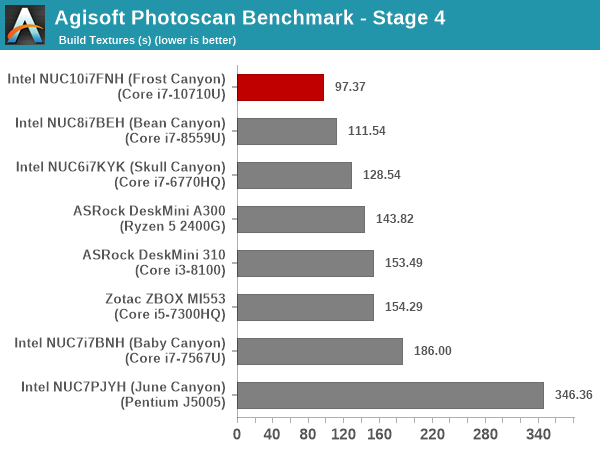
The hexa-core nature makes the Frost Canyon NUC emerge as the best performer in the Agisoft Photoscan benchmark across all the SFF PCs considered in this review.
Dolphin Emulator
Wrapping up our application benchmark numbers is the new Dolphin Emulator (v5) benchmark mode results. This is again a test of the CPU capabilities.
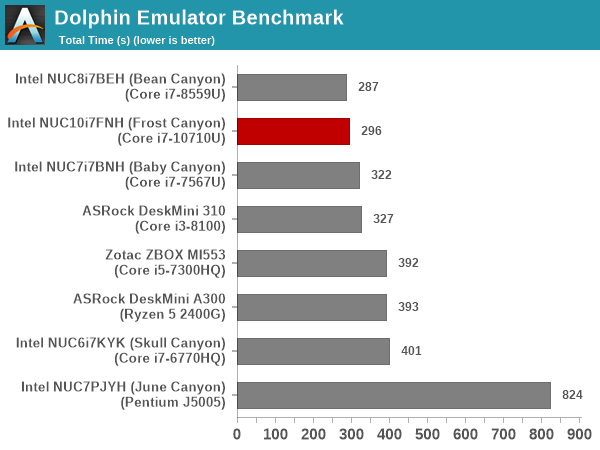
The benchmark is mostly bound by single-threaded performance, and we do not see much difference between the Bean Canyon and Frost Canyon NUCs in this workload.
Networking and Storage Performance
Networking and storage are two major aspects which influence our experience with any computing system. This section presents results from our evaluation of the storage aspect in the Intel NUC10i7FNH (Frost Canyon). One option would be repetition of our strenuous SSD review tests on the drive(s) in the PC. Fortunately, to avoid that overkill, PCMark 8 and PCMark 10 have storage benches where certain common workloads such as loading games and document processing are replayed on the target drive. Results are presented in two forms, one being a benchmark number and the other, a bandwidth figure.
We first ran the PCMark 8 storage bench on selected PCs and the results are presented below.
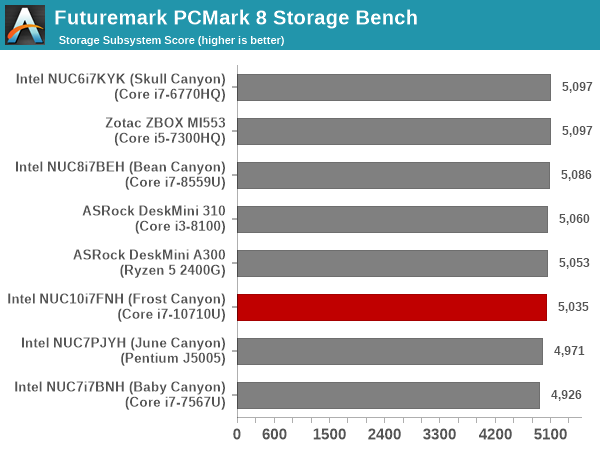
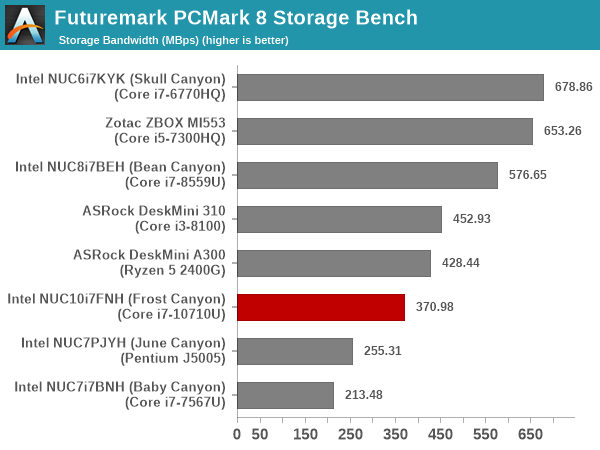
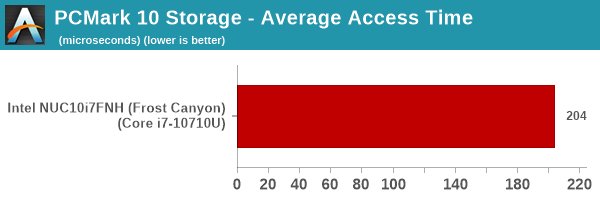
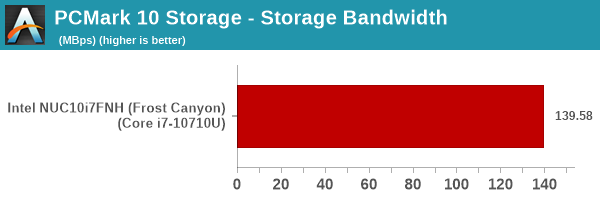
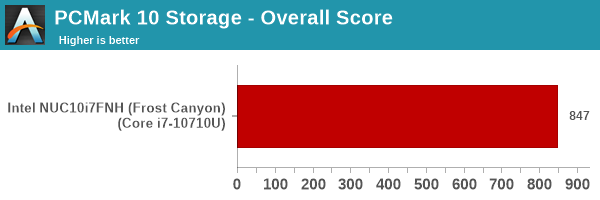
The PCIe 3.0 x2 SSD doesn't perform up to the mark when compared to the PCIe 3.0 x4 SSDs used in the other systems. However, it is still better than the SATA SSDs used in other systems. The Frost Canyon NUC is the first one in our SFF PC set to be subject to the PCMark 10 Storage Bench, and as such, we do not have any other systems to compare its average access time of 204 us and storage bandwidth of 139.58 MBps against.
On the networking side, we are yet to set up our 802.11 ax / Wi-Fi 6 testbed for small form-factor PCs, and hence, there are no bandwidth numbers to report yet. However, it must be noted that the Frost Canyon NUC is the first NUC to come with 802.11ax / Wi-Fi 6 support, and its theoretical maximum bandwidth of 2400 Mbps betters the 1733 Mbps offered by the Wireless-AC 9560 in the Bean Canyon NUC. The AX 201 WLAN component uses the CNVi capability in the Comet Lake-U SiP with only the radio being an external chip. The AX 201 has a 2x2 simultaneous dual-operation in 2.4 GHz and 5 GHz bands and also comes with support for 160 MHz-wide channels.
HTPC Credentials - Display Outputs Capabilities
The
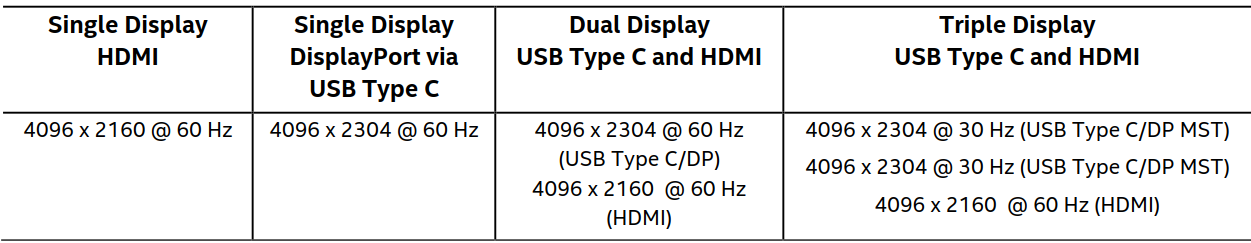
Supporting the display of high-resolution protected video content is a requirement for even a casual HTPC user. In addition, HTPC enthusiasts also want their systems to support refresh rates that either match or be an integral multiple of the frame rate of the video being displayed. Most displays / AVRs are able to transmit the supported refresh rates to the PC using the EDID metadata. In some cases, the desired refresh rate might be missing in the list of supported modes, and custom resolutions may need to be added.
Custom Resolutions
Our evaluation of the

The gallery below presents screenshots from the other refresh rates that were tested. The system has no trouble maintaining a fairly accurate refresh rate throughout the duration of the video playback.


High Dynamic Range (HDR) Support
The ability of the system to support HDR output is brought out in the first line of the madVR OSD in the above pictures. The display / desktop was configured to be in HDR mode prior to the gathering of the above screenshots.

The CyberLink Ultra HD Blu-ray Advisor tool confirms that our setup (
[Update (3/17/2020): While I continue to have terrible luck in enabling SGX to operate correctly with the CuberLink Ultra HD Blu-ray Advisor tool, Intel sent across proof that the Frost Canyon NUC is indeed capable of playing back Ultra HD Blu-rays.

It is likely that most consumers using the pre-installed Windows 10 Home x64 / pre-installed drivers will have a painless experience unlike mine which started off the system as a barebones version.]
HTPC Credentials - YouTube and Netflix Streaming
The move to 4K, and the need to evaluate HDR support have made us choose Mystery Box's Peru 8K HDR 60FPS video as our test sample for YouTube playback. On PCs running Windows, it is recommended that HDR streaming videos be viewed using the Microsoft Edge browser after putting the desktop in HDR mode.
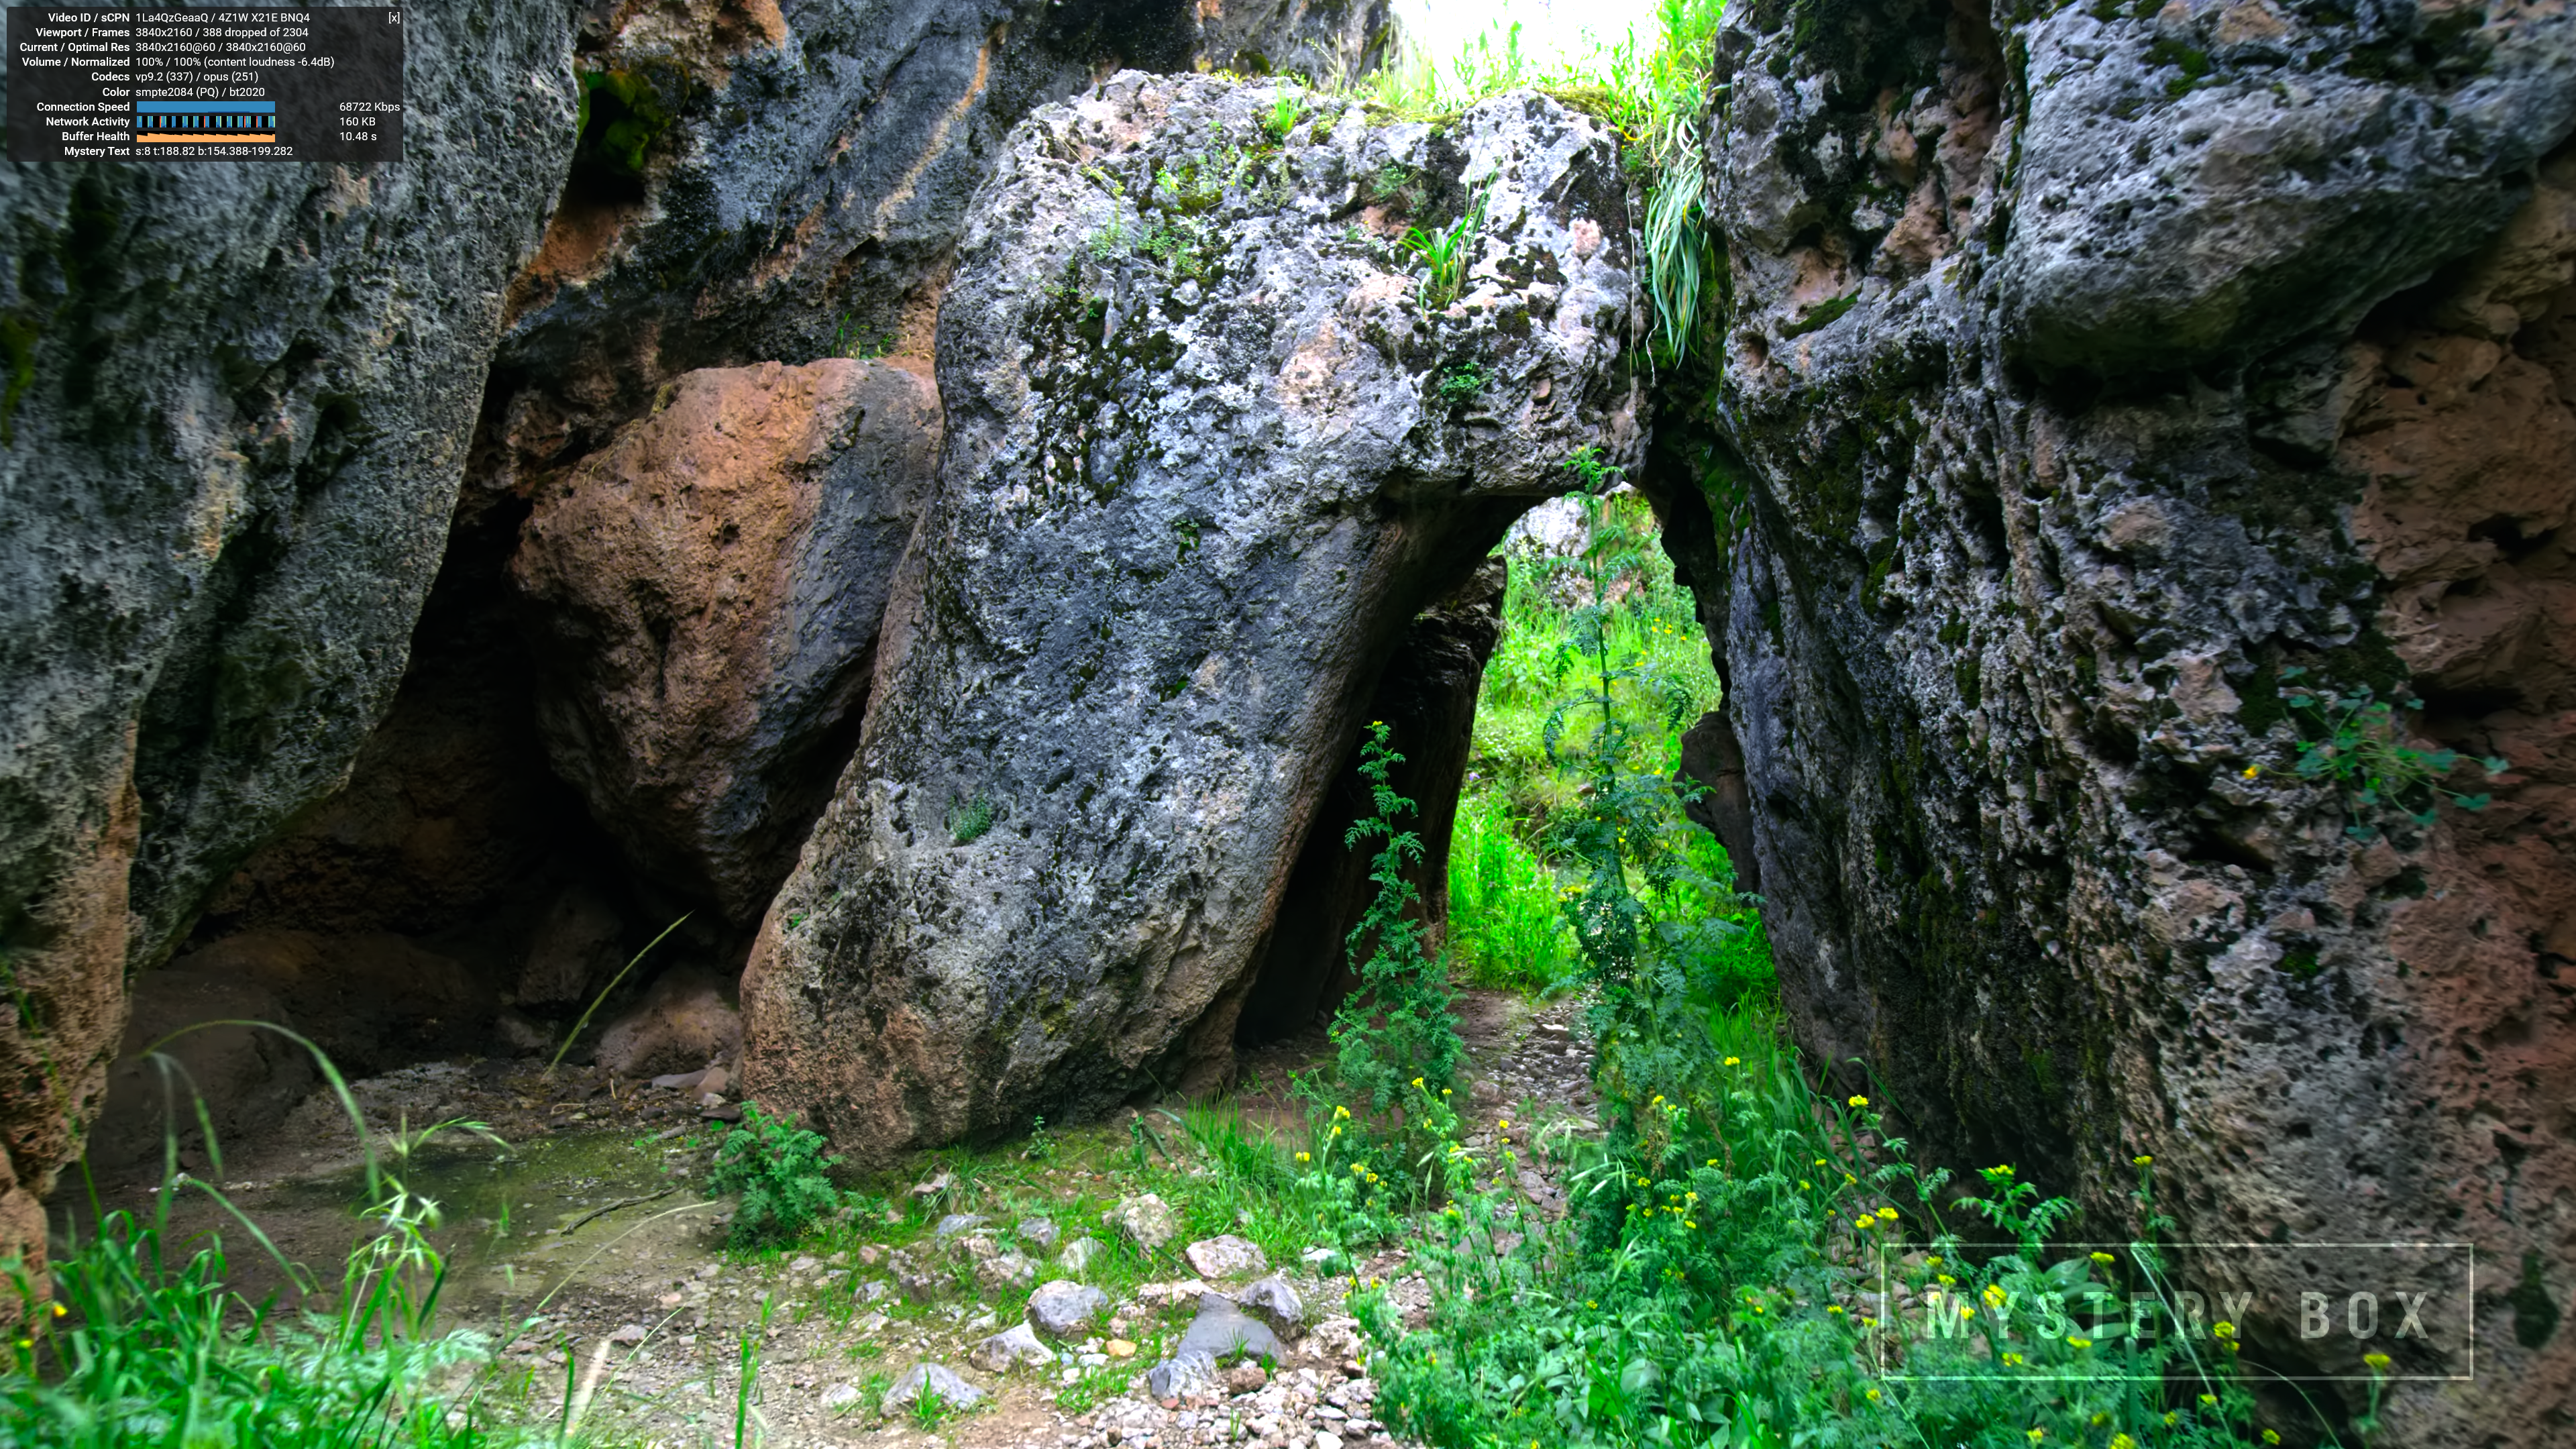
Similar to the last few NUC generations, the Frost Canyon NUC also has no trouble in hardware-accelerated playback of the VP9 Profile 2 video. Thankfully, AV1 (which is not hardware-accelerated yet) streams are not being delivered yet to the PC platform.
The 'new' GPU is not yet recognized by tools such as GPU-Z, and the media engine loading is not being correctly tracked by the various tools we usually use. Hence, we have only GPU power and at-wall power being reocrded for the media playback tests. The numbers for YouTube video playback are graphed below.
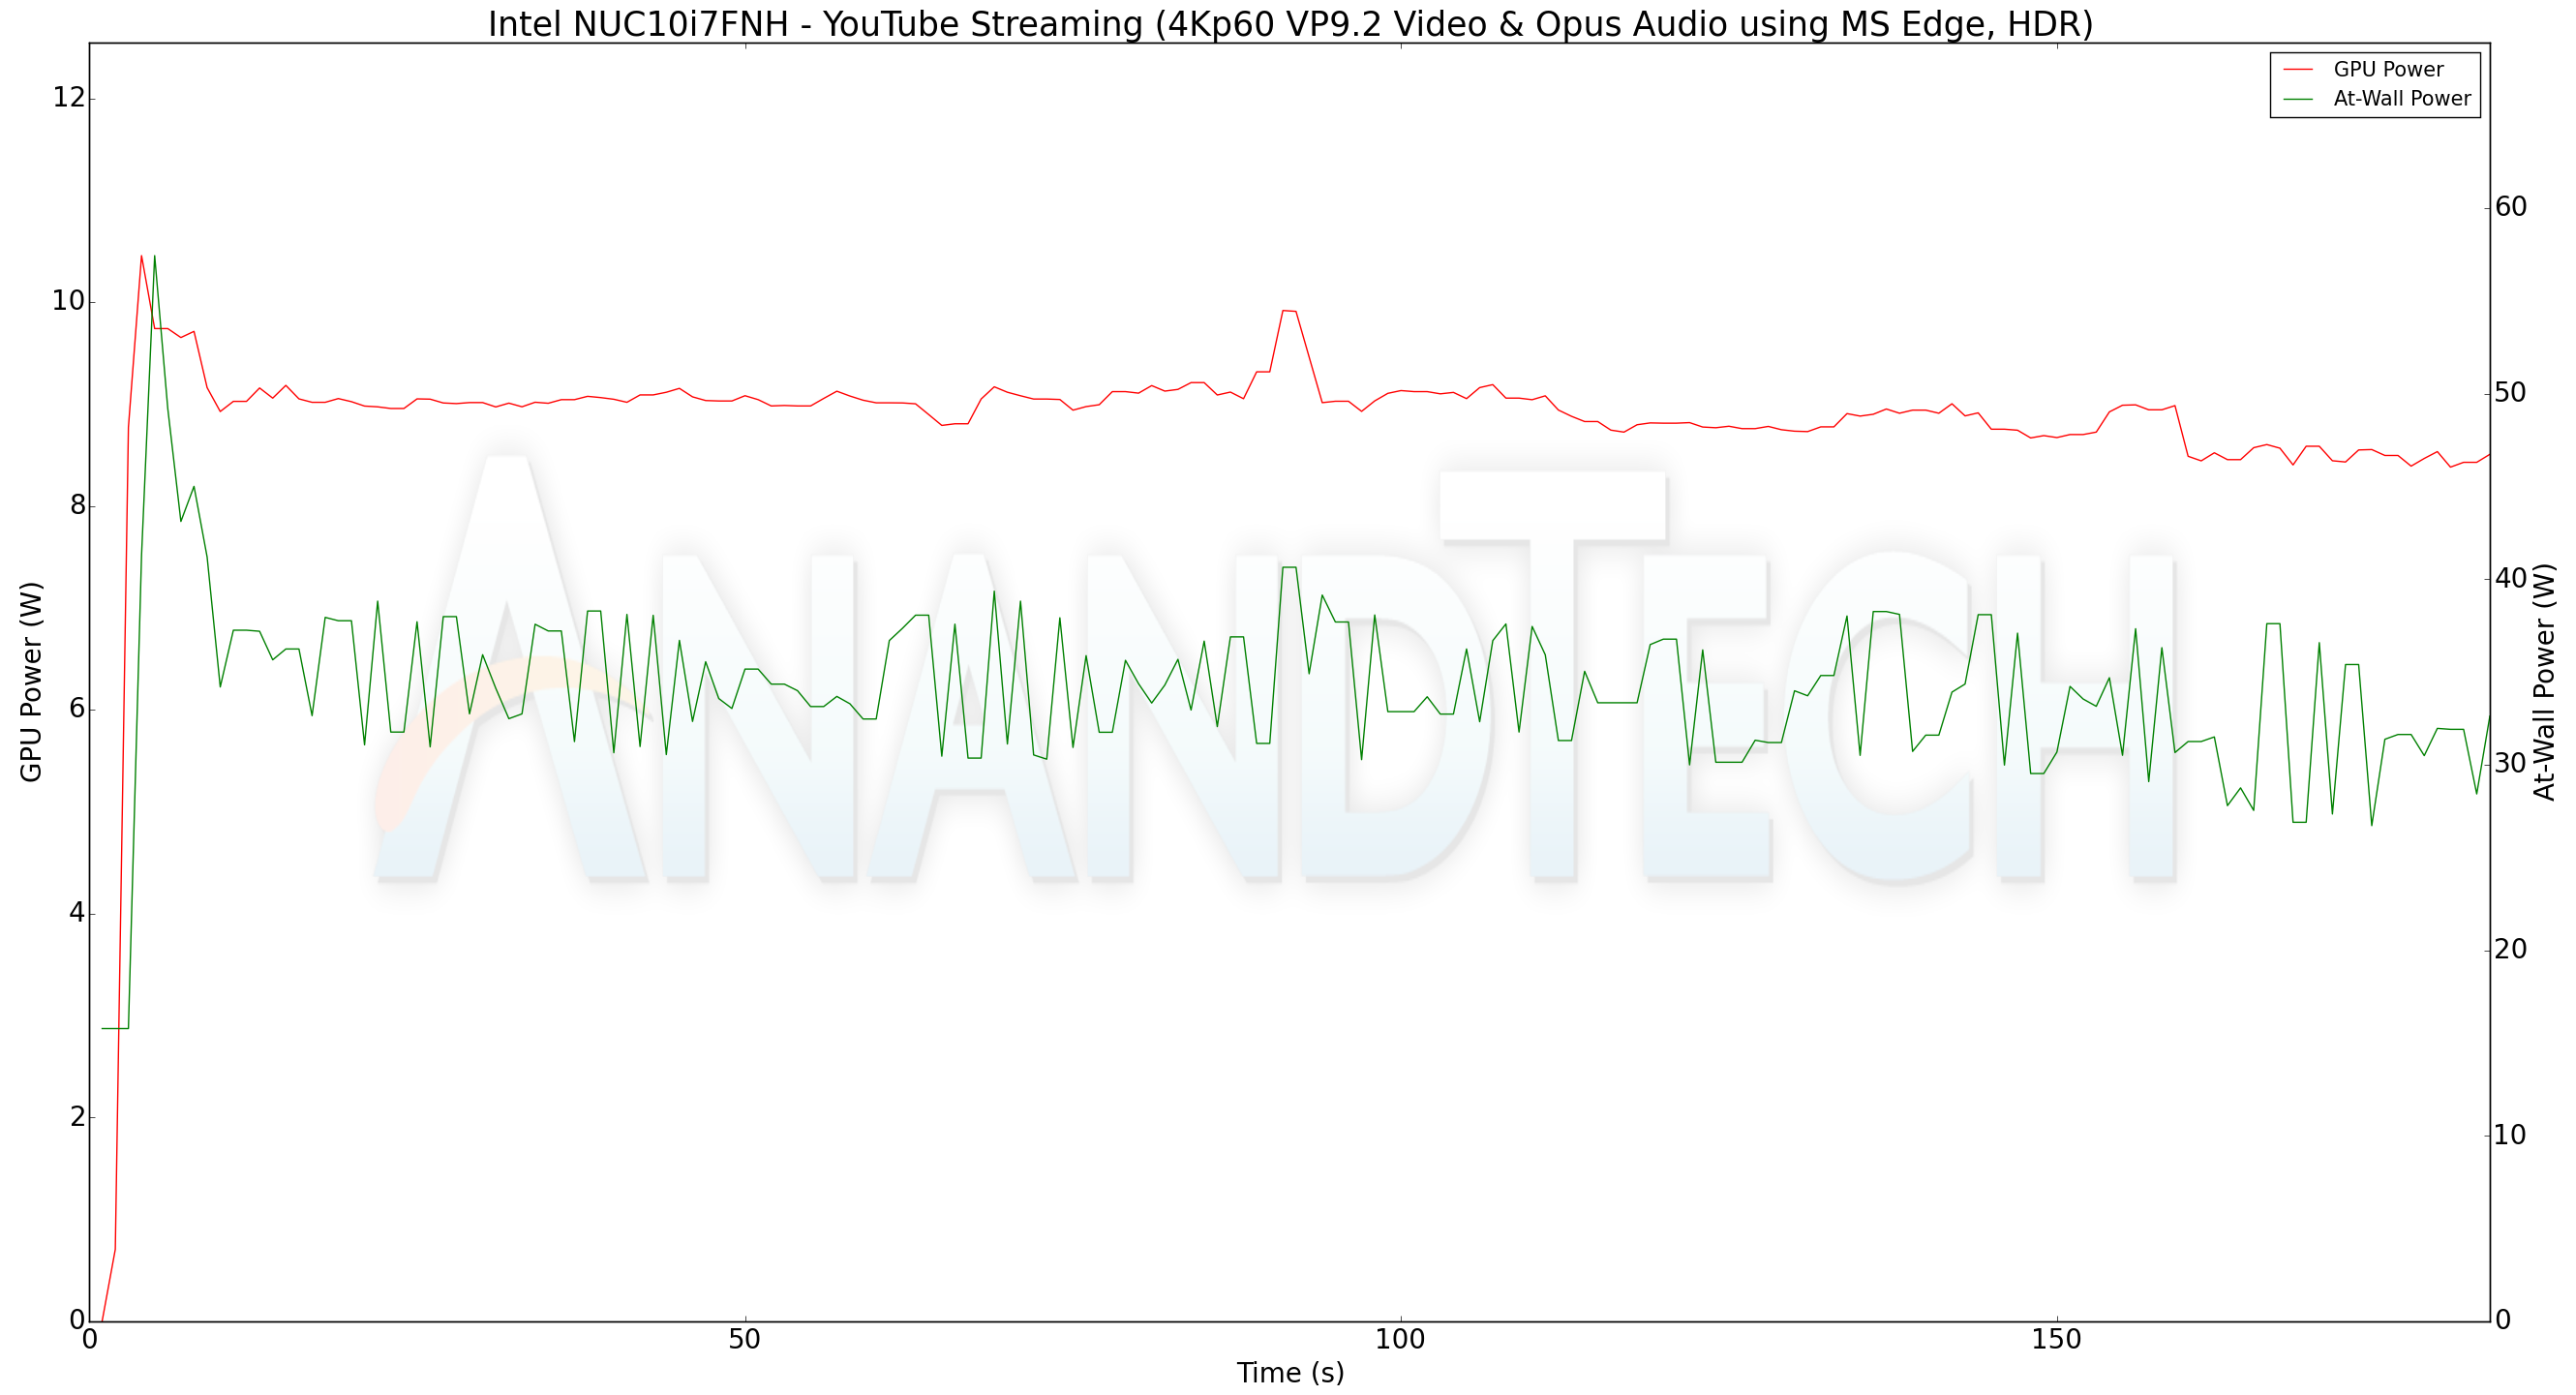
YouTube playback results in the GPU consuming around 9W of power on an average, with the at-wall consumption being around 35W.
The Netflix 4K HDR capability works with native Windows Store app as well as the Microsoft Edge browser. We used the Windows Store app to evaluate the playback of Season 4 Episode 4 of the Netflix Test Patterns title. The OS screenshot facilities obviously can't capture the video being played back. However, the debug OSD (reachable by Ctrl-Alt-Shift-D) can be recorded.

The (hevc,hdr,prk) entry corresponding to the Video Track in the debug OSD, along with the A/V bitrate details (192 kbps / 16 Mbps) indicate that the HDR stream is indeed being played back. Similar to the YouTube streaming case, a few metrics were recorded for the first three minutes of the playback of the title. The numbers are graphed below.
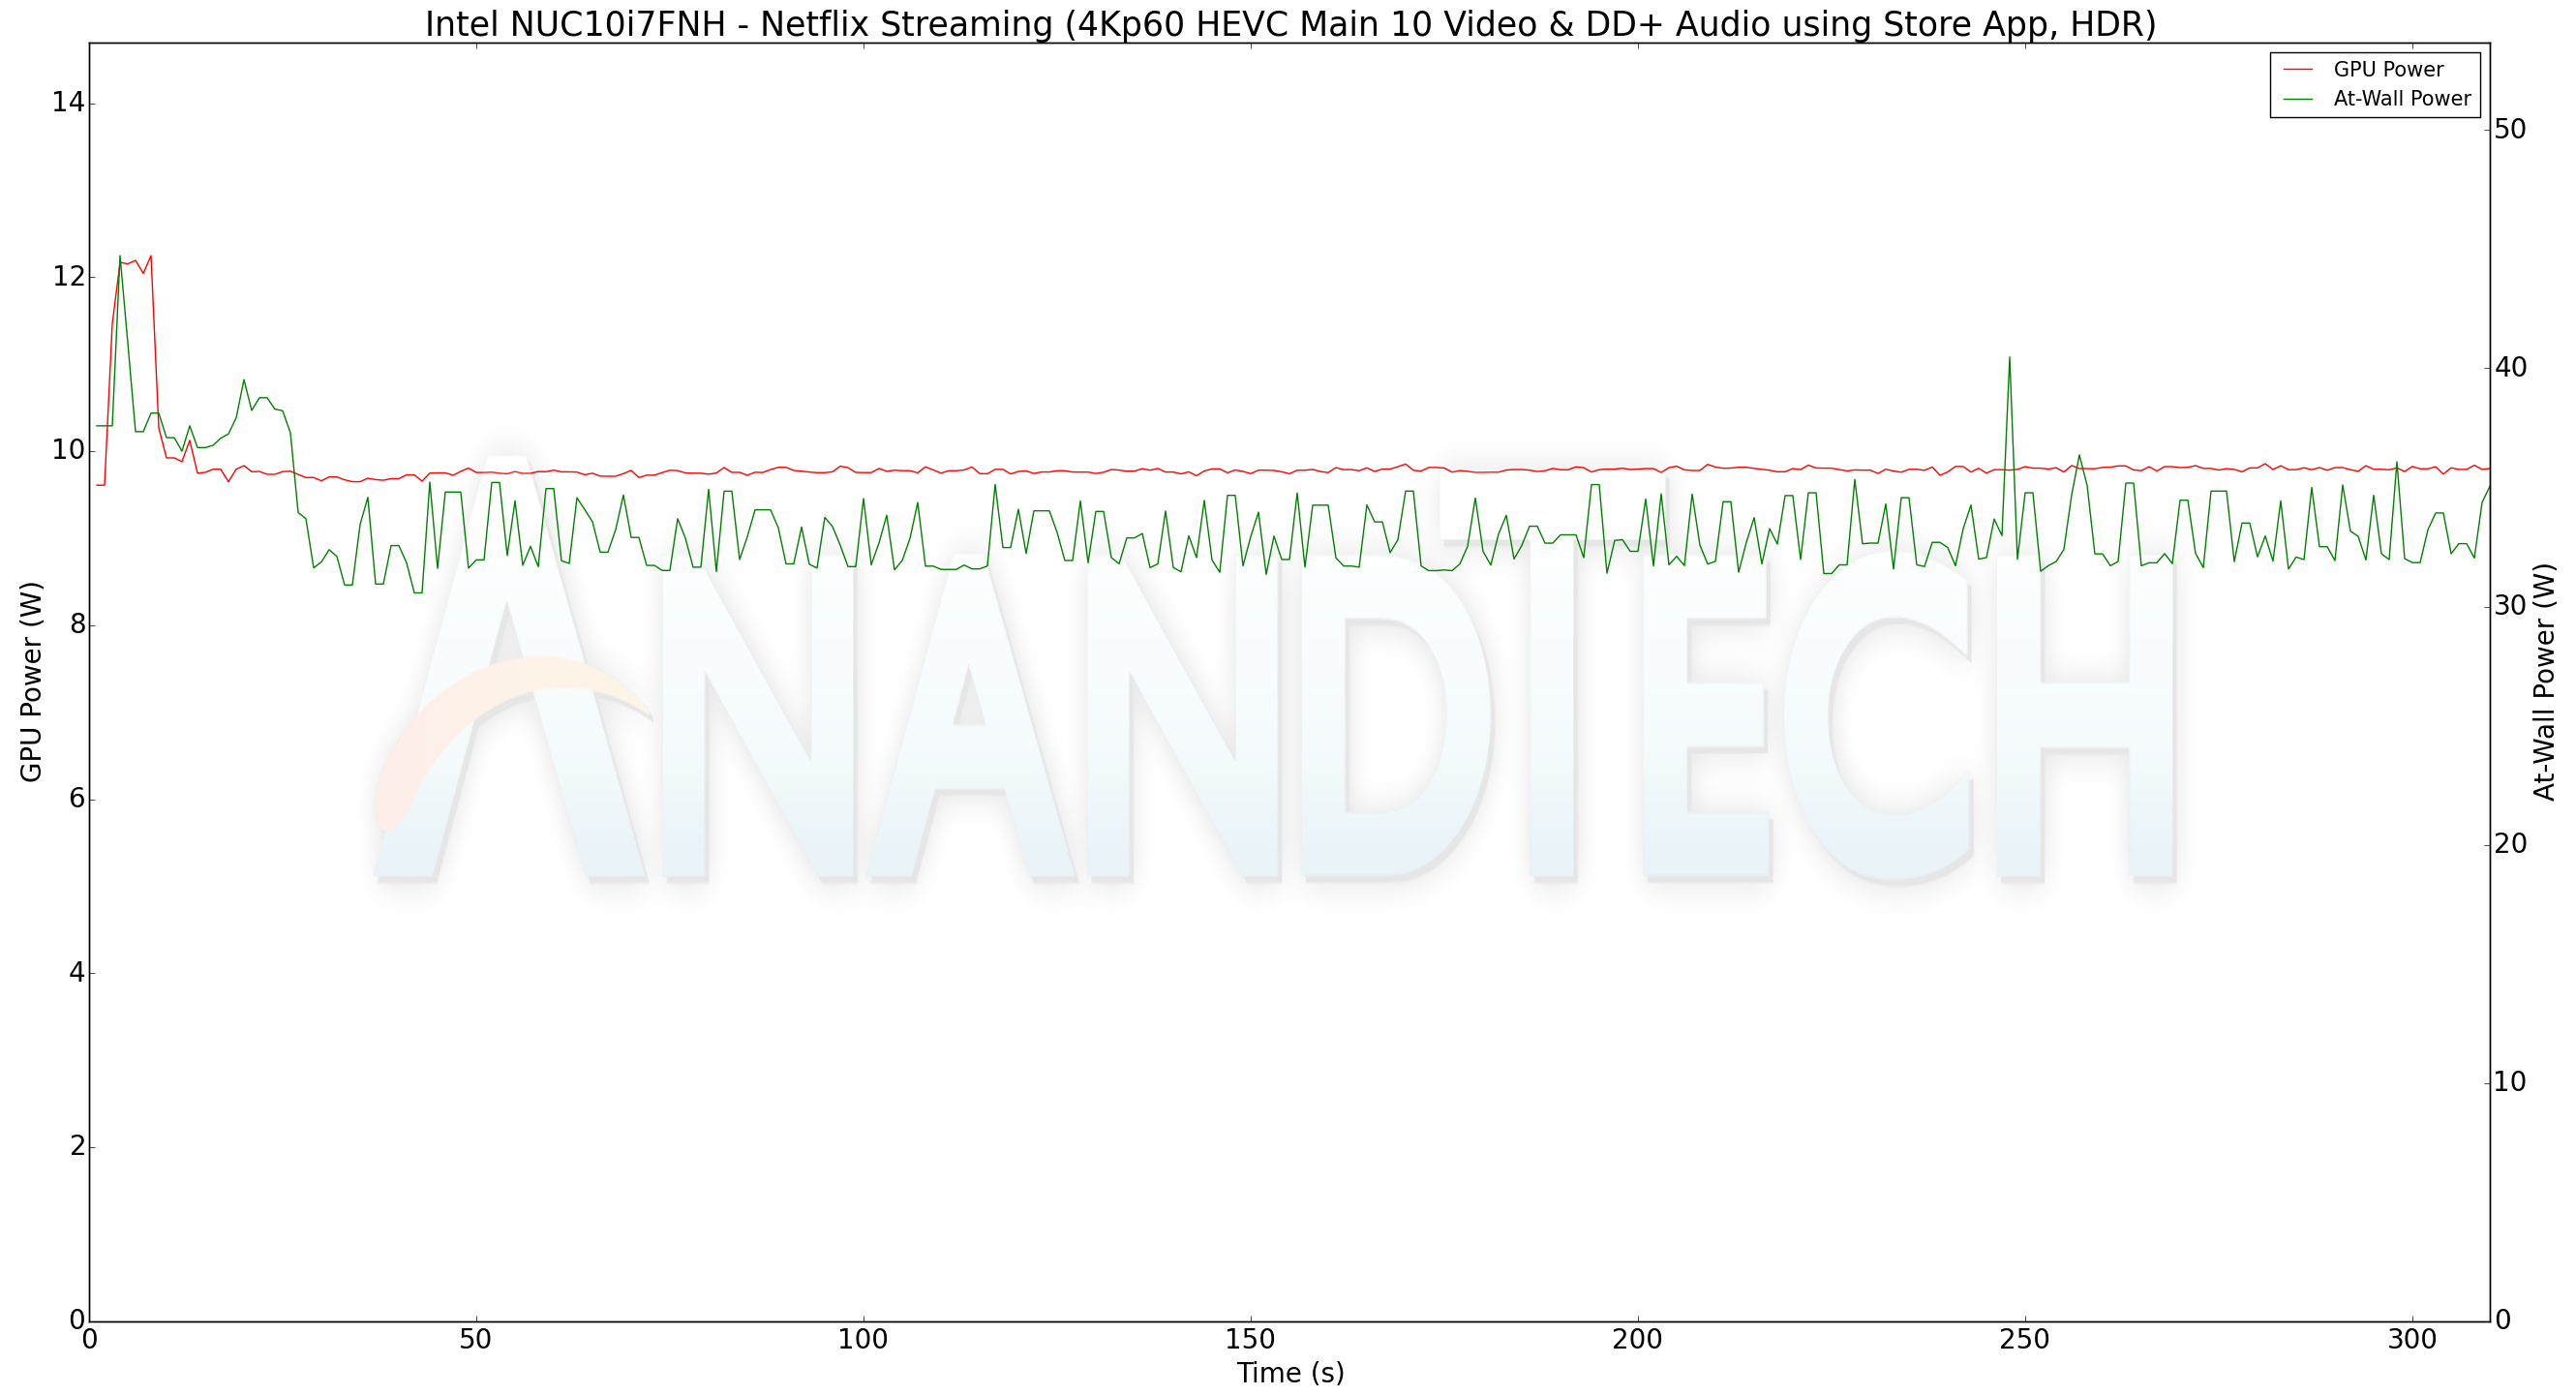
Similar to the YouTube playback case, the GPU and at-wall power consumption are slightly below 10W and around 33W respectively for the Netflix playback case.
HTPC Credentials - Local Media Playback and Video Processing
Evaluation of local media playback and video processing is done by playing back files encompassing a range of relevant codecs, containers, resolutions, and frame rates. A note of the efficiency is also made by tracking GPU usage and power consumption of the system at the wall. Users have their own preference for the playback software / decoder / renderer, and our aim is to have numbers representative of commonly encountered scenarios. Towards this, we played back the test streams using the following combinations:
- MPC-HC x64 1.8.5 + LAV Video Decoder (DXVA2 Native) + Enhanced Video Renderer - Custom Presenter (EVR-CP)
- MPC-HC x64 1.8.5 + LAV Video Decoder (D3D11) + madVR 0.92.17 (DXVA-Focused)
- MPC-HC x64 1.8.5 + LAV Video Decoder (D3D11) + madVR 0.92.17 (Lanczos-Focused)
- VLC 3.0.8
- Kodi 18.5
The thirteen test streams (each of 90s duration) were played back from the local disk with an interval of 30 seconds in-between. Various metrics including GPU power consumption and at-wall power consumption were recorded during the course of this playback. Prior to looking at the metrics, a quick summary of the decoding capabilities of the Intel UHD Graphics is useful to have for context.
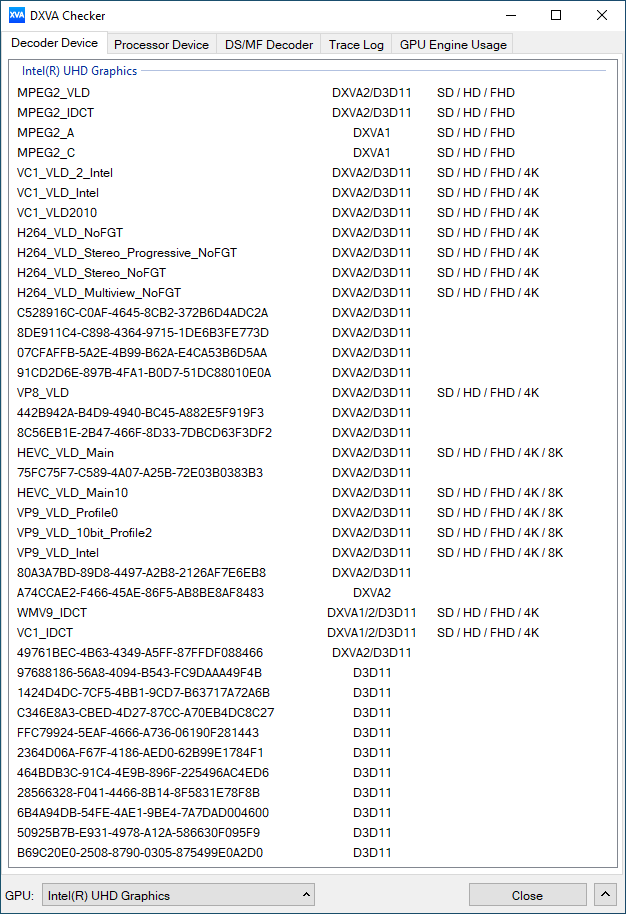
The Intel UHD Graphics GPU is no different from the GPUs in the Bean Canyon and Baby Canyon NUCs as far as video decoding capabilities are concerned. We have hardware acceleration for all common codecs including VP9 Profile 2.
All our playback tests were done with the desktop HDR setting turned on. It is possible for certain system configurations to have madVR automatically turn on/off the HDR capabilities prior to the playback of a HDR video, but, we didn't take advantage of that in our testing.
VLC and Kodi
VLC is the playback software of choice for the average PC user who doesn't need a ten-foot UI. Its install-and-play simplicity has made it extremely popular. Over the years, the software has gained the ability to take advantage of various hardware acceleration options. Kodi, on the other hand, has a ten-foot UI making it the perfect open-source software for dedicated HTPCs. Support for add-ons make it very extensible and capable of customization. We played back our test files using the default VLC and Kodi configurations, and recorded the following metrics.
| Video Playback Efficiency - VLC and Kodi | |||
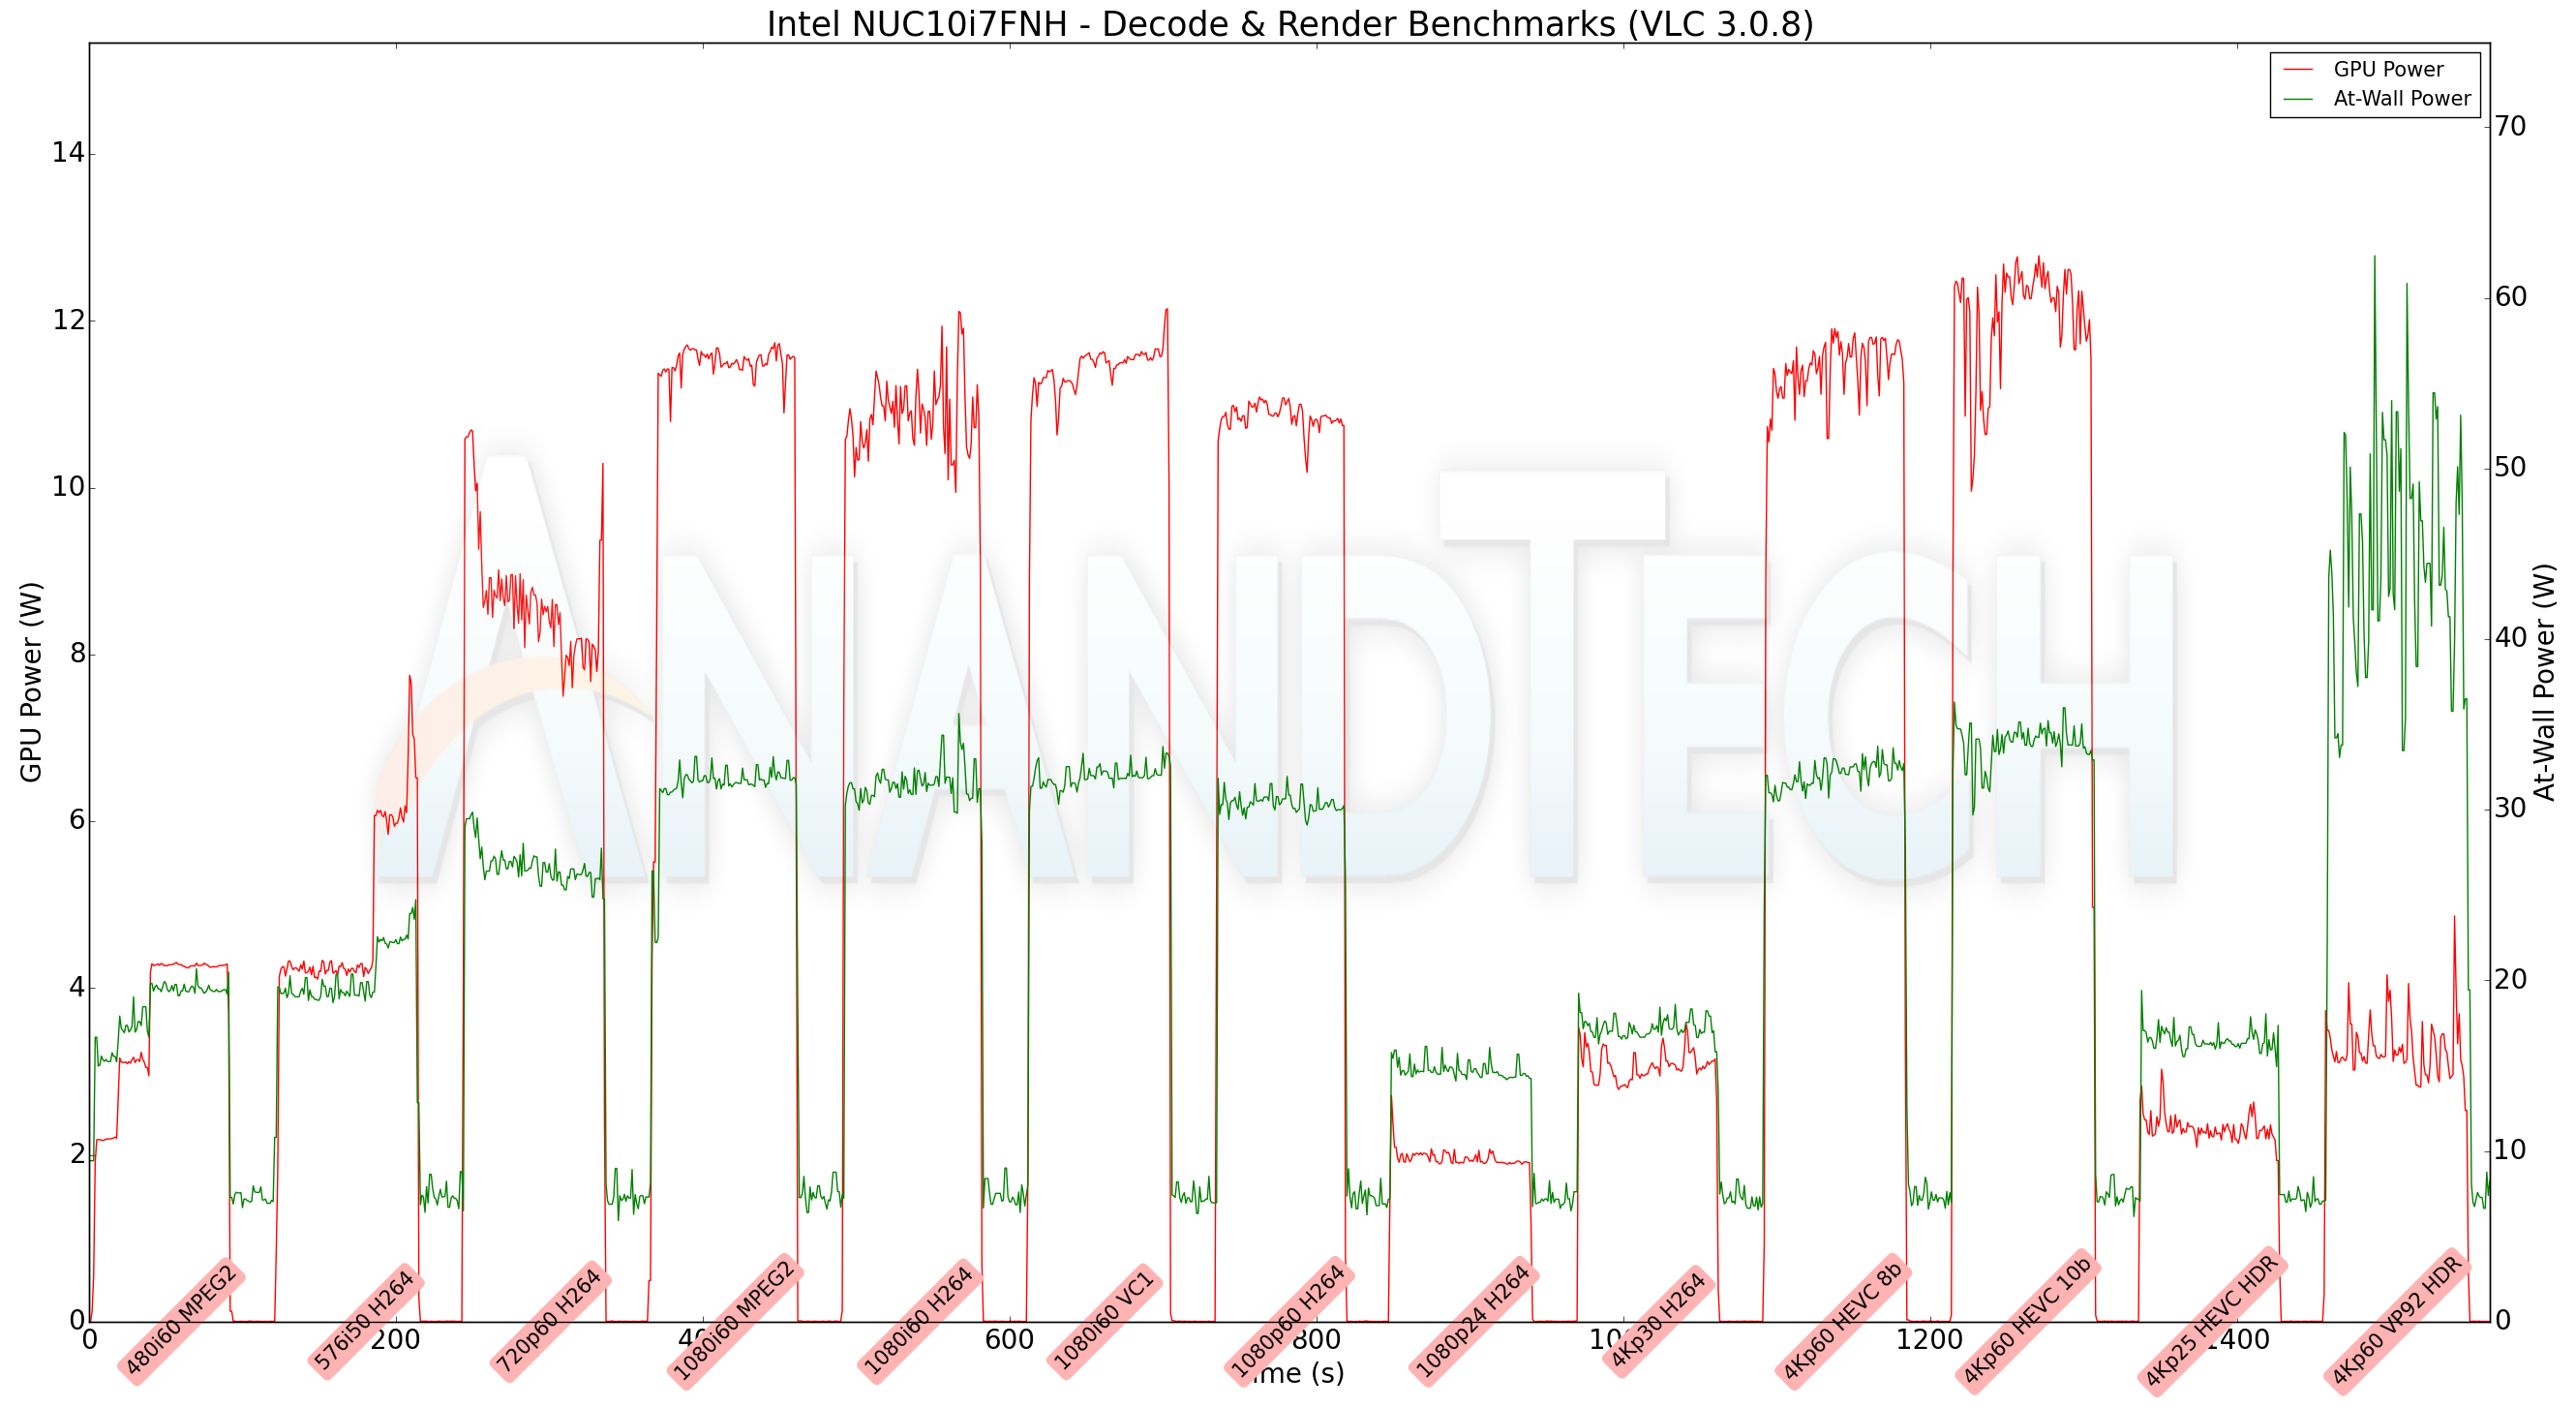
VLC doesn't seem to take advantage of VP9 Profile 2 hardware acceleration, while Kodi is able to play back all streams without any hiccups.
MPC-HC
MPC-HC offers an easy way to test out different combinations of decoders and renderers. The first configuration we evaluated is the default post-install scenario, with only the in-built LAV Video Decoder forced to DXVA2 Native mode. Two additional passes were done with different madVR configurations. In the first one (DXVA-focused), we configured madVR to make use of the DXVA-accelerated video processing capabilities as much as possible. In the second (Lanczos-focused), the image scaling algorithms were set to 'Lanczos 3-tap, with anti-ringing checked'. Chroma upscaling was configured to be 'BiCubic 75 with anti-ringing checked' in both cases. The metrics collected during the playback of the test files using the above three configurations are presented below.
| Video Playback Efficiency - MPC-HC with EVR-CP and madVR | |||
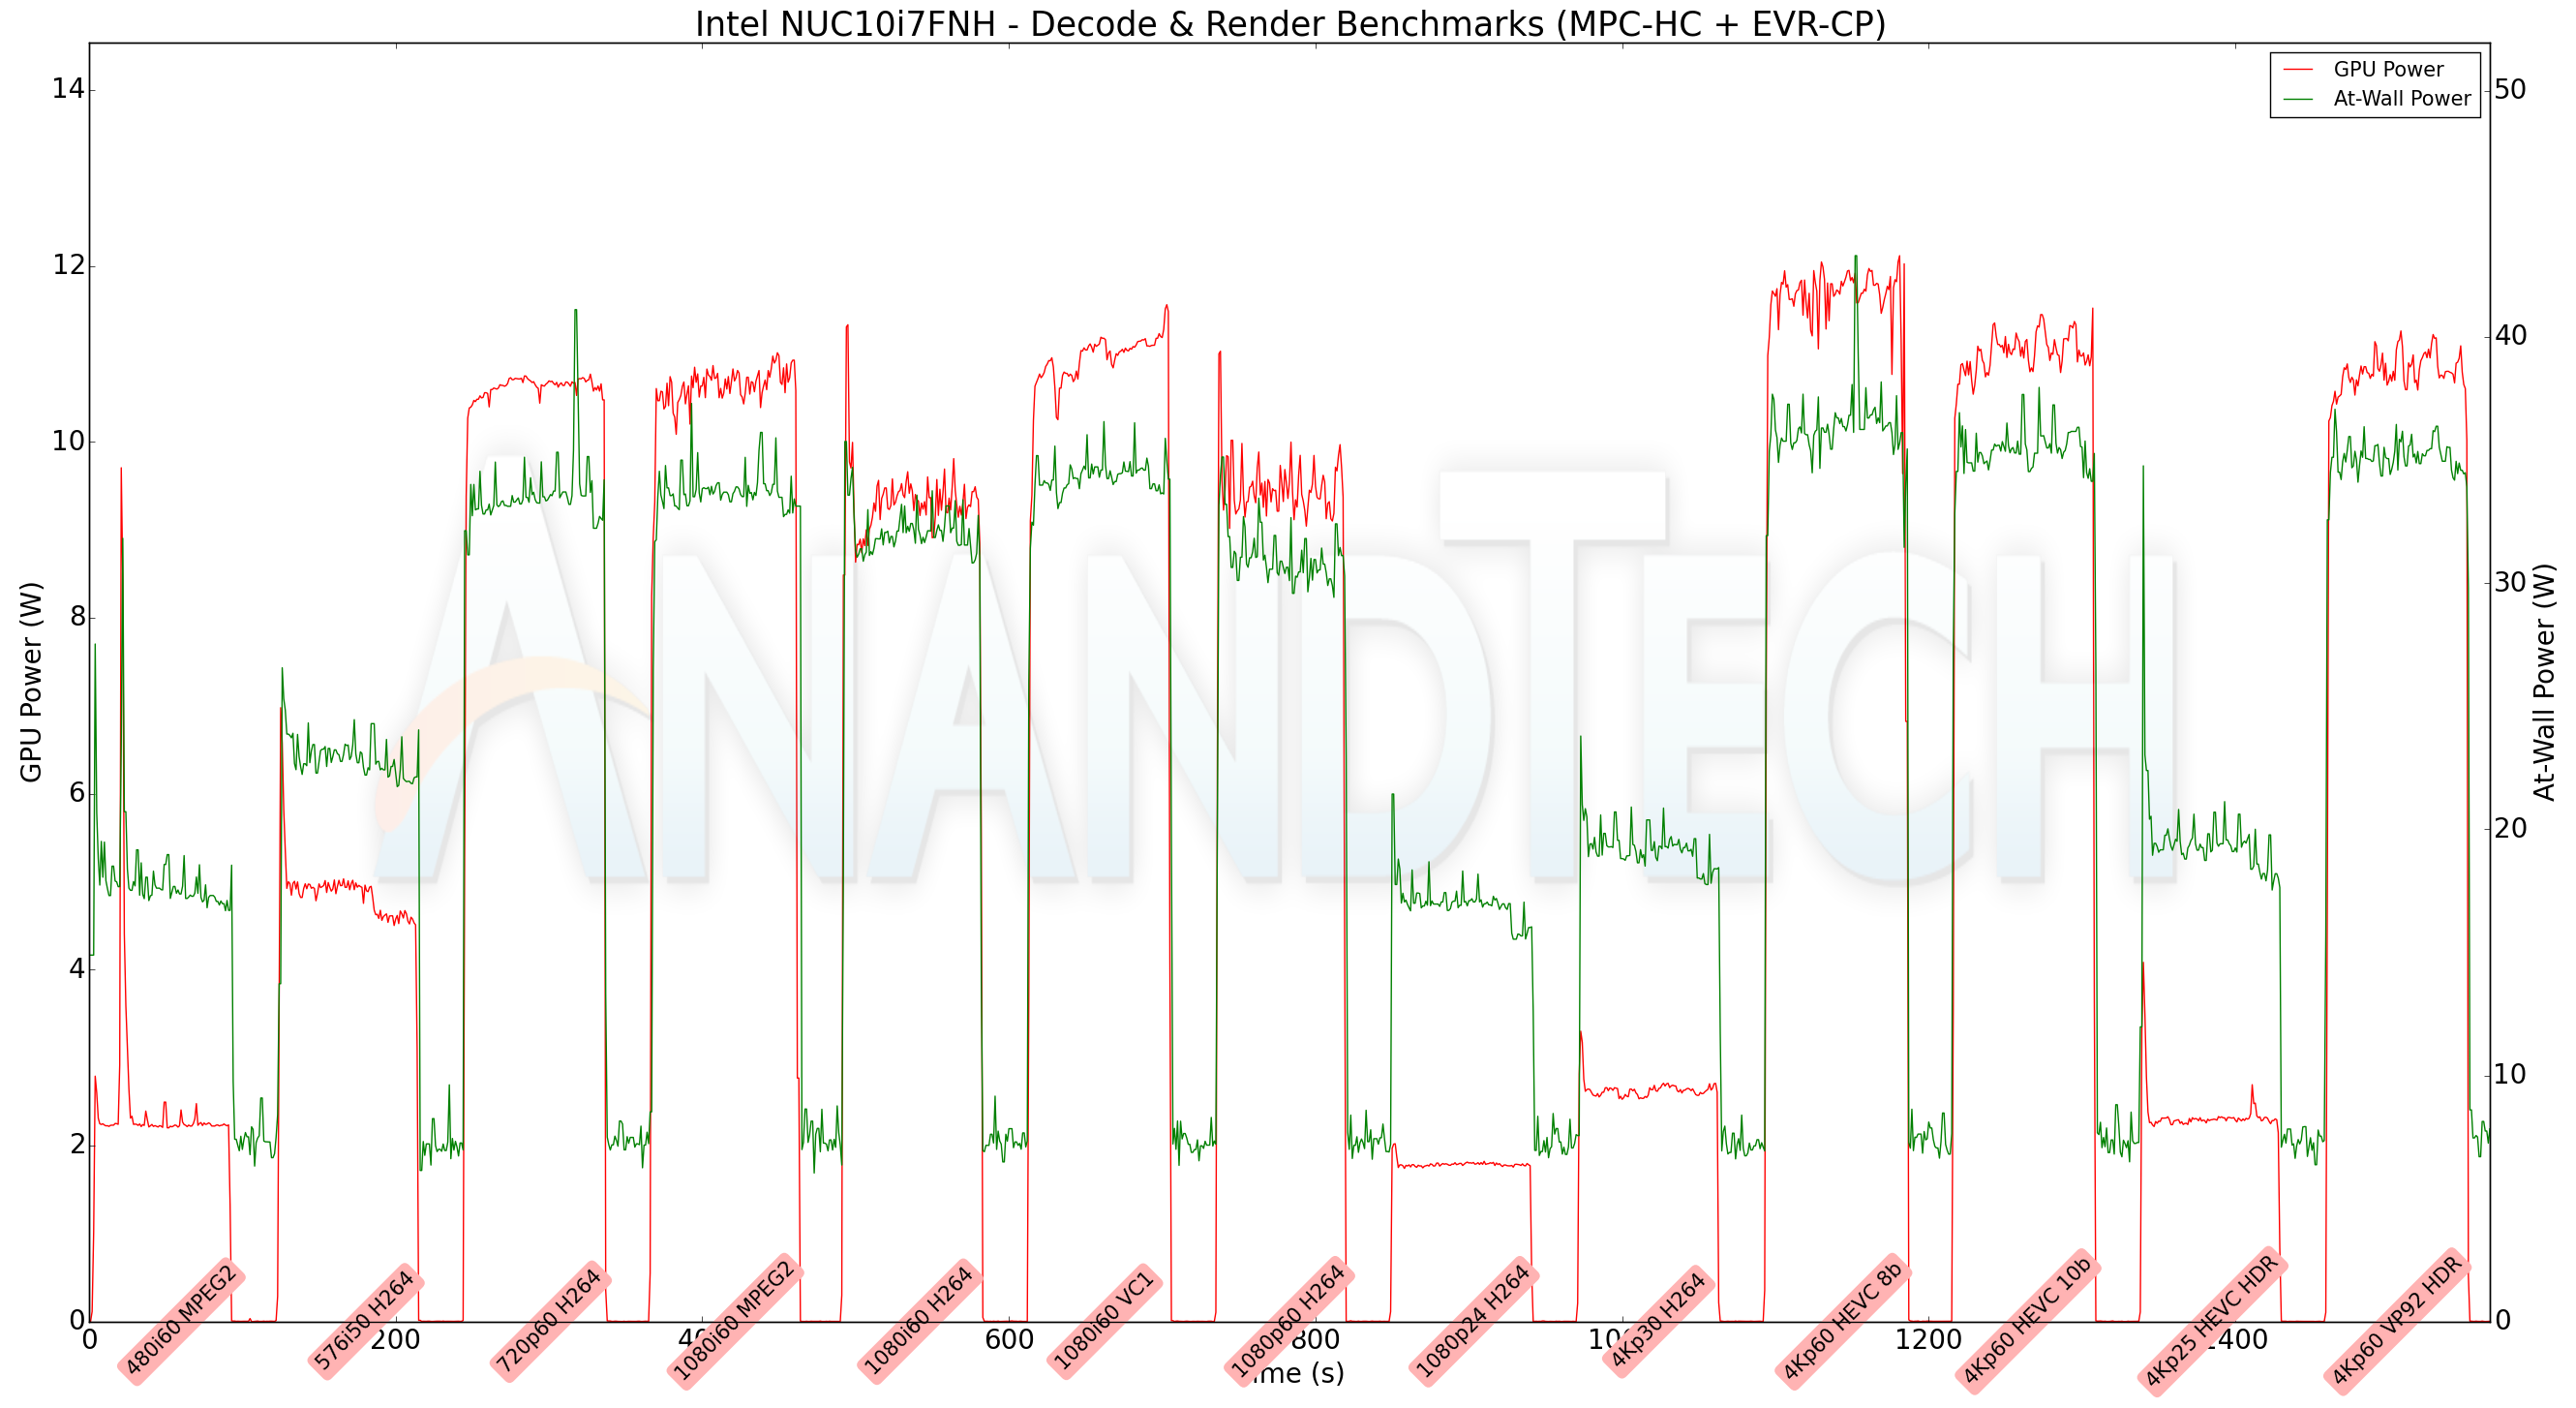
LAV Filters with EVR-CP is able to play back all streams without dropped frames, but madVR is a different story. Almost all streams 1080p and higher see varying levels of significant spikes in power consumption pointing to the decode and display chain struggling to keep up with the required presentation frame rate. Given that the GPU is weaker than the one in Bean Canyon, this is not a surprise. Overall, the Frost Canyon NUC is acceptable for a vanilla decode and playback device without extensive video post-processing.
Power Consumption and Thermal Performance
The power consumption at the wall was measured with a 4K display being driven through the HDMI port. In the graphs below, we compare the idle and load power of the Intel NUC10i7FNH (Frost Canyon) with other low power PCs evaluated before. For load power consumption, we ran the AIDA64 System Stability Test with various stress components, and noted the maximum sustained power consumption at the wall.
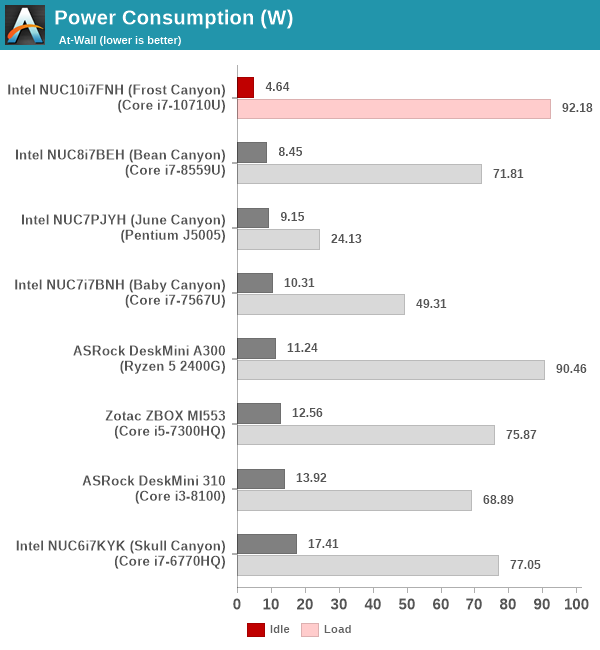
The usage of a PCIe 3.0 x2 NVMe SSD along with a low TDP processor (25W, compared to the 28W+ processors in the other systems, other than the June Canyon NUC) manufactured in a highly-optimized and power-efficient 14nm process result in the Frost Canyon NUC having a sub-5W idle power consumption even while driving a 4K display. The system is able to sustain 90W+ at the wall for a very brief duration only, with the power falling slightly south of 60W for sustained workloads.
Our thermal stress routine starts with the system at idle, followed by four stages of different system loading profiles using the AIDA64 System Stability Test (each of 30 minutes duration). In the first stage, we stress the CPU, caches and RAM. In the second stage, we add the GPU to the above list. In the third stage, we stress the GPU standalone. In the final stage, we stress all the system components (including the disks). Beyond this, we leave the unit idle in order to determine how quickly the various temperatures in the system can come back to normal idling range. The various clocks, temperatures and power consumption numbers for the system during the above routine are presented in the graphs below.
| Intel NUC10i7FNH (Frost Canyon) System Loading with the AIDA64 System Stability Test | |||
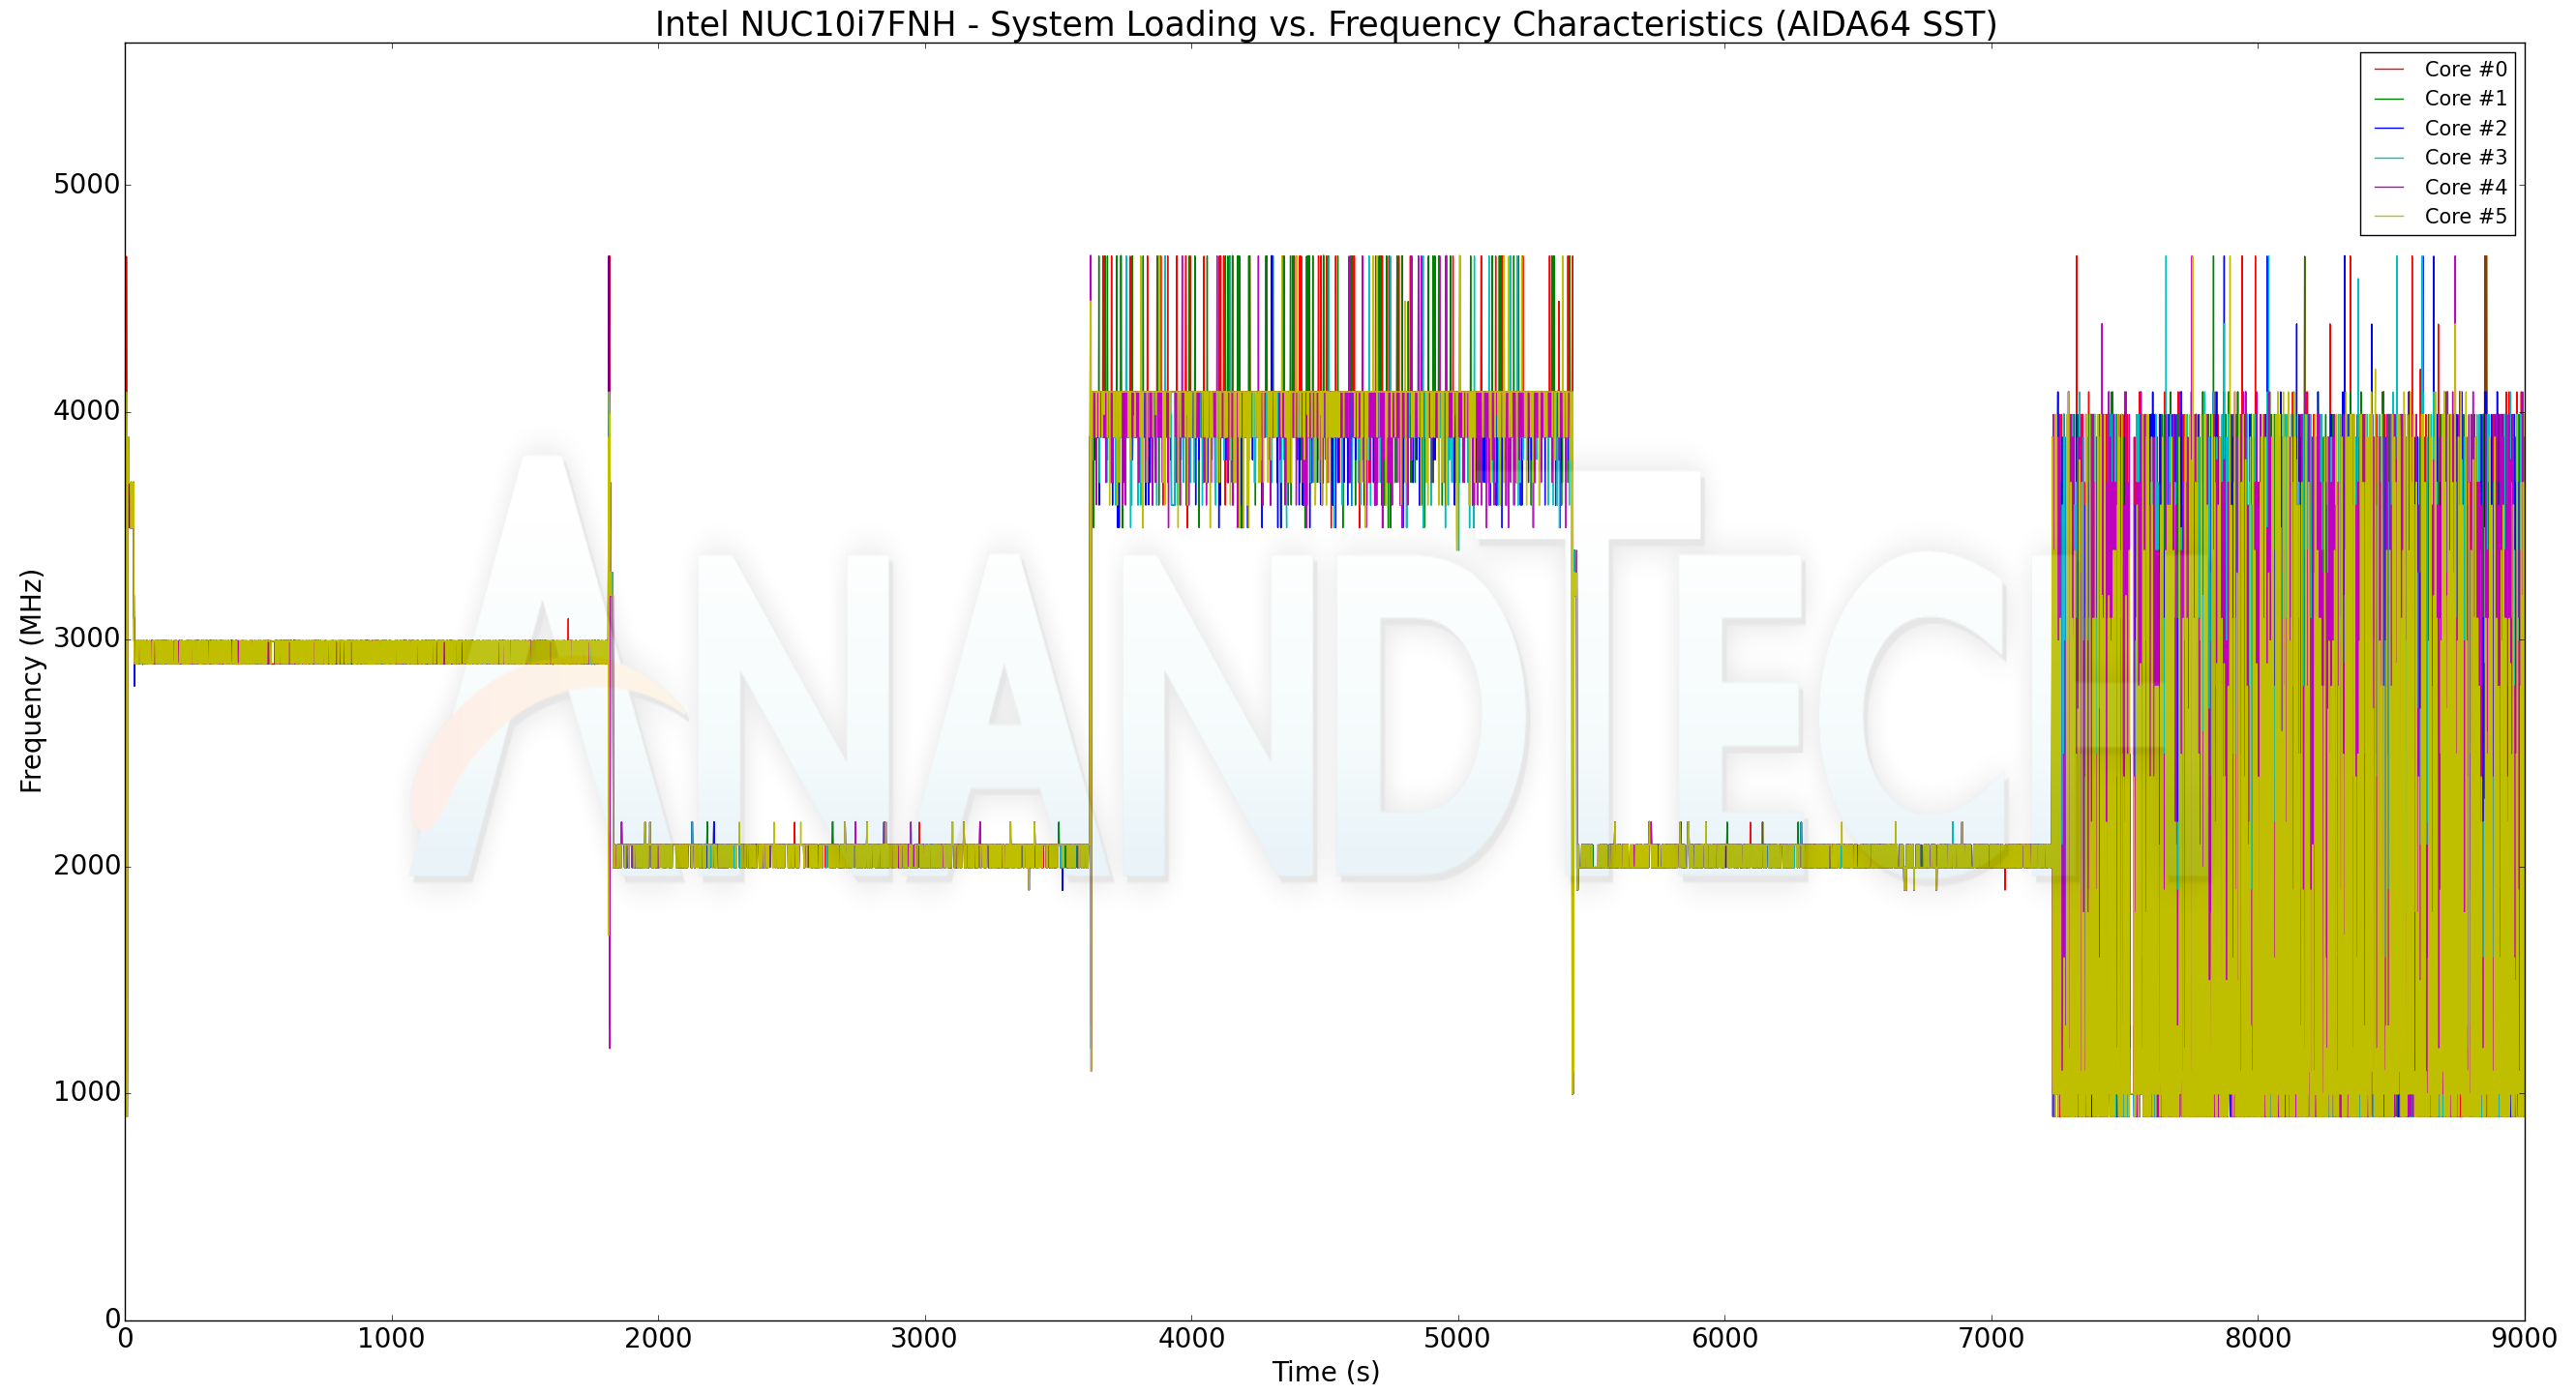
The frequencies adjust to ensure that the 30W PL1 is maintained. With just the CPU loaded, the cores can maintain around 3 GHz sustained. Adding the GPU brings the CPU cores down to 2 GHz. With only the GPU stressed, the CPU cores can stay close to their boost clocks without consuming much power. The thermal design is quite good, with the package temperature never above 90C for extended durations.
| Intel NUC10i7FNH (Frost Canyon) System Loading with Prime95 and Furmark | |||

Our custom stress test with Prime95 and Furmark shows similar characteristics. Frequencies get adjusted to maintain a 30W package power, and the package temperature does not cross 85C. Furmark loads the GPU more than the AIDA stress component, and hence, we see the CPU frequency drop down to around 1.5 GHz in this case.
Concluding Remarks
The NUC10i7FNH is the latest in the line-up of mainstream NUCs from Intel. Long a niche market that Intel has dominated both directly and indirectly via its own NUCs as well as its low-TDP processors, compared where things stood a few years back, consumers these days have a number of alternatives to the mainstream NUCs. We are not referring only to the NUC clones using Intel's U-series processors, but, also the new crop of Ryzen-based UCFF PCs. The new competition means that Intel has to deliver a package that delivers more value for money compared to previous NUC offerings.

While reviewing the Bean Canyon NUC, we had indicated that it was a compact powerhouse ticking the right boxes for multiple use-cases. The tangible benefit delivered by the 'NUC8' over its predecessor was the upgrading of all the external USB ports to USB 3.2 Gen 2 (10 Gbps), and the inclusion of a more powerful Wireless-AC 9560 WLAN component. Similarly, the Frost Canyon NUC10 carries over some of the important features and also provides some welcome upgrades:
- The top-level configuration with the Core i7-10710U is a 6C/12T processor compared to the 4C/8T Core i7-8559U in Bean Canyon
- The NUC10 makes the move to Wi-Fi 6 with the AX 201 WLAN component.
- The NUC10 officially supports 64GB of DRAM (the first NUC to do so)
- One of the front panel USB 3.2 Gen 2 (10 Gbps) ports is Type-C , which is very welcome given that Type-C peripherals are becoming more prevalent now.
- The Frost Canyon NUCs make use of the latest Titan Ridge Thunderbolt 3 controller (compared to Alpine Ridge in previous NUCs), though this is transparent to the end-users of host systems. (On the peripherals side, it enables devices such as docks to talk to both Thunderbolt 3 and USB host ports).
- The BIOS has new value additions such as RAM disk creation support and pre-boot iSCSI volume mounting.
However, while the NUC8 was an upgrade over NUC7 in every respect, the Frost Canyon NUC10 slips up a little. Intel's 10th generation U-series processors come in two different versions – the 10nm Ice Lake and the 14nm Comet Lake. Intel's high-end Iris Graphics is available only on Ice Lake, and unfortunately, the Frost Canyon is based on Comet Lake. This means that, for a variety of graphics intensive workloads, the NUC10 actually performs worse than the Iris Plus graphics-equipped NUC8.
The hexa-core CPU is a nice upgrade, but, as both BAPCo SYSmark 2018 and UL's PCMark 10 show, the current typical workloads for office PCs and other generic SFF PC applications are not really capable of putting the extra cores to good use. That said, some specific tasks that scale nicely with thread counts (such as the compression and cryptography operations) can take full advantage of the capabilities offered by the Core i7-10710U in the Frost Canyon NUC10i7FNH. The availability of six cores might make the NUC an attractive option for home labs focusing on virtualization, but the requirements of the VM workloads may also need to be kept in mind given the 30W PL1 limit of the processor.
Overall, the Frost Canyon NUC10i7FNH is a mixed bag. Given a choice between, say, the Kaby Lake-based Baby Canyon NUC7 and the Coffee Lake-based Bean Canyon NUC8s, it would be a no-brainer to go for the Bean Canyon. However, choosing between Bean Canyon and Frost Canyon is not that straightforward. While Frost Canyon delivers upgrades in many respects, the retrogression in the GPU area may make the Bean Canyon NUC at a lower price point an attractive alternative. In some respects Intel has traded off GPU performance for more CPU performance, and I'm not sure that's what their NUCs really needed.
On the pricing front, the NUC10i7FNH barebones version is available for around $605, while the NUC8i7BEH is around $50 cheaper. While the two additional CPU cores and Wi-Fi 6 support can definitely justify the additional cost, it is up to the consumer to decide whether forsaking some GPU performance is also worth it.


