Original Link: https://www.anandtech.com/show/15715/amds-new-epyc-7f52-reviewed-the-f-is-for-frequency
AMD’s New EPYC 7F52 Reviewed: The F is for ᴴᴵᴳᴴ Frequency
by Dr. Ian Cutress on April 14, 2020 9:45 AM EST- Posted in
- CPUs
- AMD
- Enterprise
- Enterprise CPUs
- EPYC
- SP3r2
- CPU Frequency
- Rome
- 7Fx2
Everyone wants a fast processor. The ability to get more stuff done is one of a number of guiding principles of business. However, business also needs consistency, safety and security, which is why having enterprise-class processors is often a requirement in the back-end infrastructure. These processors, with lots of cores, aren’t as fast as consumer processors, so it becomes a tussle whether it makes sense to go fast without security, or to play it safe with a proven platform. With AMD’s new 7F processors, the aim is to provide that proven platform with super-fast cores with lots of cache. We’ve got the 7F52 in for testing today.
The Enterprise Market Wants It All
The nature of enterprise processors in recent generations has tended towards more cores and more cache. As power budgets have increased, in order to ensure stability and get the best efficiency points, the solution has been to add more cores. However, there are still markets that want high frequency components, and quite often users will look at consumer hardware, which doesn’t offer the trimmings of the enterprise world, such as ECC memory, RAS features, management, and high-speed IO. We’ve seen OEMs build servers on super rare ‘consumer-grade’ processors, like the auction-only 5 GHz 14-core parts that offer the peak of performance, but fall down on basic enterprise features, such as ECC memory.
To that end, AMD’s Enterprise division has been developing some high-frequency processors within its EPYC line of hardware to address this market. We saw with the first generation ‘Naples’ EPYC processors AMD come out with a special EPYC 7371 processor, which offered 16 cores but had +700 MHz on the base frequency and +900 MHz on the turbo frequency compared to the next best 16-core part, and the tradeoff was only +30 W of power and paying a bit extra. At the time the EPYC 7371, which was launched several months after the rest of the product line, was a test run for what is this new line of 7F ‘high frequency’ processors.
AMD 7F and 7H: Targeting High Performance
The best way to consider AMD’s EPYC processor line, especially for the second generation ‘Rome’ hardware, is in four segments.
First is the main stack. These are the regular processors for the majority of the market, from the 7252 with eight cores all the way up to the 7742 with 64 cores. These are all dual-socket compatible, and are anywhere from 155 W to 225 W (except the 7252 and 7262 which are 120 W).
| AMD EPYC 7002 'Rome' Processors (2P) | ||||||
| Cores Threads |
Frequency (GHz) | L3 | TDP | Price | ||
| Base | Max | |||||
| EPYC 7742 | 64 / 128 | 2.25 | 3.40 | 256 MB | 225 W | $6950 |
| EPYC 7702 | 64 / 128 | 2.00 | 3.35 | 256 MB | 200 W | $6450 |
| EPYC 7642 | 48 / 96 | 2.30 | 3.20 | 256 MB | 225 W | $4775 |
| EPYC 7552 | 48 / 96 | 2.20 | 3.30 | 192 MB | 200 W | $4025 |
| EPYC 7542 | 32 / 64 | 2.90 | 3.40 | 128 MB | 225 W | $3400 |
| EPYC 7502 | 32 / 64 | 2.50 | 3.35 | 128 MB | 200 W | $2600 |
| EPYC 7452 | 32 / 64 | 2.35 | 3.35 | 128 MB | 155 W | $2025 |
| EPYC 7402 | 24 / 48 | 2.80 | 3.35 | 128 MB | 155 W | $1783 |
| EPYC 7352 | 24 / 48 | 2.30 | 3.20 | 128 MB | 180 W | $1350 |
| EPYC 7302 | 16 / 32 | 3.00 | 3.30 | 128 MB | 155 W | $978 |
| EPYC 7282 | 16 / 32 | 2.80 | 3.20 | 64 MB | 120 W | $650 |
| EPYC 7272 | 12 / 24 | 2.90 | 3.20 | 64 MB | 155 W | $625 |
| EPYC 7262 | 8 / 16 | 3.20 | 3.40 | 128 MB | 120 W | $575 |
| EPYC 7252 | 8 / 16 | 3.10 | 3.20 | 64 MB | 120 W | $475 |
Second are the single socket processors. These are variants of the main stack but designated with a P at the end, as these are built for systems that only require a single processor. The benefit here is that the P processors are actually cheaper ($2600 for the 32-core 7502 compared to $2300 for the 7502P) if the customer can guarantee they never need a dual socket design. These also go from 8 cores all the way up to 64 cores.
| AMD EPYC 7002 Rome Processors (1P) | ||||||
| Cores Threads |
Frequency (GHz) | L3 | TDP | Price | ||
| Base | Max | |||||
| EPYC 7702P | 64 / 128 | 2.00 | 3.35 | 256 MB | 200 W | $4425 |
| EPYC 7502P | 32 / 64 | 2.50 | 3.35 | 128 MB | 200 W | $2300 |
| EPYC 7402P | 24 / 48 | 2.80 | 3.35 | 128 MB | 200 W | $1250 |
| EPYC 7302P | 16 / 32 | 3.00 | 3.30 | 128 MB | 155 W* | $825 |
| EPYC 7232P | 8 / 16 | 3.10 | 3.20 | 32 MB | 120 W | $450 |
| *170W TDP mode also available | ||||||
Third is the 7H family of processors, which as it stands only has one member right now. This was launched a couple of months after the first two segments, and the ‘H’ stands for High Performance Computing. The power limits of this chip has increased up to 280 W, and the goal is to drive a higher sustained frequency than the regular parts. For example, the 7742 has a base frequency of 2.25 GHz at 225W, but the 7H12 has a base frequency of 2.60 GHz at 280 W. The 7H processors aren’t on general retail as far as we can tell, but specific customers can request them.
| AMD EPYC 7H Rome Processors (1P) | ||||||
| Cores Threads |
Frequency (GHz) | L3 | TDP | Price | ||
| Base | Max | |||||
| EPYC 7H12 | 64 / 128 | 2.60 | 3.30 | 256 MB | 280 | $? |
Fourth is the newest set of hardware, the 7F family. The F in this case is for Frequency, and these parts are spiritual successors to the 7371 in the last generation: a lot more base frequency and a lot higher turbo for the consumer to use. AMD is also equipping these processors with lots of cache, so the cache per core can effectively quadruple.
There are three members to the Rome 7F family:
| AMD EPYC 7F Rome Processors (1P) | ||||||||
| Cores Threads |
Frequency (GHz) | L3 | TDP | Chiplets | Cores per CCX |
Price | ||
| Base | Max | |||||||
| EPYC 7F72 | 24 / 48 | 3.20 | 3.70 | 192 MB | 240 W | 6 | 2 | $2450 |
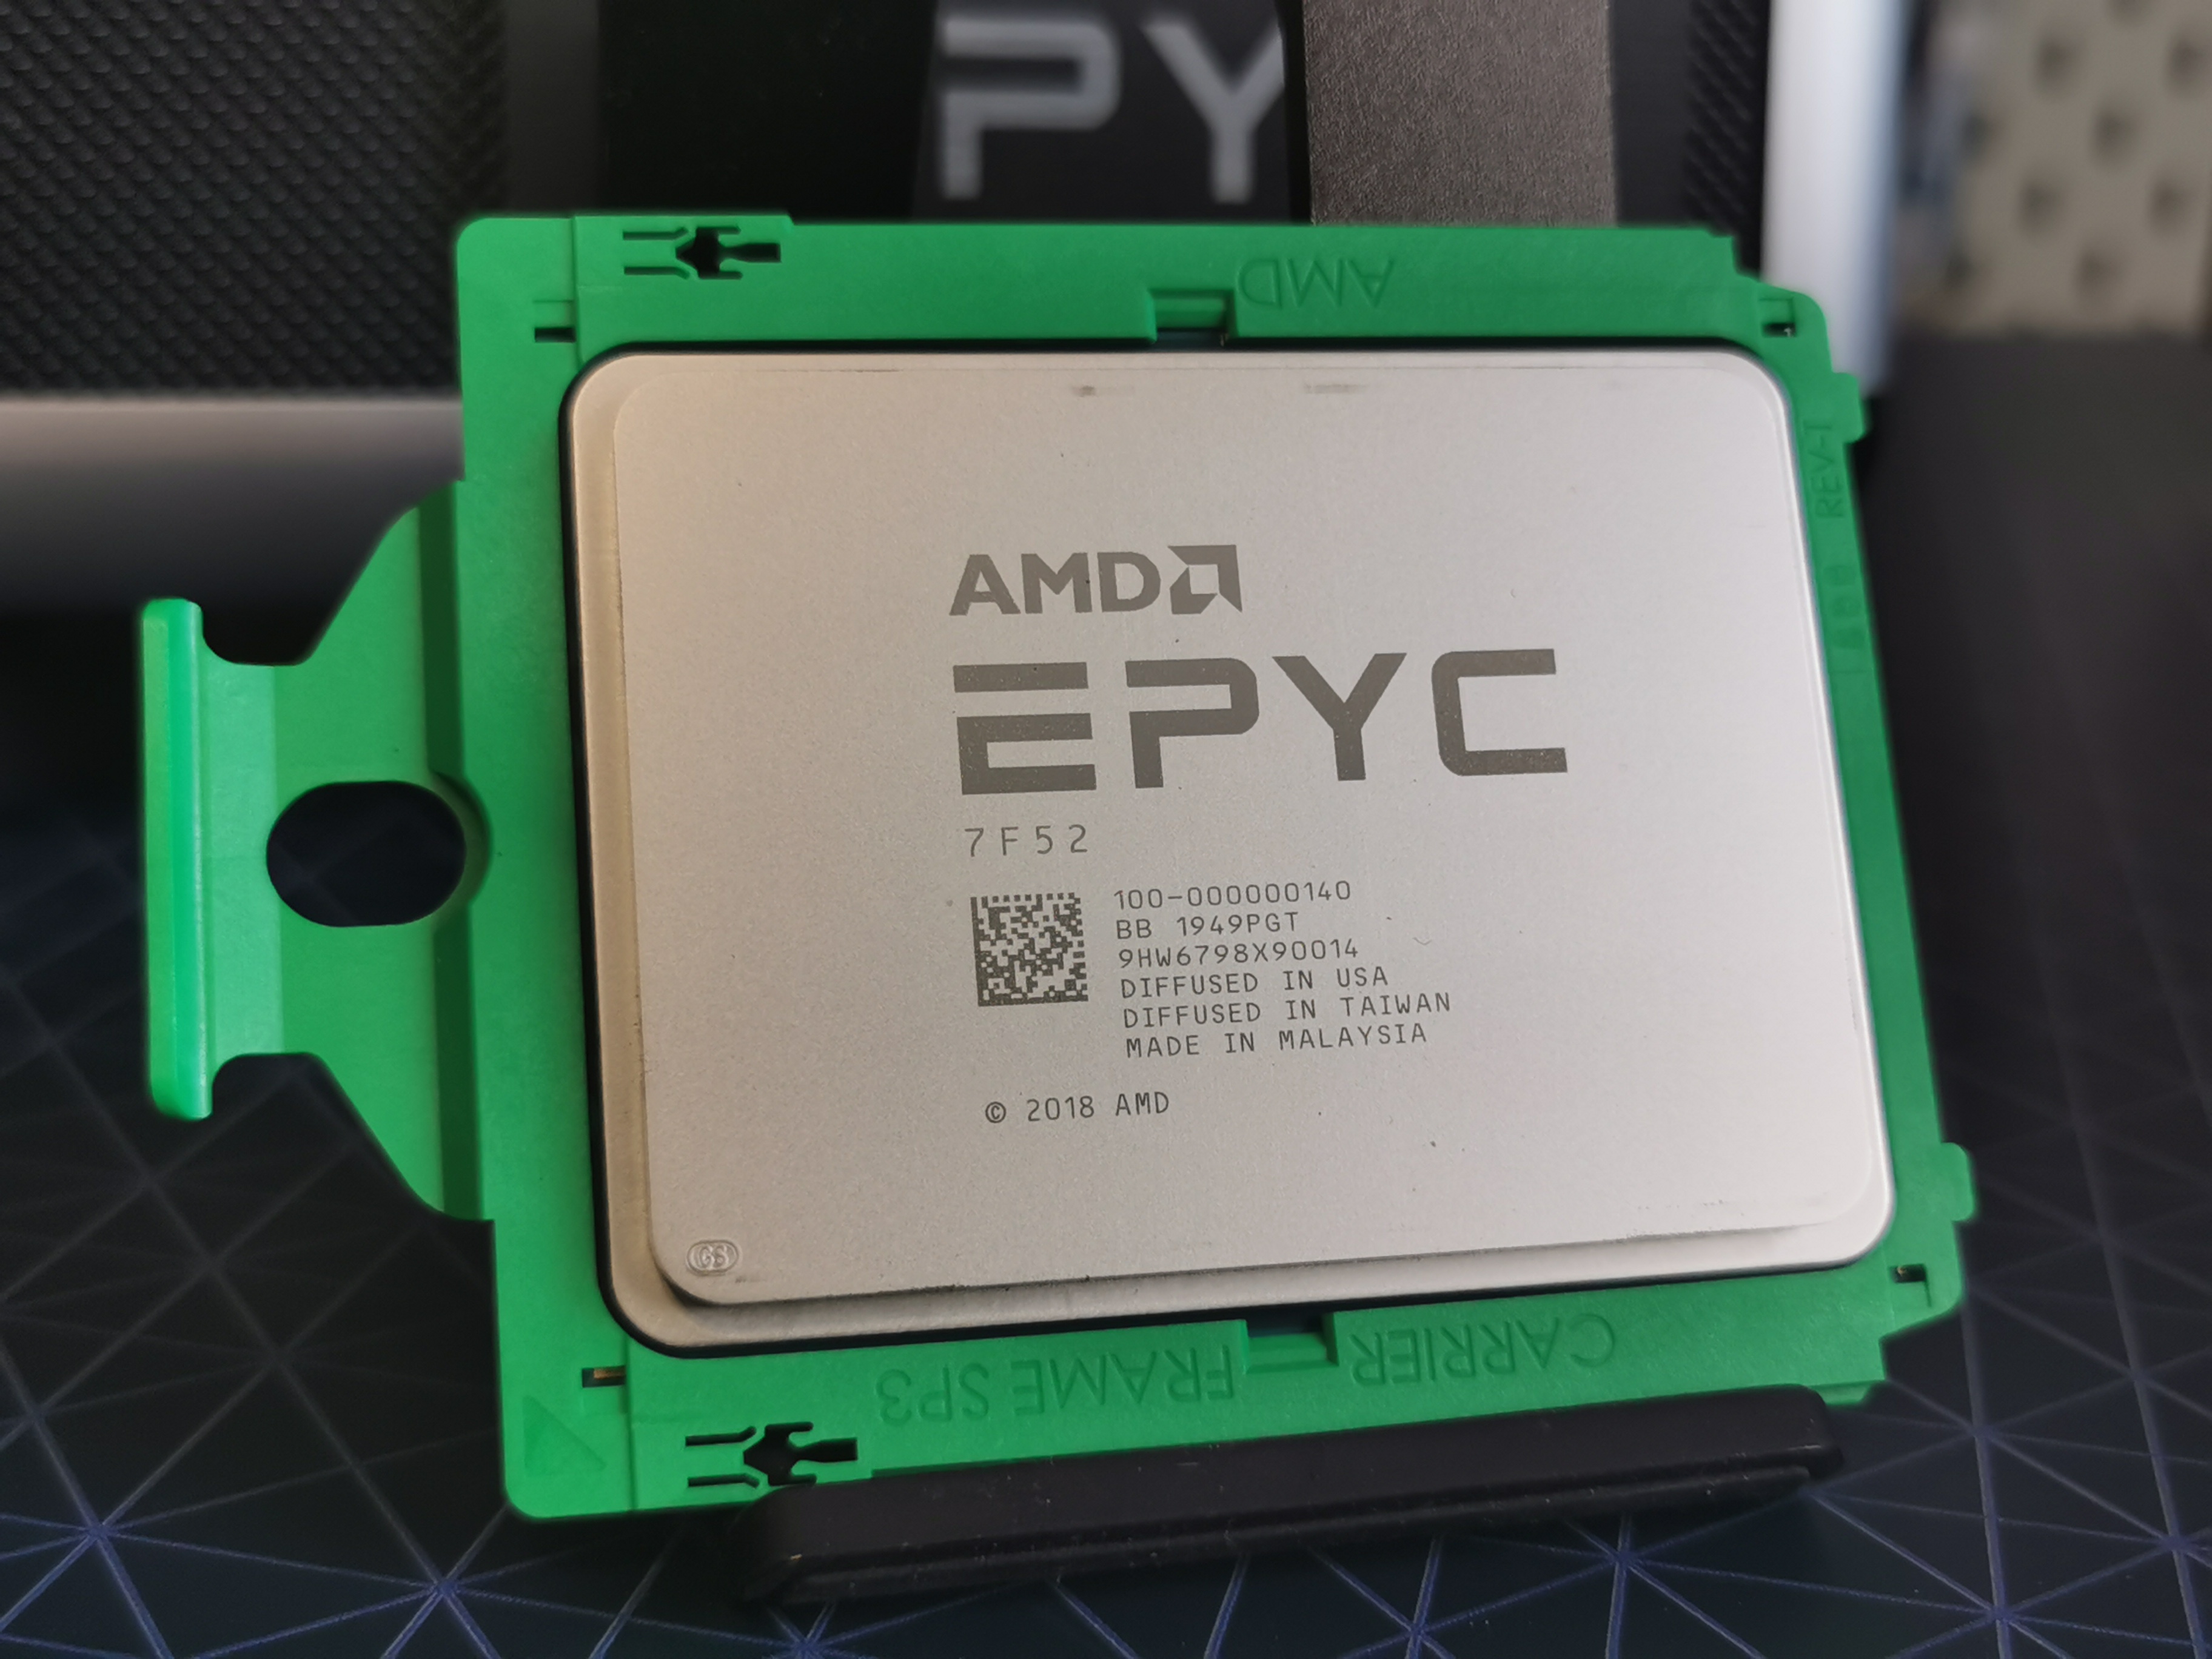
| EPYC 7F52 | 16 / 32 | 3.50 | 3.90 | 256 MB | 240 W | 8 | 1 | $3100 |
| EPYC 7F32 | 8 / 16 | 3.70 | 3.90 | 128 MB | 180 W | 4 | 1 | $2100 |
These processors do look a little confusing.
For the 8 core 7F32 and the 16 core 7F52, AMD is enabling 1 core per CCX, or 2 cores per chiplet, which means the equivalent of 16 MB of L3 cache per core. This is four times as much as what any other AMD EPYC processor gets.
The 24 core 7F72 is cheaper than the 16 core, as AMD is adjusting the level of cache on offer here to 192 MB. This means that this processor only has six of the eight chiplets active, and each CCX will have two cores active (6 chiplets * 2 CCX per chiplet * 2 cores per CCX = 24). The frequency is a little bit lower because of the increased active core density, so along with the decreased cache, AMD felt the need to price this one below that of the 7F52.
For this review, we’re testing the 7F52 processors. Compared to the base 7302 16-core that AMD offers, this means another +500 MHz on the base frequency, and +600 MHz on the turbo frequency, but also going up from 155 W to 225 W.
Naturally some of the key comparison points for the 7F52 CPU are going to be equivalent 16-core CPUs from Intel, such as the new Xeon Gold 6226R, or comparisons to 28/32 core options from both Intel and AMD.
| 7F52 2P Comparison Points | ||||
| AMD 7F52 (2P) |
AMD 7601 |
AnandTech | Intel 8280 |
Intel 6226R (2P) |
| 2 x 16 / 32 | 32 / 64 | Cores / Threads | 28 / 56 | 2 x 16 / 32 |
| 3500 | 2200 | Base Frequency | 2700 | 2900 |
| 3900 | 3200 | Turbo Frequency | 4000 | 3900 |
| 2 x 256 MB | 64 MB | L3 Cache | 38.5 MB | 2 x 22 MB |
| DDR4-3200 | DDR4-2666 | DRAM Support | DDR4-2933 | DDR4-2933 |
| 2 TB / socket | 2 TB | DRAM Capacity | 1 TB | 1 TB / socket |
| 2 x 240 W | 180 W | TDP | 205 W | 2 x 150 W |
| 2 x $3100 | $4200 | Price | $10008 | 2 x $1300 |
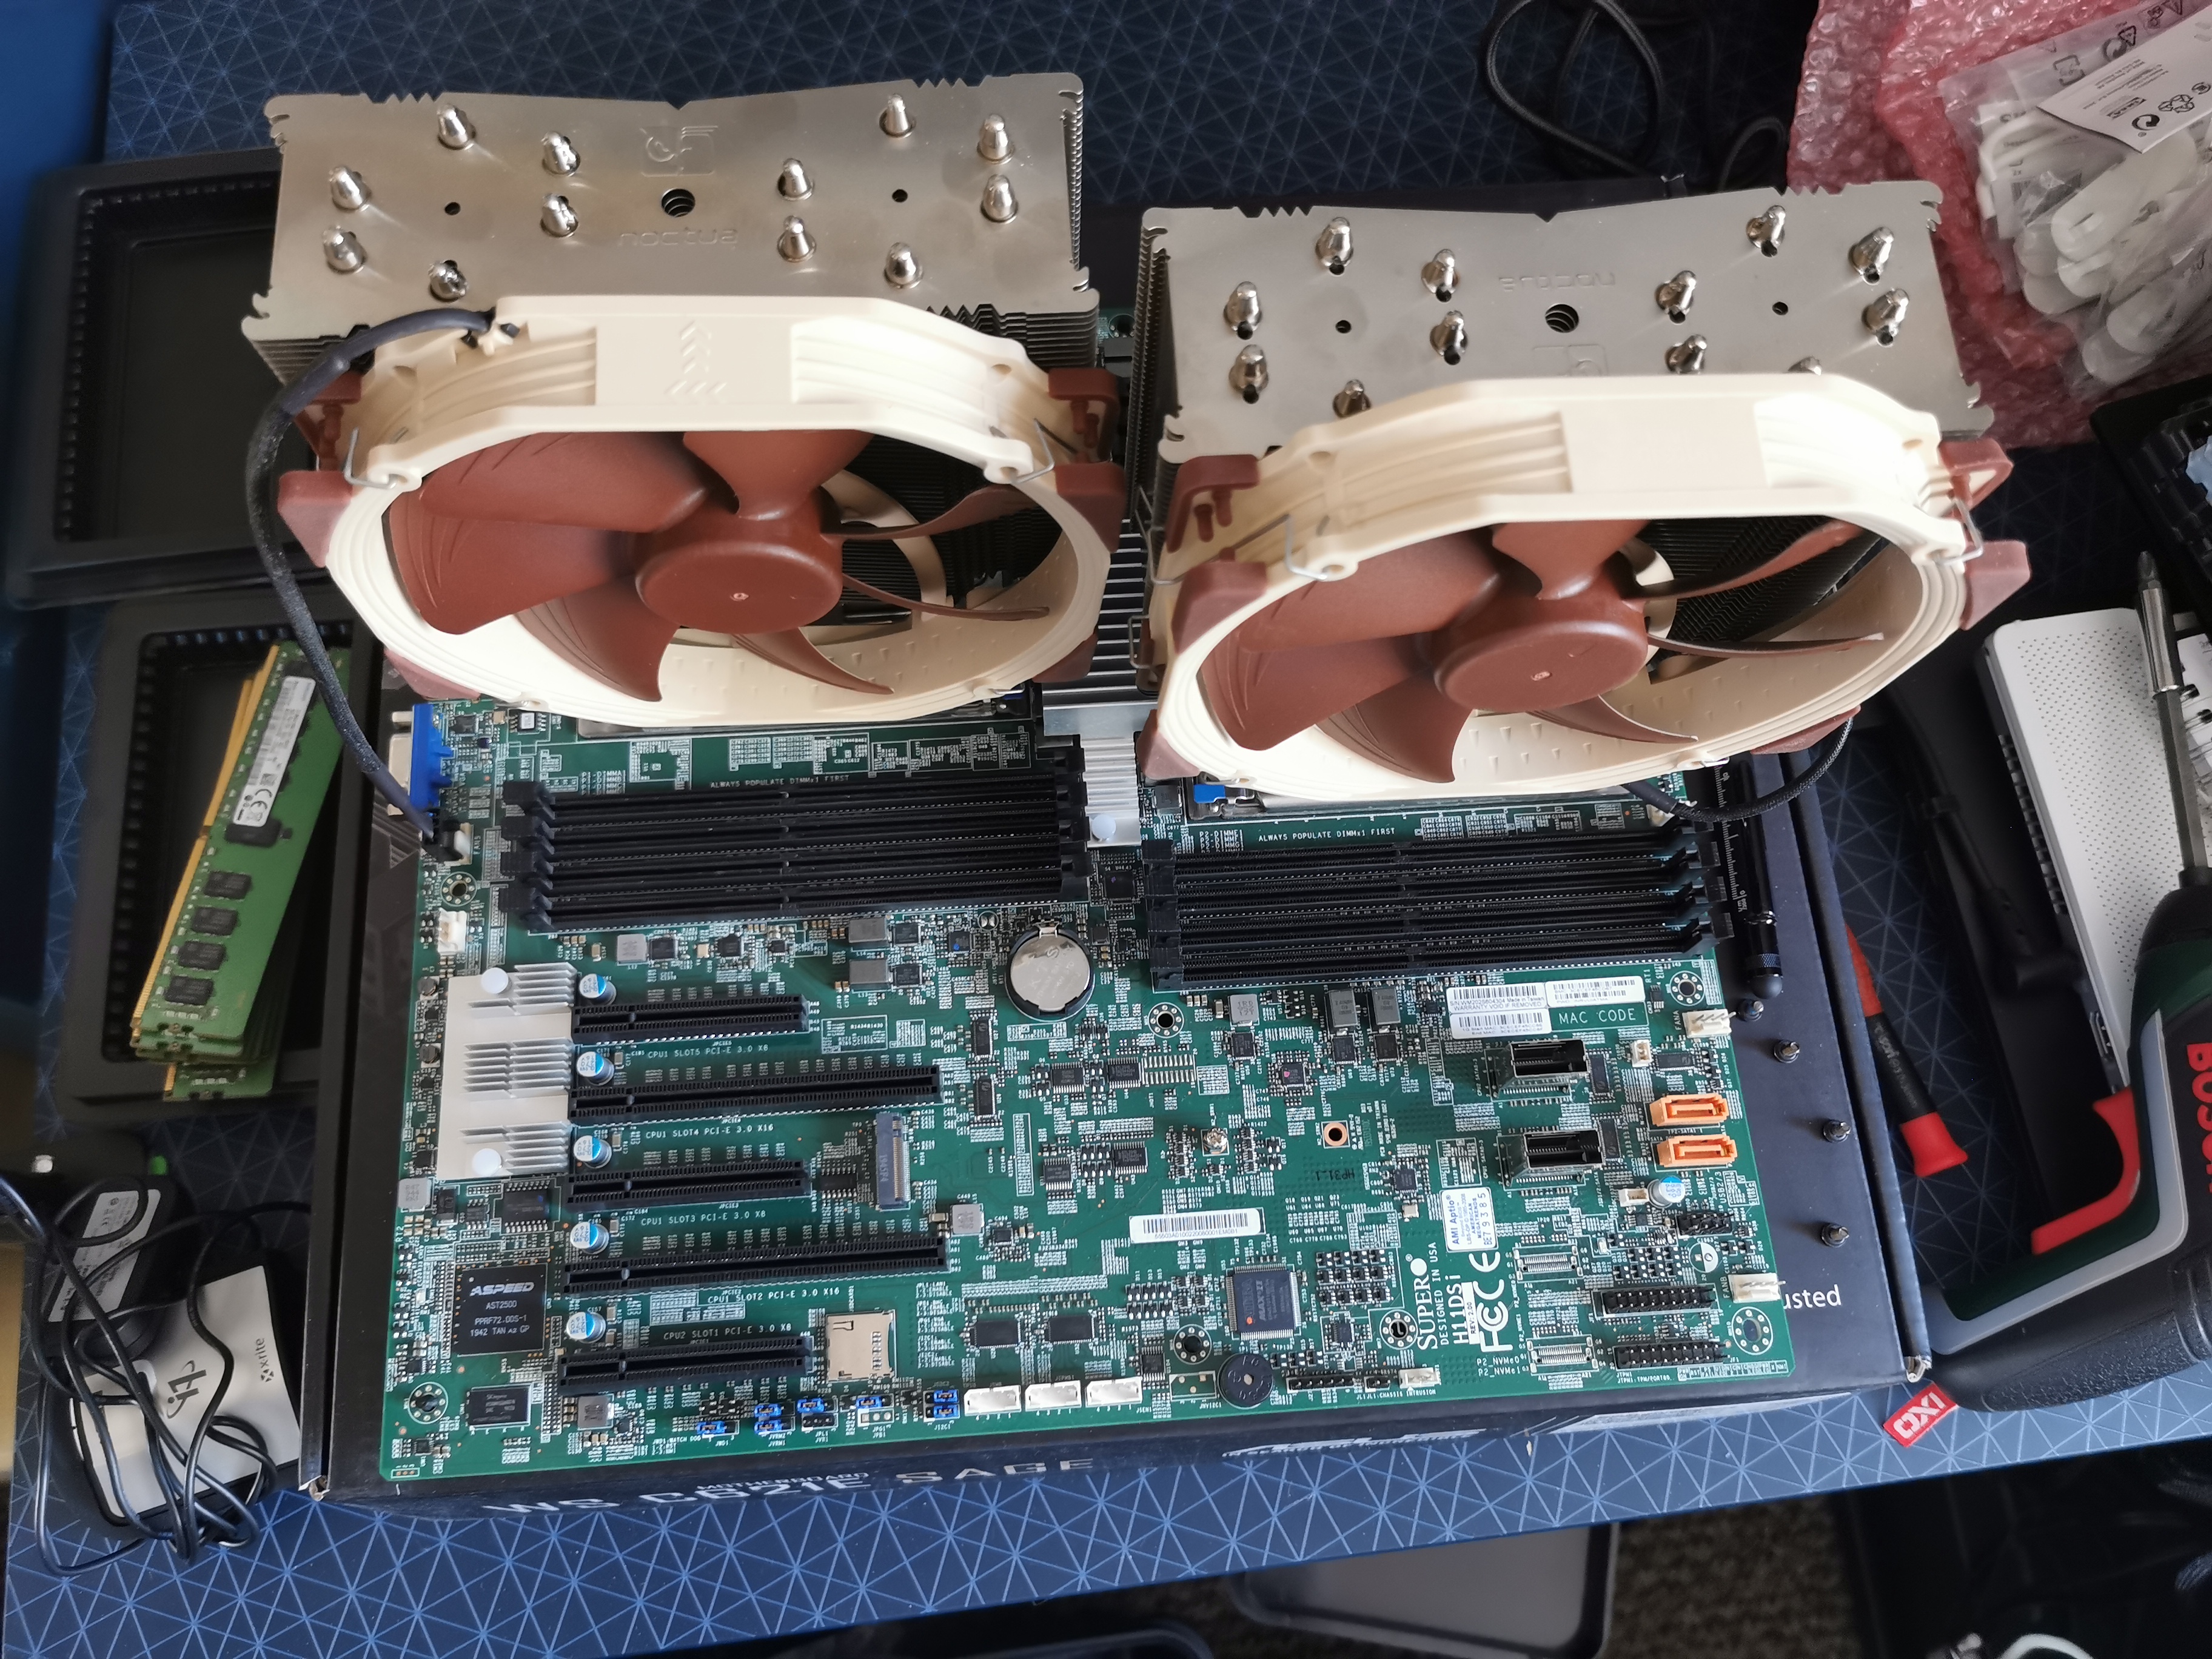
In our tests today, we’re using Supermicro’s H11DSi motherboard for testing the 2P EPYC processors, the ASRock Rack EPYCD8 for the 1P configurations, the ASUS WS C621E SAGE for 2P Xeon, and the ASUS ROG Dominus Extreme for 1P Xeon. Many thanks to Kingston for supplying memory for this review, as well as Micron for both memory and storage, Corsair for the power supplies, and Noctua for the coolers.
Frequency Ramp, Latency and Power
Frequency Ramp
One of the key items of a modern processor is its ability to go from an idle state up to a peak turbo state. For consumer workloads this is important for the responsiveness of a system, such as opening a program or interacting with a web page, but for the enterprise market it ends up being more relevant when each core can control its turbo, and we get situations with either multi-user instances or database accesses. For these systems, obviously saving power helps with the total cost of ownership, but being able to offer a low latency transaction in that system is often a key selling point.
For our 7F52 system, we measured a jump up to peak frequency within 16.2 milliseconds, which links in really well with the other AMD systems we have tested recently.
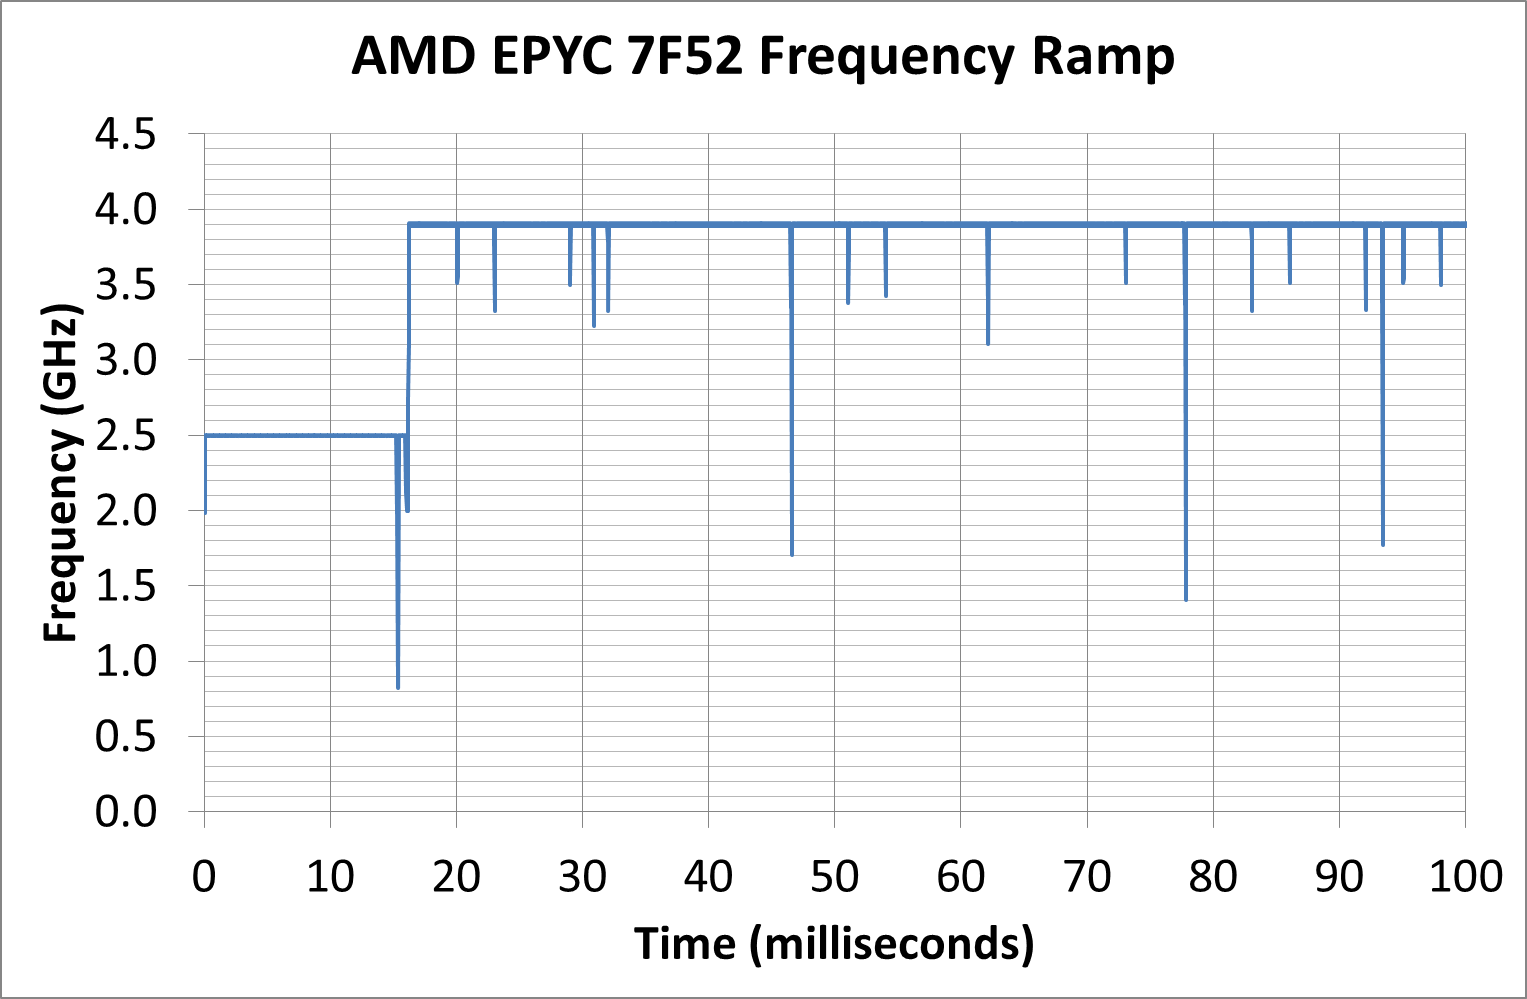
In a consumer system, normally we would point out that 16 milliseconds is the equivalent to a single frame on a 60 Hz display, although for enterprise it means that any transaction normally done within 16 milliseconds on the system is a very light workload that might not even kick up the turbo at all.
Cache Latency
As we’ve discussed in the past, the key element about Cache Latency on the AMD EPYC systems is the L3 cache – the way these cores are designed, with the quad-core core complexes, means that the only L3 each core can access is that within its own CCX. That means for every EPYC CPU, whether there is four cores per CCX enabled, or if there is only one core per CCX enabled, it only has access to 16 MB of L3. The fact that there is 256 MB across the whole chip is just a function of repeating units. As a result, we can get a cache latency graph of the following:

This structure mirrors up with what we’ve seen in AMD CPUs in the past. What we get here for the 7F52 is:
- 1.0 nanoseconds for L1 (4 clks) up to 32 KB
- 3.3 nanoseconds for L2 (13 clks) up to 256 KB,
- 4.8-5.6 nanoseconds (19-21 clks) at 256-512 KB (Accesses starting to miss the L1 TLB here)
- 12-14 nanoseconds (48-51 clks) from 1 MB to 8 MB inside the first half the CCX L3
- Up to 37 nanoseconds (60-143 clks) at 8-16 MB for the rest of the L3
- ~150 nanoseconds (580-600+ clks) from 16 MB+ moving into DRAM
Compared to one of our more recent tests, Ryzen Mobile, we see the bigger L3 cache structure but also going beyond the L3 into DRAM, due to the hop to the IO die and then out to the main memory there’s a sizeable increase in latency in accessing main memory. It means that for those 600 or so cycles, the core needs to be active doing other things. As the L3 only takes L2 cache line rejects, this means there has to be a lot of reuse of L3 data, or cyclical math on the same data, to take advantage of this.
Core-to-Core Latency
By only having one core per CCX, the 7F52 takes away one segment of its latency structure.
- Thread to Thread in same core: 8 nanoseconds
- Core to Core in same CCX: doesn't apply
- Core to Core in different CCX on same CPU in same quadrant: ~110 nanoseconds
- Core to Core in different CCX on same CPU in different socket quadrant: 130-140 nanoseconds
- Core to Core in a different socket: 250-270 nanosecons
All of the Power
Enterprise systems, unlike consumer systems, often have to adhere to a strict thermal envelope for the server and chassis designs that they go into. This means that, even in a world where there’s a lot of performance to be gained from having a fast turbo, the sustained power draw of these processors is mirrored in the TDP specifications of that processor. The chip may offer sustained boosts higher than this, which different server OEMs can design for and adjust the BIOS to implement, however the typical expected performance when ‘buying a server off the shelf’ is that if the chip has a specific TDP value, that will be the sustained turbo power draw. At that power, the system will try and implement the highest frequency it can, and depending on the microarchitecture of the power delivery, it might be able to move specific cores up and down in frequency if the workload is lighter on other cores.
By contrast, consumer grade CPUs will often boost well beyond the TDP label, to the second power limit as set in the BIOS. This limit is different depending on the motherboard, as manufacturers will design their motherboards beyond Intel specifications in order to supplement this.
For our power numbers, we take the CPU-only power draw at both idle and when running a heavy AVX2 load.
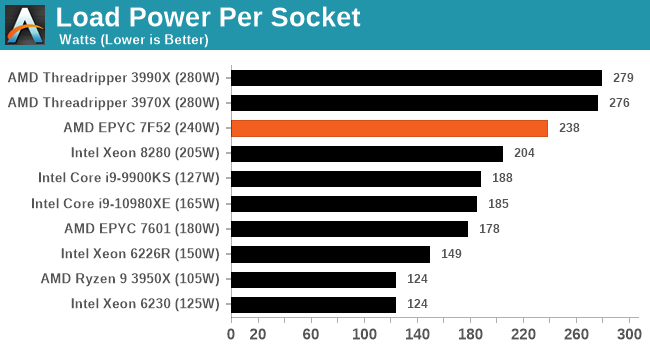
When we pile on the calories, all of our enterprise systems essentially go to TDPmax mode, with every system being just under the total TDP. The consumer processors give it a bit more oomph by contrast, being anywhere from 5-50% higher.
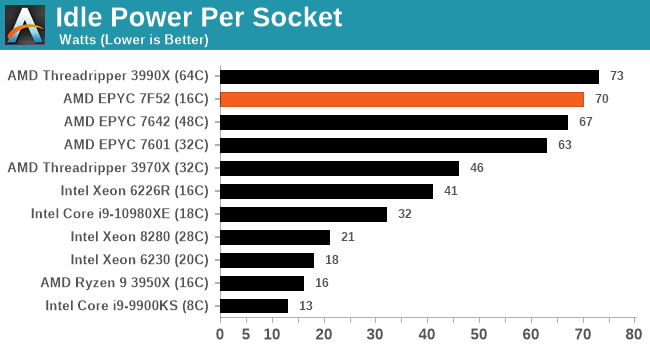
In our high performance power plan, the AMD CPUs idle quite high compared to the Intel CPUs – both of our EPYC setups are at nearly 70 W per processor a piece, while the 32C Threadripper is in about that 45 W region. Intel seems to aggressively idle here.
SPEC2006 and SPEC2017 (Single Thread)
Due to some limitations with our systems, we were only able to run SPEC in single thread mode in time for the review. Given that these 7F processors are meant to be the highest frequency EPYC hardware available, in single thread and multi-thread, this is still a very relevant test for the use case. Unfortunately we introduced this test late last year, after testing the bulk of our Intel CPUs. We’re currently re-running on a few and will update this post over the next few days.
*If you are seeing this as the review goes live, we are still waiting for the 6226R results to finish.
| SPEC2006 1T Estimated Results | ||||||||
| AnandTech | AMD 7F52 |
AMD 7601 |
AMD 3990X |
AMD 3950X |
Intel 6226R |
Intel 9900KS |
Intel 10980XE |
|
| uArch | Rome | Naples | Rome | Rome | CLX-R | Coffee | CLX | |
| Turbo | 3900 | 3200 | 4300 | 4700 | 3900 | 5000 | 4800 | |
| 400.perlbench | 45.9 | 29.8 | 50.8 | 54.6 | 40.2 | 60.1 | 55.2 | |
| 401.bzip2 | 30.9 | 23.3 | 34.5 | 36.6 | 25.4 | 37.5 | 33.5 | |
| 403.gcc | 37.7 | 28.0 | 53.4 | 57.7 | 30.0 | 56.1 | 46.6 | |
| 429.mcf | 35.6 | 22.6 | 48.6 | 52.9 | 28.5 | 64.7 | 45.3 | |
| 445.gobmk | 36.7 | 23.4 | 41.8 | 44.9 | 32.0 | 43.3 | 39.6 | |
| 456.hmmr | 36.8 | 26.8 | 41.0 | 43.3 | 39.2 | 51.7 | 48.2 | |
| 458.sjeng | 32.5 | 21.9 | 38.1 | 41.1 | 34.7 | 47.0 | 43.6 | |
| 462.libquantum | 78.7 | 50.3 | 100.4 | 102.8 | 38.5 | 113.2 | 106.8 | |
| 464.h264ref | 67.7 | 49.6 | 75.9 | 80.4 | 64.7 | 83.9 | 79.1 | |
| 471.omnetpp | 21.1 | 14.0 | 27.5 | 31.9 | 25.5 | 31.3 | 30.0 | |
| 473.astar | 26.9 | 17.8 | 30.9 | 32.8 | 22.9 | 30.2 | 29.5 | |
| 483.xalancbmk | 46.0 | 29.2 | 53.8 | 58.0 | 37.5 | 60.4 | 54.6 | |
| 433.milc | 35.0 | 22.6 | 46.9 | 49.3 | 15.7 | 31.9 | 27.9 | |
| 444.namd | 39.0 | 29.6 | 43.3 | 45.9 | 38.3 | 52.5 | 43.9 | |
| 450.soplex | 58.9 | 39.7 | 73.7 | 74.8 | 21.5 | 73.0 | 67.1 | |
| 453.povray | 59.7 | 37.0 | 66.3 | 70.9 | 58.5 | 76.2 | 70.5 | |
| 470.lbm | 101.4 | 72.4 | 121.8 | 126.2 | 20.2 | 77.7 | 102.9 | |
| 482.sphinx3 | 94.7 | 56.2 | 107.4 | 113.0 | 45.3 | 105.0 | 72.6 | |
| Geomean | 44.8 | 30.2 | 53.6 | 57.1 | 32.3 | 56.6 | 51.1 | |
The performance jump from the Naples 7601 to the Rome 7F52 is bordering on about 50%. It is worth pointing out that AMD’s consumer Ryzen 9 3950X wins out here due to IPC and single core frequency, closely followed by Intel’s i9-9900KS, the AMD Threadripper 3000s, and the Intel i9-10980XE. This comes down to consumer platforms affording much larger turbos and not being stricter on RAS requirements and such.
| SPEC2017 1T Estimated Results | ||||||||
| AnandTech | AMD 7F52 |
AMD 7601 |
AMD 3990X |
AMD 3950X |
Intel 6226R |
Intel 9900KS |
Intel 10980XE |
|
| uArch | Rome | Naples | Rome | Rome | CLX-R | Coffee | CLX | |
| Turbo | 3900 | 3200 | 4300 | 4700 | 3900 | 5000 | 4800 | |
| 500.perlbench_r | 4.3 | 2.7 | 5.0 | 5.3 | 5.1 | 6.9 | 6.3 | |
| 502.gcc_r | 6.1 | 4.4 | 8.0 | 8.6 | 3.8 | 9.3 | 7.4 | |
| 505.mcf_r | 5.0 | 3.5 | 6.1 | 6.6 | 3.2 | 6.5 | 5.4 | |
| 520.omnetpp_r | 2.4 | 2.0 | 3.4 | 3.7 | 3.1 | 4.1 | 3.8 | |
| 523.xalancbmk_r | 4.7 | 2.5 | 5.0 | 5.3 | 4.0 | 4.4 | 5.3 | |
| 525.x264_r | 7.8 | 5.7 | 9.0 | 9.5 | 6.8 | 9.7 | 9.0 | |
| 531.deepsjeng_r | 3.7 | 3.0 | 4.4 | 4.7 | 4.0 | 5.5 | 5.0 | |
| 541.leela_r | 4.1 | 2.9 | 4.6 | 4.9 | 3.7 | 5.0 | 4.6 | |
| 548.exchange2_r | 7.3 | 4.5 | 8.2 | 8.7 | 6.2 | 8.3 | 7.5 | |
| 557.xz_r | 3.0 | 2.1 | 3.8 | 4.1 | 2.9 | 4.1 | 3.8 | |
| 503.bwaves_r | 39.7 | 27.4 | 46.5 | 48.5 | 7.4 | 38.2 | 30.6 | |
| 507.cactuBSSN_r | 5.6 | 4.2 | 6.4 | 6.7 | 4.3 | 8.3 | 6.1 | |
| 508.namd_r | 6.0 | 4.6 | 6.7 | 7.0 | 4.1 | 7.4 | 6.3 | |
| 510.parest_r | 7.5 | 5.5 | 8.4 | 9.0 | 4.4 | 9.7 | 7.4 | |
| 511.povray_r | 6.7 | 4.2 | 7.5 | 7.9 | 6.6 | 8.7 | 8.0 | |
| 519.lbm_r | 6.9 | 5.0 | 8.0 | 8.4 | 1.0 | 7.7 | 6.3 | |
| 521.wrf_r * | - | - | - | - | - | - | - | |
| 526.blender_r | 6.6 | 4.7 | 7.5 | 8.0 | 5.2 | 7.9 | 7.2 | |
| 527.cam4_r | 6.8 | 4.8 | 7.7 | 8.2 | 4.8 | 8.3 | 6.4 | |
| 538.imagick_r | 7.9 | 5.8 | 8.8 | 9.4 | 6.4 | 8.5 | 7.8 | |
| 544.nab_r | 4.0 | 3.0 | 4.4 | 4.7 | 3.0 | 5.2 | 4.7 | |
| 549.fotonik_r | 14.2 | 8.1 | 17.2 | 16.4 | 3.5 | 14.8 | 11.4 | |
| 554.roms_r | 9.0 | 5.3 | 10.9 | 11.4 | 3.8 | 10.0 | 7.3 | |
| Geomean | 6.3 | 4.3 | 7.3 | 7.7 | 4.1 | 7.8 | 6.8 | |
| *512.wrf_r unfortunately doesn't run properly in our SPEC harness at this time | ||||||||
We see a similar result in the newer version of SPEC, again with ~50% jump from the Naples 7601 to the Rome 7F52. The 9900KS has the overall better Geomean here, followed closely behind by the 3950X, then the Threadrippers.
CPU Performance: Rendering and Synthetics
For the rest of our CPU tests, we’re using a mix of rendering and synthetic workloads. This is slightly different to our previous server reviews, due to some adjustments, and we hope to be running something similar to our standard server workloads in the near future.
All CPUs are run with SMT/HT enabled.
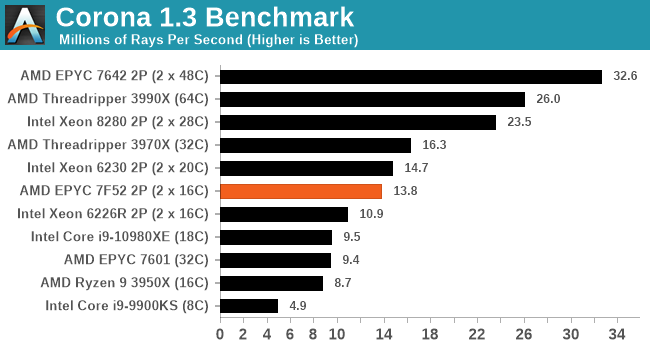
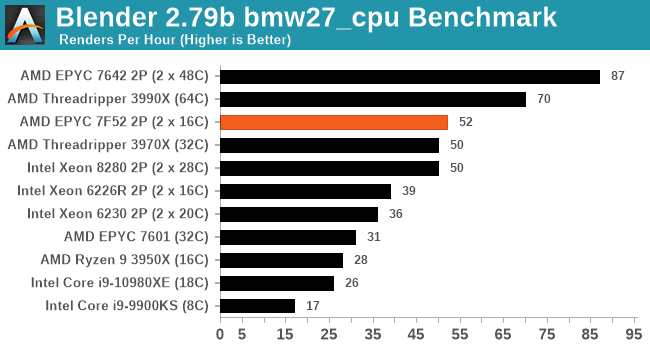
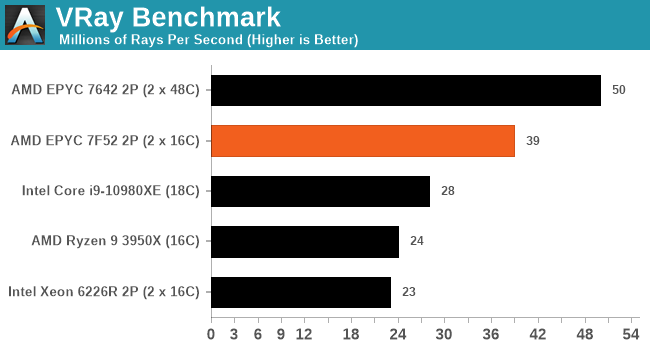
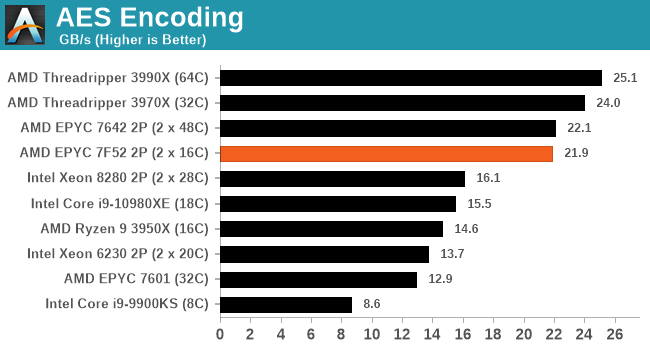
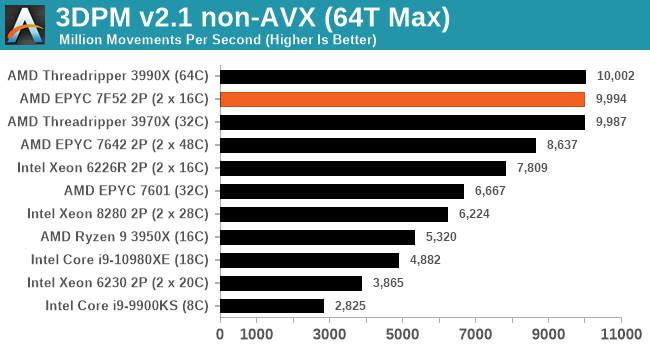
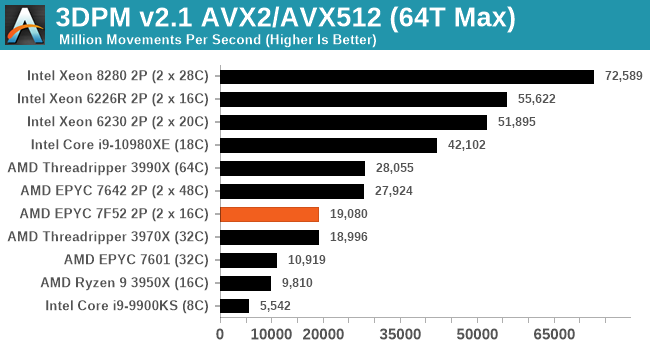
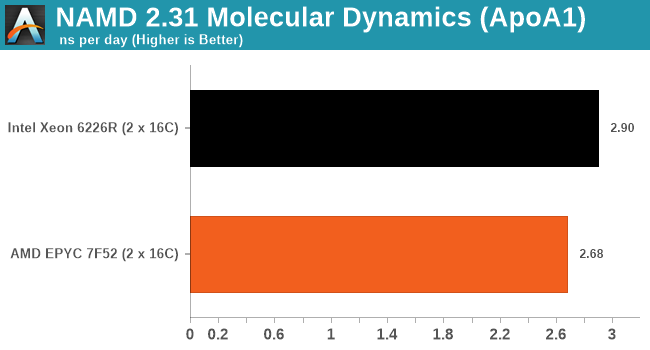
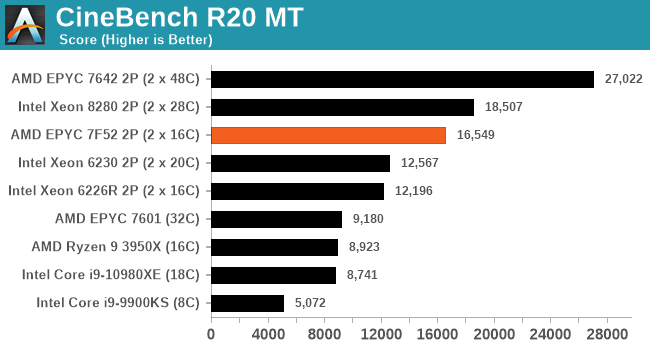
Even with the addition of a socket-to-socket in the mix, the dual 7F52 setup scores up to +100% in some benchmarks over the previous generation EPYC 7601. Against Intel’s latest 16-core Cascade Lake Refresh hardware, the AMD takes a sizeable lead in most benchmarks (except notably AVX512), which is perhaps to be expected given the price difference and power difference. What is interesting is how in certain workloads, the 2P 7F52 setup can make a reach up for the Xeon 8280s, despite the 8280s being 3x the cost each.
Conclusions
There are three main ways to increase modern computing performance: more cores, higher frequency, and a better instruction throughput per cycle (IPC).
The one everyone loves, but is the hardest to do, is to increase IPC – most modern processor designs, if they are evolutions of previous designs, try to ensure that IPC increases faster than power consumption, such that for every 1% increase in power, there might be 2% increase in IPC. This helps efficiency, and it helps everyone.
As we’ve seen with some recent consumer processors, IPC is nothing unless you can match the frequency of the previous generation. Increasing frequency should sound easy: just increase the voltage, which gives the unfortunate side effect of heat and decreases the efficiency. There’s also another element at play here, in physical design. The ability to produce a layout of a processor floorplan such that different parts of the CPU are not affecting the frequency is a key tenet to good physical design, and this can help boost maximum frequencies. If you can’t get IPC, then an increase in frequency also helps everyone.
An increase in core count is harder to quantify. More cores only helps users that have workloads that scale across multiple cores, or gives an opportunity for more users to work at once. There also has to be an interconnect to feed those cores, which scales out the power requirements. Cores doesn’t always help everyone, but it can be one of the easier ways to scale out certain types of performance.
With the new 7F range of Rome processors, AMD is hoping to stag that first second rung of the ladder. These new parts offer more frequency, but also improve the L3 cache to core ratio, which will certainly help a number of edge cases that are L3 limited or interconnect limited. There is a lot of demand for high frequency hardware, and given the success of the Naples 7371 processor from the previous generation, AMD has expanded its remit into three new 7F processors. The F is for Frequency.
The processor we tested today was the 7F52, the most expensive offering ($3100) which has 16 cores with a base frequency of 3.5 GHz and a turbo of 3.9 GHz. This is the highest turbo of any AMD EPYC processor, and this CPU is built such that there is 256 MB of L3 cache, offering the highest core-to-cache ratio of any x86 processor. At a full 16 MB per core, this means that there is less chance for congestion between threads at the L3 level, which is an important consideration for caching workloads that reuse data.
Our tests showed very good single thread performance, and a speedy ramp from idle to high power, suitable for bursty workloads where responsiveness matters. For high throughput performance, we saw some good numbers in our test suite, especially for rendering.
Personally, it’s great when we see companies like AMD expanding their product portfolio into these niche areas. High frequency parts, high cache parts, or custom designs are all par for the course in the enterprise market, depending on the size of the customer (for a custom SKU) or the size of the demand (to make the SKU public). AMD has been doing this for generations, and in the past even created modified Opterons for the Ferrari F1 team to do more computational fluid dynamics within a given maximum FLOPs. I’m hoping AMD lets us in on any of these special projects in the future.
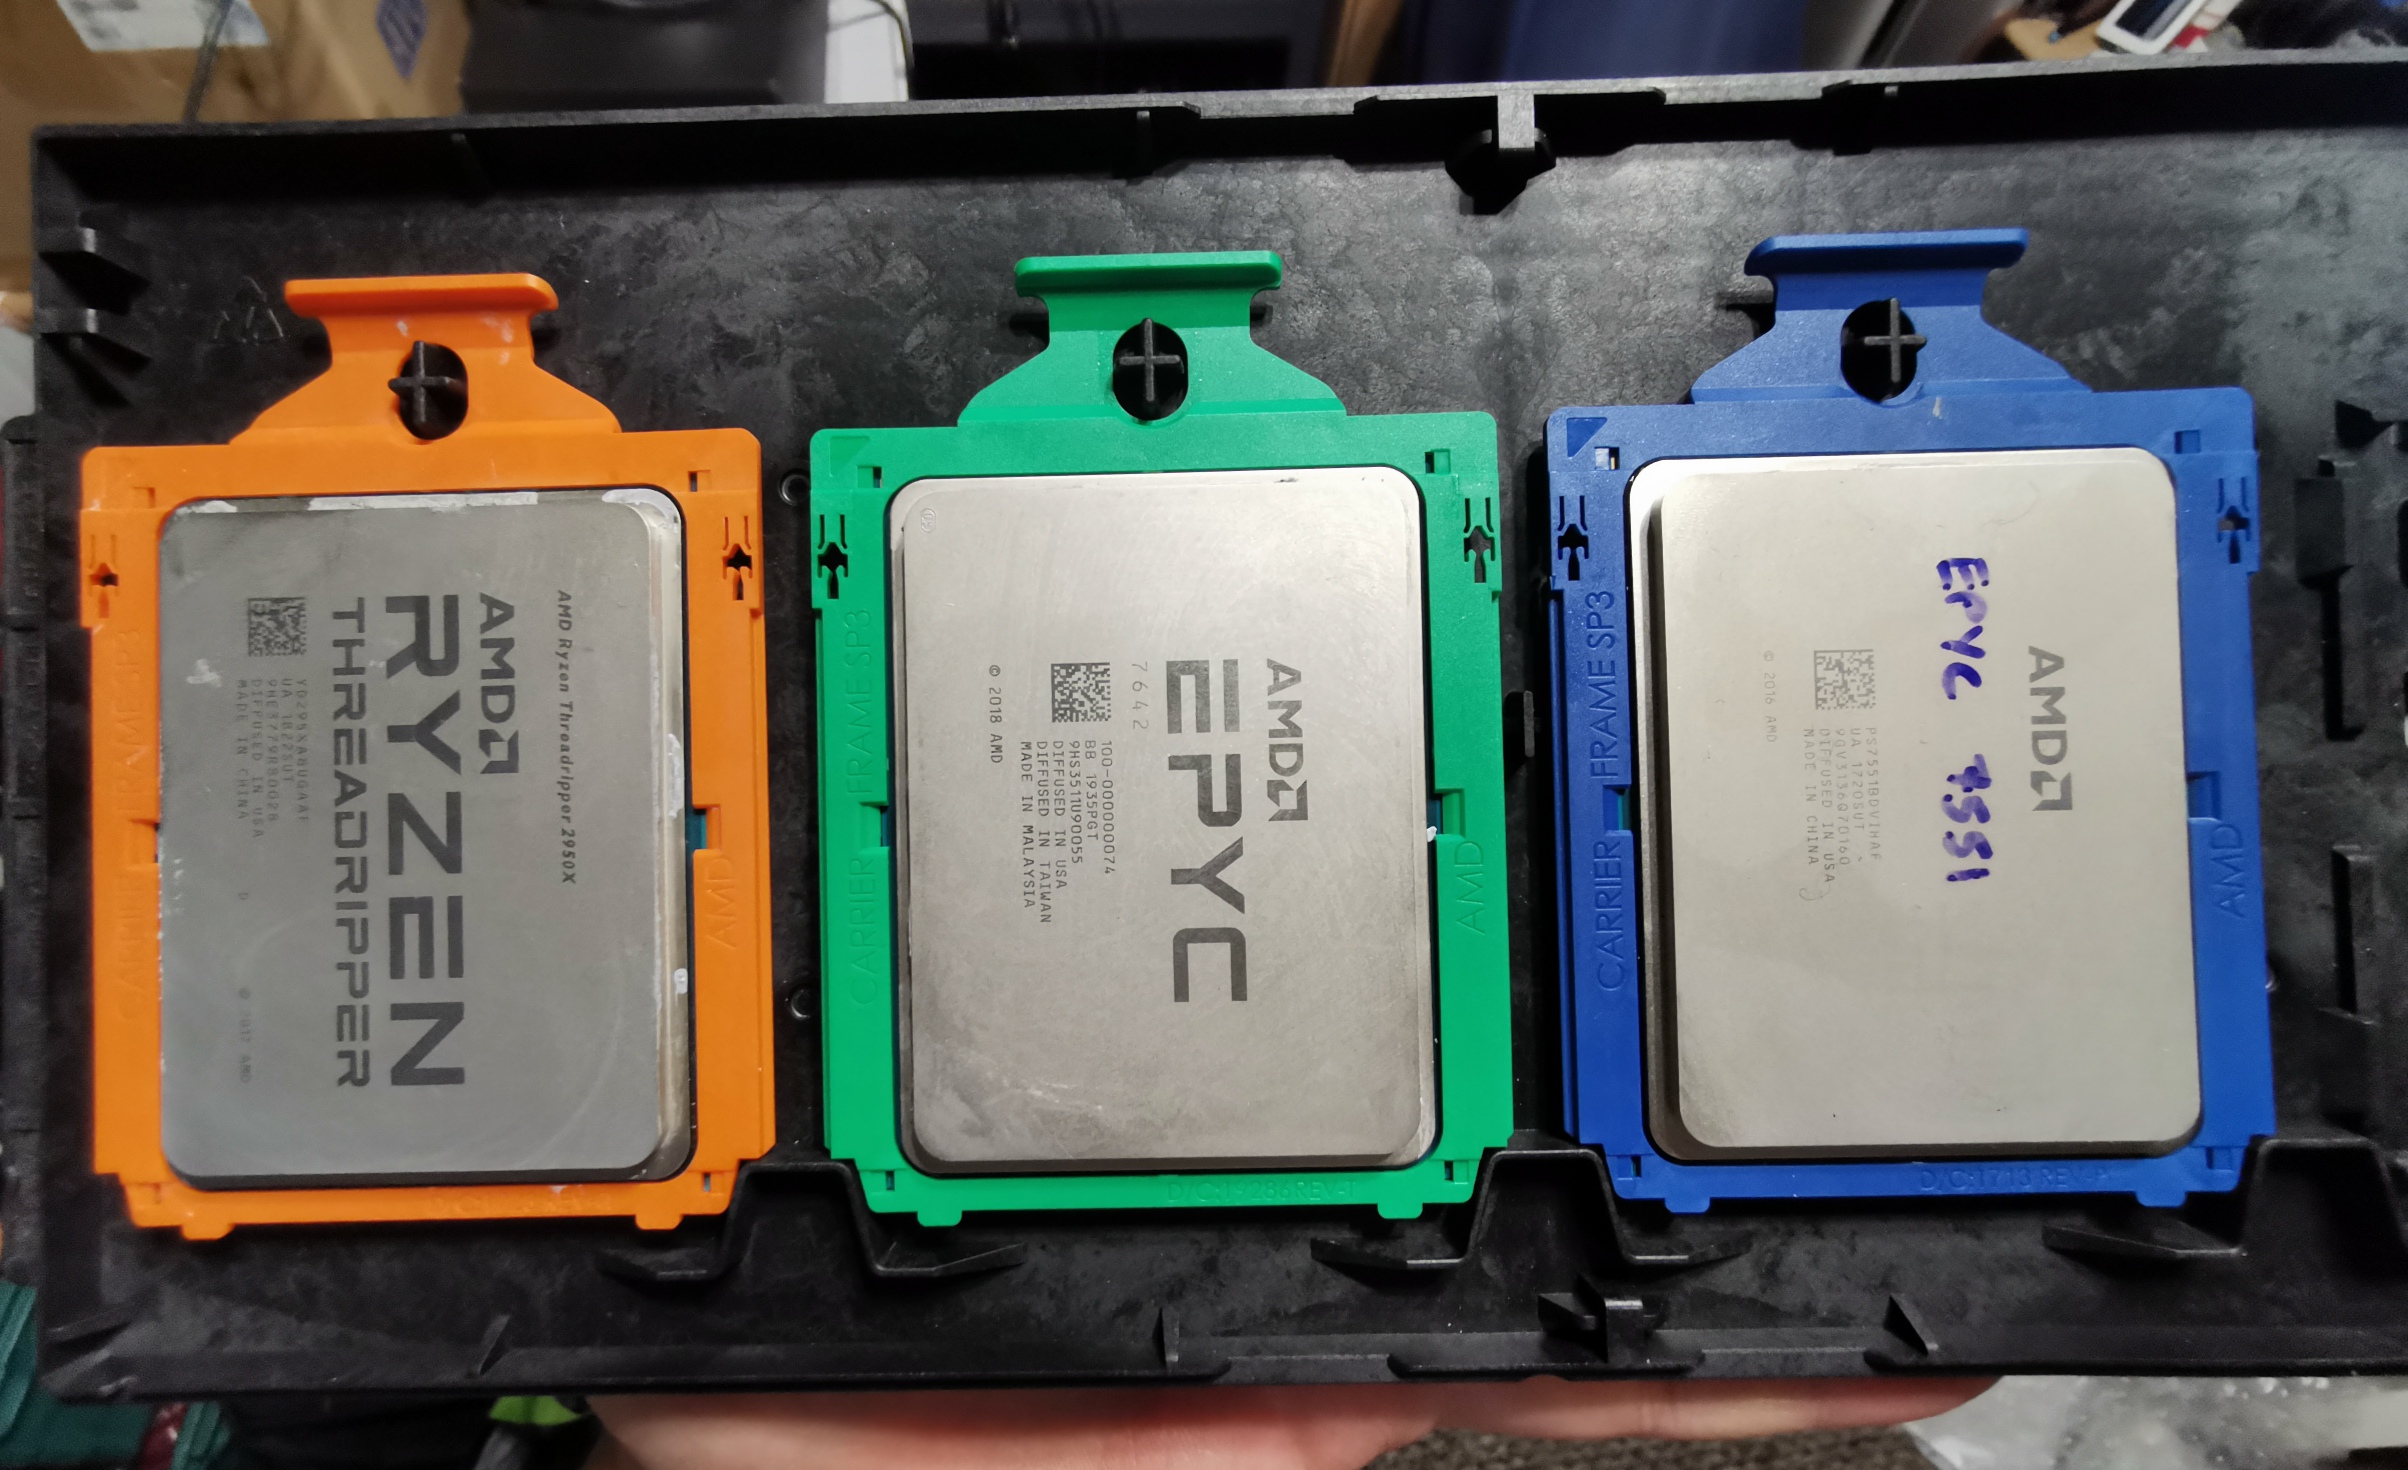
Threadripper, Rome, Naples. AMD introducing RGB to CPUs


