Original Link: https://www.anandtech.com/show/16111/asrock-industrial-4x4-boxv1000m-ryzen-minipc-review
ASRock Industrial 4X4 BOX-V1000M Ryzen Mini-PC Review: Finding Zen In The Small Things
by Ganesh T S on September 28, 2020 8:00 AM EST- Posted in
- Systems
- AMD
- NUC
- UCFF
- Ryzen
- Ryzen Embedded
- ASRock Industrial
The miniaturization trend triggered by the ultra-compact form factor NUCs from Intel has emerged as a key driver in the growth of the PC market. Processor power efficiency is of paramount importance in this space, and AMD had been caught napping when the NUCs began to take flight. The introduction of the Zen microarchitecture in the Ryzen processors has scripted a remarkable turnaround for AMD. With leading core counts, the Ryzen processors have taken the HEDT market by storm. UCFF PC manufacturers, however, opted to play the wait and watch game, and it took a while before the embedded SoC versions of the first-generation Ryzens started appearing in the PC market. Last year, ASRock Industrial introduced one of the first Ryzen UCFF systems in the form of the 4X4 BOX-V1000M. This review attempts to figure out how the unit fares against the entrenched incumbents.
Introduction and Product Impressions
Small form-factor (SFF) PCs and gaming systems have represented the bulk of the growing segment in the PC market over the last few years. Intel's NUC line-up has enjoyed unprecedented success. Despite the introduction of notebook processors using the first-generation Zen microarchitecture, AMD's power efficiency was not good enough for vendors (and even AMD themselves) to make a dent in Intel's success in the NUC space. The equation changed slightly with the launch of the AMD Ryzen Embedded processors in early 2018. Starting as a trickle with a mini-STX board from with Sapphire, the uptake of the Ryzen Embedded series became a veritable deluge late last year with UCFF systems from ASRock Industrial, EEPD, OnLogic, and SimplyNUC.
ASRock Industrial has been at the forefront of AMD-based UCFF PCs, being one of the first to bring out UCFF systems based on the Ryzen Embedded APUs in mid-2019. In fact, their boards have been adopted by vendors such as OnLogic in their ML100G-40 systems. The company offers three different 4X4 BOX configurations - the dual-core R1505G and R1606G variants in the R1000M and R1000V, and the flagship quad-core V1605B-based V1000M. The last of the three is the one we are looking at today.
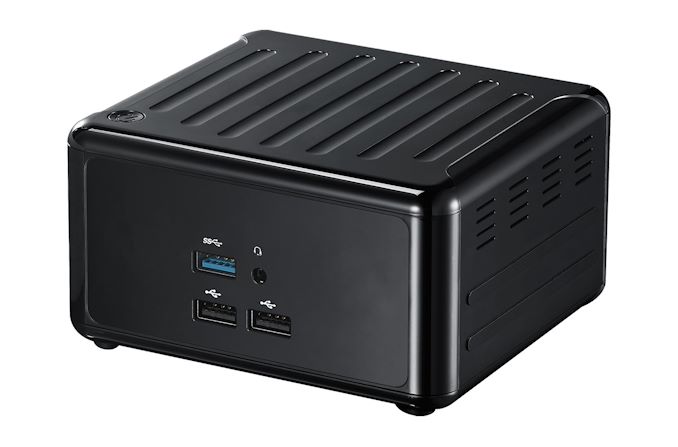
The 4X4 BOX-V1000M is ASRock Industrial's flagship AMD Ryzen Embedded offering with a 104mm x 102mm main-board housed in a 110mm x 118.5mm x 67.3mm plastic chassis. The system matches the Intel NUCs in the footprint department. The board comes with a soldered processor - the V1605B belonging to the AMD Ryzen Embedded V-Series. It is a quad-core processor with SMT enabled (4C/8T). It can operate with a TDP configurable between 12W and 25W.
Switching to peripherals and networking, the board's WLAN component is M.2 card - the Intel AC3168. The system is otherwise barebones, providing with the flexibility to choose their own storage device and RAM. For best performance, a PCIe 3.0 x4 NVMe SSD can be used, and DDR4-2400 SODIMMs are supported. However, it must be noted that the system does NOT support M.2 2280 SSDs. Only M.2 2242 and 2260 Key M SSDs (both SATA and NVMe) are supported. We installed a Transcend MTS600 SATA SSD (one of the few M.2 2260 SSDs that we had access to during our testing process) along with vanilla DDR4 SODIMMs from the Team Group brand.
The specifications of our ASRock 4X4 BOX-V1000M review configuration are summarized in the table below.
| ASRock Industrial 4X4 BOX-V1000M Specifications | |
| Processor | AMD Ryzen Embedded V1605B Ryzen Embedded V-Series, 4C/8T, 2.0 (3.6) GHz 2MB L2 + 4MB L3, 14nm, 12-25W TDP |
| Memory | Team Group TEAMGROUP-SD4-2666 DDR4 SODIMM 16-16-16-39 @ 2400 MHz 2x8 GB |
| Graphics | AMD Radeon Vega 8 Graphics |
| Disk Drive(s) | Transcend MTS600 TS256GMTS600 (256 GB; M.2 Type 2260 SATA III; Micron 20nm MLC) (Silicon Motion SM2246EN Controller) |
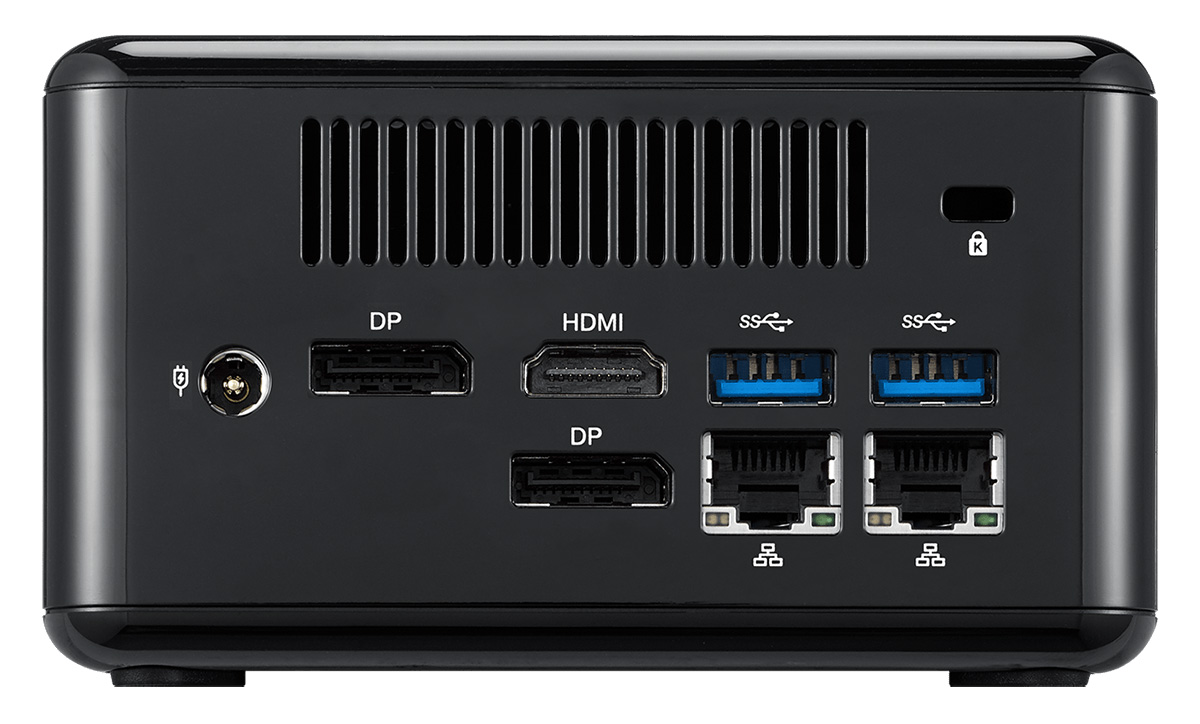
| Networking | Intel Dual Band Wireless-AC 3168 (1x1 802.11ac - 433 Mbps) 2x Realtek RTL8111G Gigabit Ethernet Controller |
| Audio | 3.5mm Headphone Jack Capable of 5.1/7.1 digital output with HD audio bitstreaming (HDMI) |
| Miscellaneous I/O Ports | 2x USB 2.0 3x USB 3.2 Gen 2 Type-A |
| Operating System | Retail unit is barebones, but we installed Windows 10 Enterprise x64 (1909) |
| Pricing (As configured) | $390 ( $561 ) |
| Full Specifications | ASRock Industrial 4X4 BOX-V1000M Specifications |
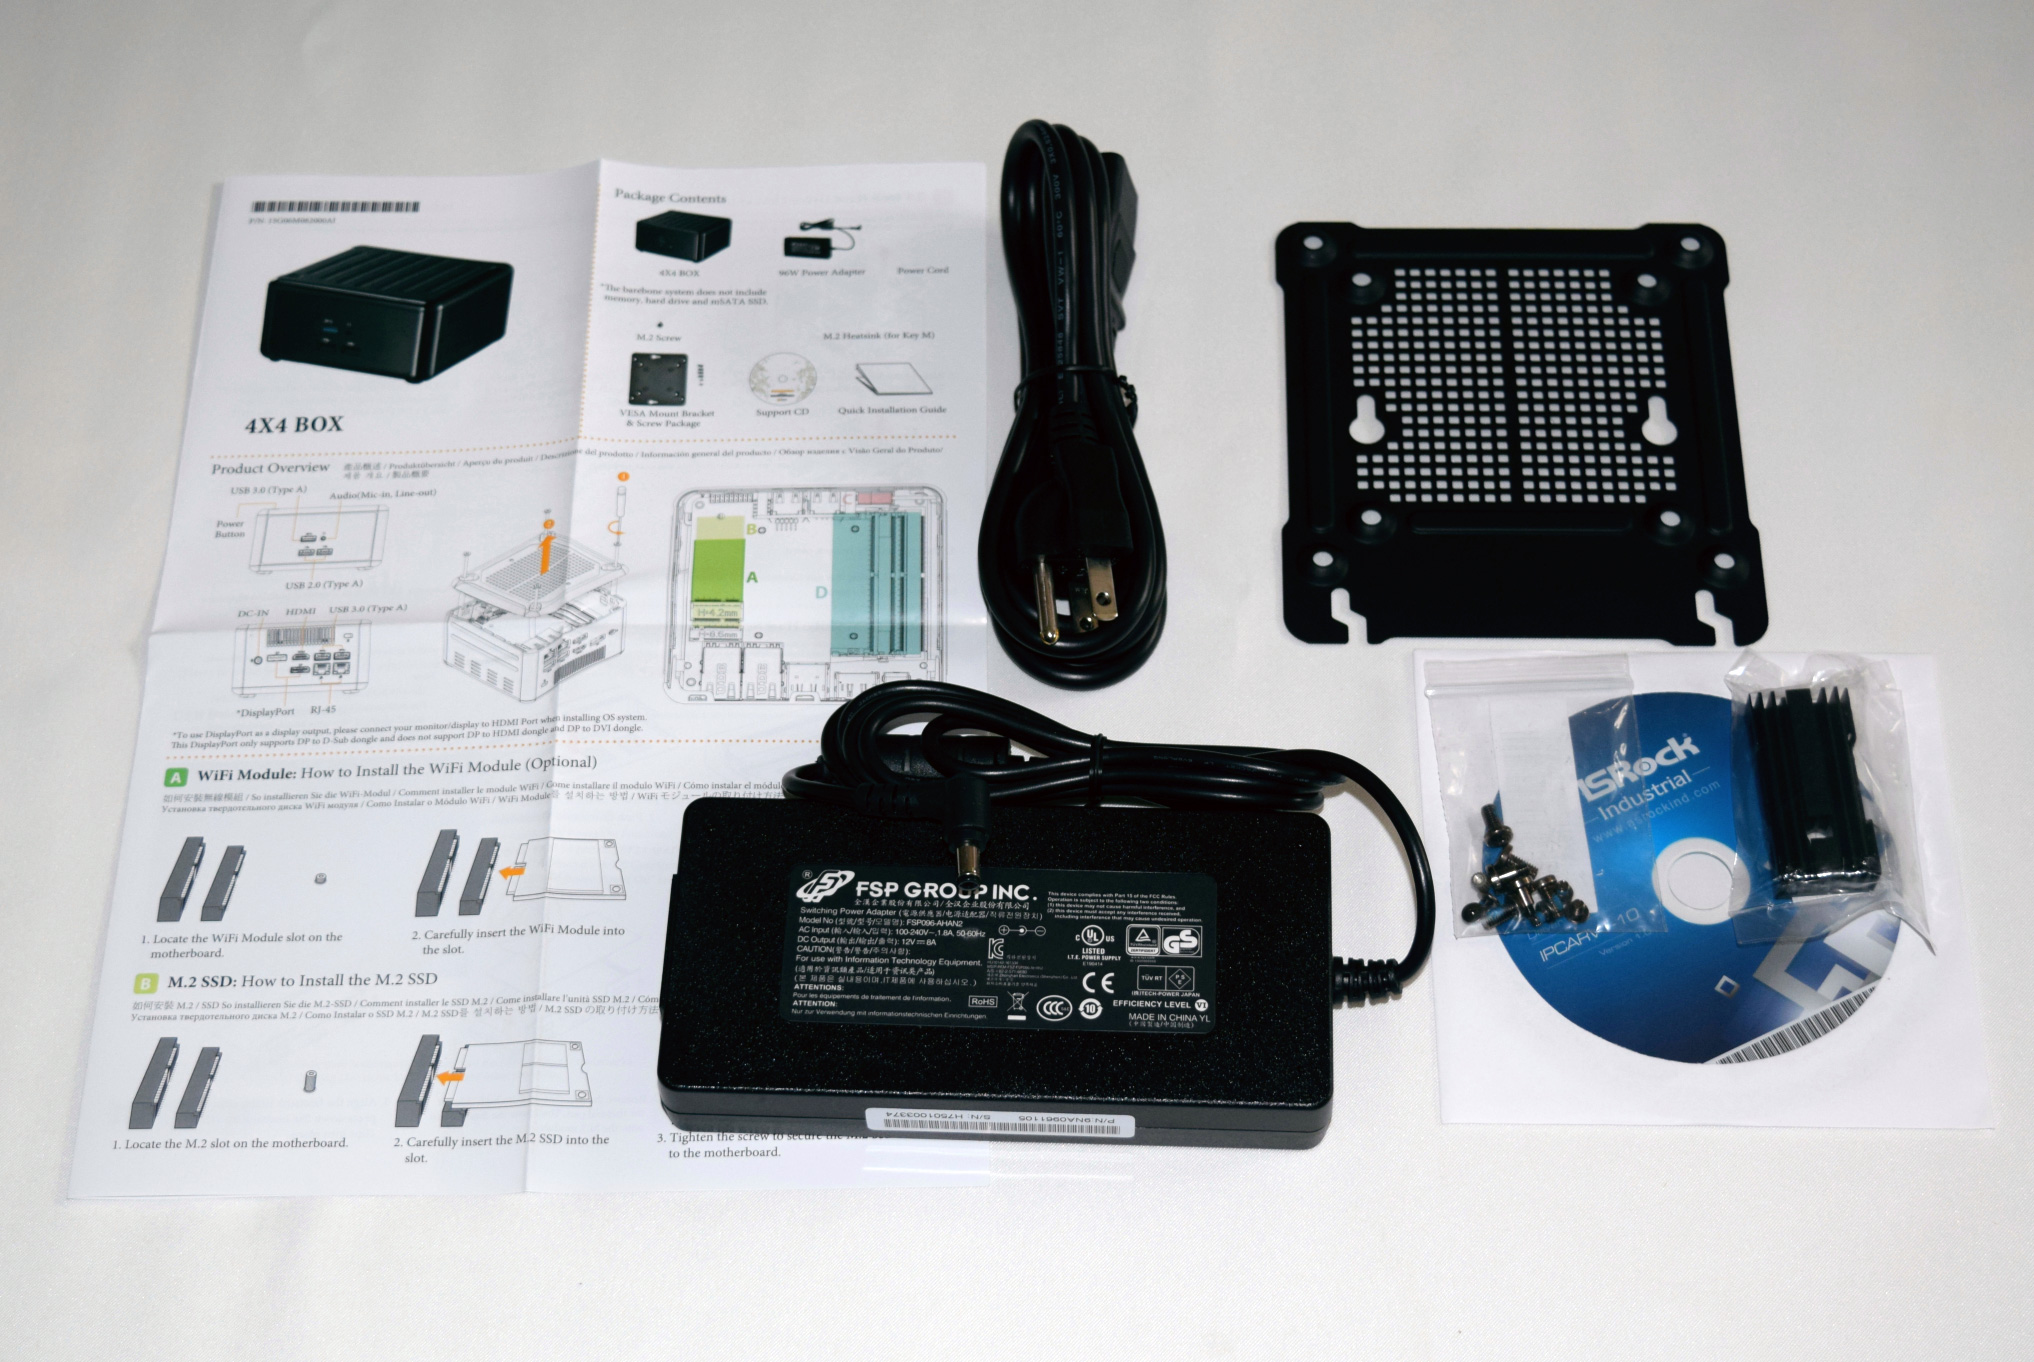
The ASRock Industrial 4X4 BOX-V1000M kit doesn't come with any pre-installed OS, but does come with a CD containing the drivers. In any case, we ended up installing the latest drivers downloaded off the product support page. In addition to the main unit, the other components of the package include a 96 W (12V @ 8A) adapter, a US power cord, a VESA mount (along with the necessary screws), a M.2 SSD heat-sink, a driver CD, user's manual and a quick-start guide.
The gallery below takes us around the hardware in the main unit.


In the table below, we have an overview of the various systems that we are comparing the ASRock 4X4 BOX-V1000M against. Note that they may not belong to the same market segment. The relevant configuration details of the machines are provided so that readers have an understanding of why some benchmark numbers are skewed for or against the ASRock 4X4 BOX-V1000M when we come to those sections.
| Comparative PC Configurations | ||
| Aspect | ASRock 4X4 BOX-V1000M | |
| CPU | AMD Ryzen Embedded V1605B | AMD Ryzen Embedded V1605B |
| GPU | AMD Radeon Vega 8 Graphics | AMD Radeon Vega 8 Graphics |
| RAM | Team Group TEAMGROUP-SD4-2666 DDR4 SODIMM 16-16-16-39 @ 2400 MHz 2x8 GB |
Team Group TEAMGROUP-SD4-2666 DDR4 SODIMM 16-16-16-39 @ 2400 MHz 2x8 GB |
| Storage | Transcend MTS600 TS256GMTS600 (256 GB; M.2 Type 2260 SATA III; Micron 20nm MLC) (Silicon Motion SM2246EN Controller) |
Transcend MTS600 TS256GMTS600 (256 GB; M.2 Type 2260 SATA III; Micron 20nm MLC) (Silicon Motion SM2246EN Controller) |
| Wi-Fi | Intel Dual Band Wireless-AC 3168 (1x1 802.11ac - 433 Mbps) |
Intel Dual Band Wireless-AC 3168 (1x1 802.11ac - 433 Mbps) |
| Price (in USD, when built) | $390 (barebones) $561 (as configured) |
$390 (barebones) $561 (as configured) |
Hardware Setup and Platform Analysis
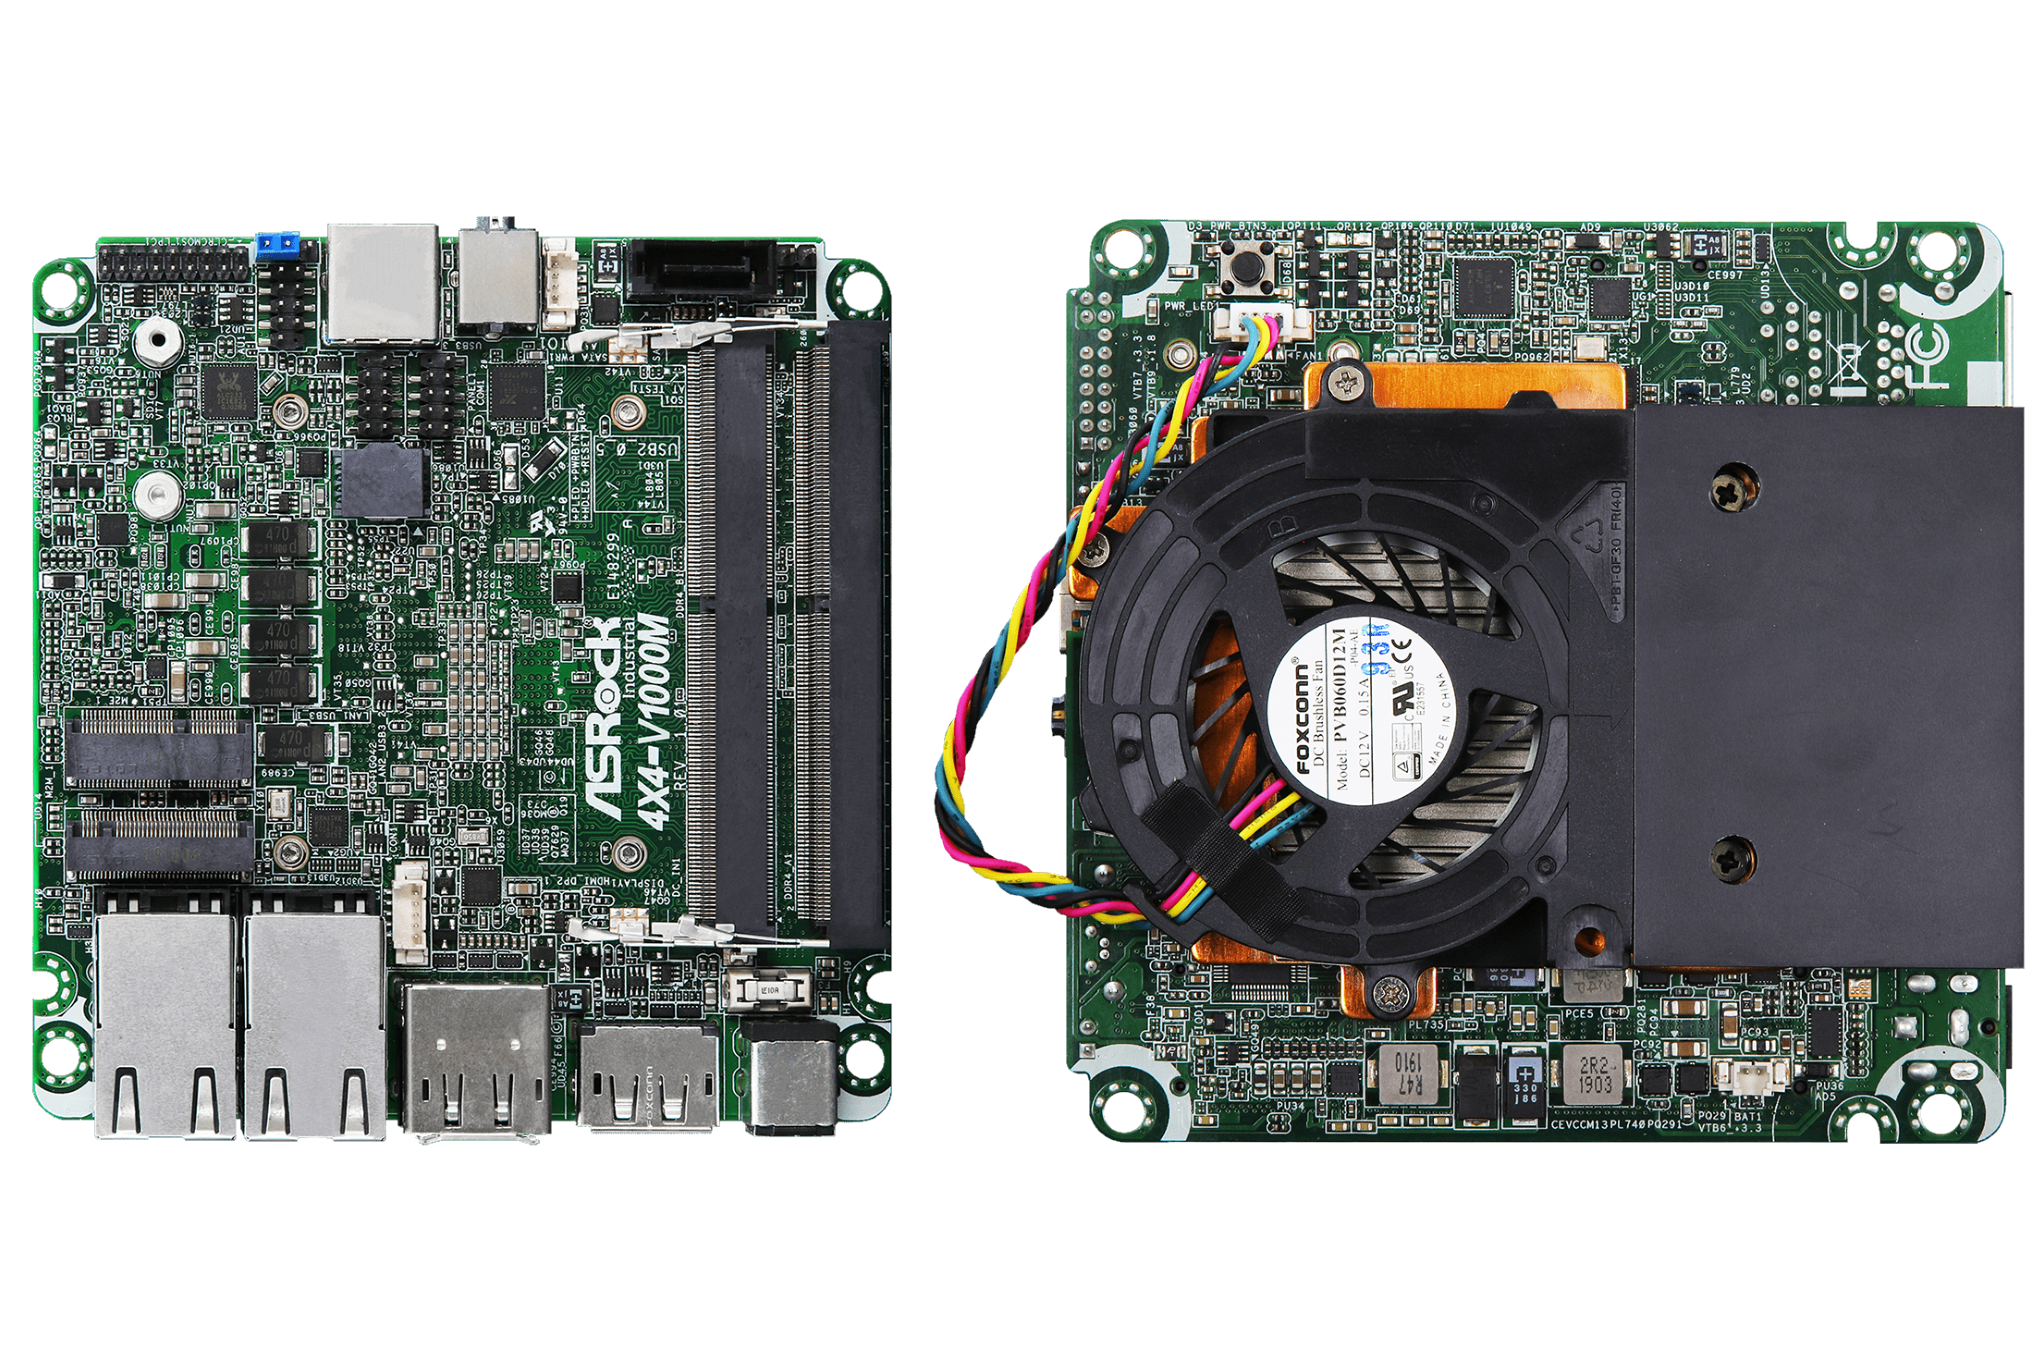
The internal components of the 4X4 BOX-V1000M are packed densely together. The front panel's two USB 2.0 ports are enabled by a daughterboard connecting to the motherboard's USB 2.0 headers. The mounting for this daughterboard, and the SATA port / cable location make the installation of the DDR4 SODIMMs a challenging process. In fact, based on my experience, it is better to completely take out the daughterboard prior to the SODIMM installation process. Installing a 2.5" drive is fortunately not as painful, as it is similar to the installation process in the tall NUCs from Intel, and the SATA cable is already in place inside the chassis.

(Annotation on photograph sourced from Hermitage Akihabara)
The rest of the internal components are the usual suspects in a NUC targeting industrial applications - a Realtek ALC233 audio codec, an Exar SP339E serial port transceiver, and a couple of Raltek RTL8111G gigabit Ethernet controllers on one side, and a 60mm fan on top of a copper heat sink on the other side.
Once the build components were in place, it was a fairly uneventful process to complete the OS installation. The UEFI BIOS of the 4X4 BOX-V1000M is quite basic - consumers used to ASRock's fancy GUI and plethora of value additions are bound to be disappointed with the spartan AMI BIOS interface in this ASRock Industrial system. The gallery below shows the various available BIOS options.


The block diagram of the Ryzen Embedded V-Series SoC is presented below.
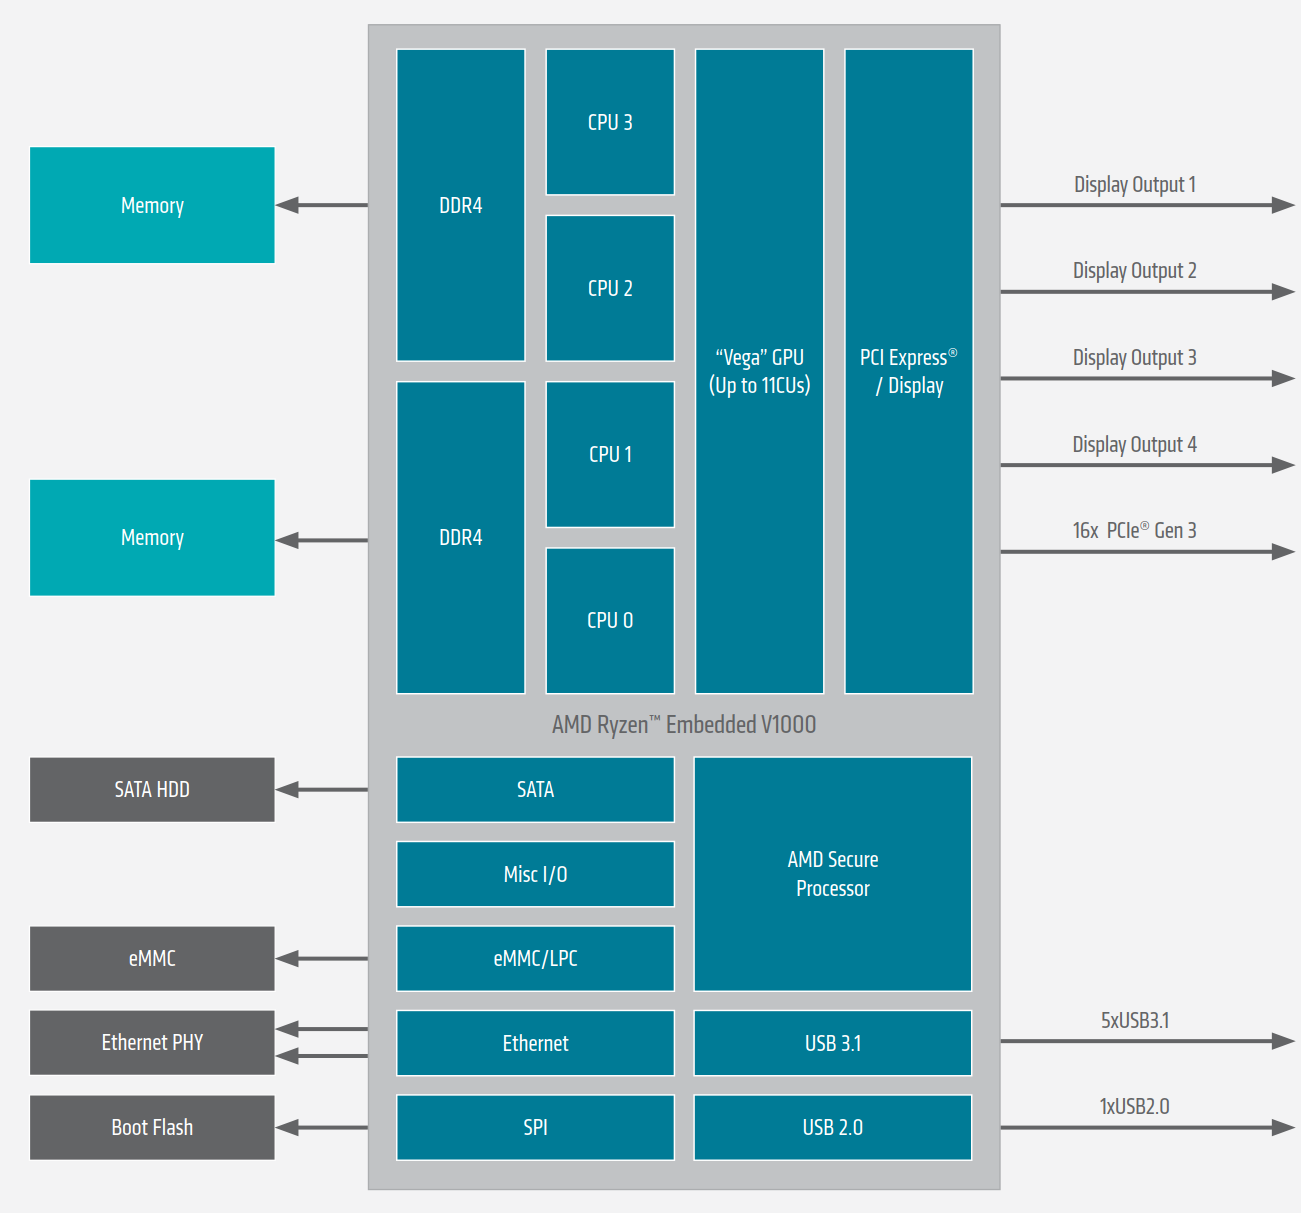
The V1605B specifically provides:
- 2x 10GbE
- 1x USB 2.0
- 1x USB 3.1 Gen1
- 4x USB 3.1 Gen2
- 2x SATA III
The 4X4 BOX-V1000M does not use the 10GbE interfaces. It also uses the single USB 2.0 port of the SoC to drive a header on the board that enables a daughterboard downstream to provide 2x USB 2.0 ports in the front panel. The USB 3.2 Gen 1 port and one of the USB 3.1 Gen 2 ports of the SoC are left unused. Networking support is provided using PCIe lanes.
The AIDA64 system report for our 4X4 BOX-V1000M configuration provides a breakdown of the usage of the PCIe lanes and adds additional context to the above block diagram:
- PCIe 3.0 x4 and a SATA port multiplexed behind the M.2 2242/2260 slot
- PCIe 3.0 x1 for the Intel Wireless-AC AC3168 WLAN card
- PCIe 3.0 x1 for the Realtek RTL8111G #1
- PCIe 3.0 x1 for the Realtek RTL8111G #2
The absence of a discrete PCH means that there is no 'DMI bottleneck' at play in the SoC. Another interesting aspect is the support for four simultaneous 4Kp60 display outputs from the V1605B. The 4X4 BOX-V1000 only supports three, though, with two DP 1.2a ports and a HDMI 2.0a port.
In the remainder of this review, we will first look at various UL benchmarks, followed by miscellaneous workloads. A detailed look at the HTPC credentials of the system is followed by testing of the power consumption and thermal solution. In our recent system reviews, we have usually started off with BAPCo's SYSmark 2018 - unfortunately, we ran into some showstopper issues with the 4X4 BOX-V1000M review configuration, as the benchmark program consistently errored out (mostly during the Photoshop CC workload component). We had seen similar problems in previous AMD-based PCs that ended up getting resolved with driver updates, but we had no such luck with this system. Incidentally, with the same GPU drivers, we were able to get the workload processed correctly on an ECS LIVA A320 sporting an AMD Athlon 3000G processor. Debugging the issue on the 4X4 BOX-V1000M beyond a few attempts was beyond the scope of this review. Hence, we decided to drop the attempt to publish SYSmark 2018 numbers for the 4x4 BOX-V1000M.
UL Benchmarks - PCMark and 3DMark
This section deals with a selection of the UL Futuremark benchmarks - PCMark 10, PCMark 8, and 3DMark. While the first two evaluate the system as a whole, 3DMark focuses on the graphics capabilities.
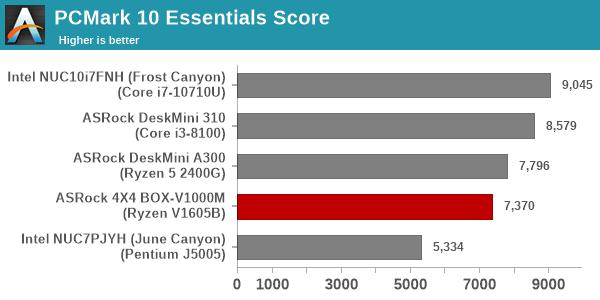
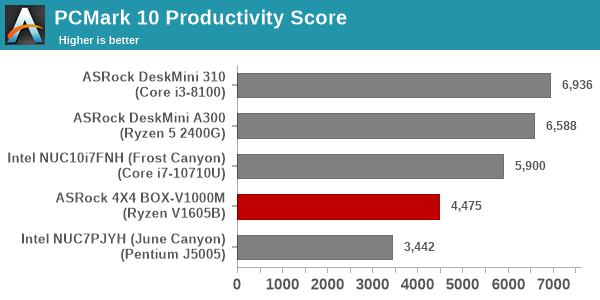
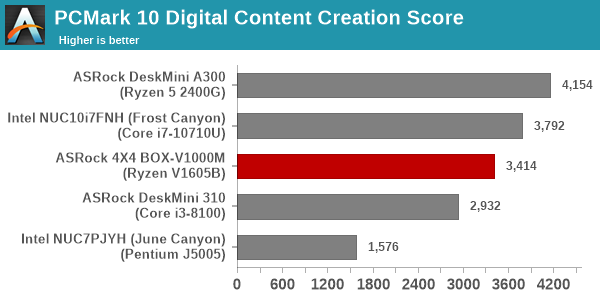
PCMark 10
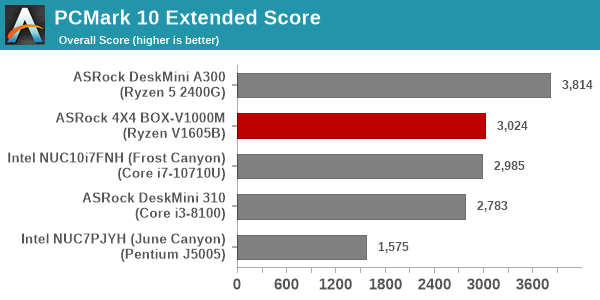
UL's PCMark 10 evaluates computing systems for various usage scenarios (generic / essential tasks such as web browsing and starting up applications, productivity tasks such as editing spreadsheets and documents, gaming, and digital content creation). We benchmarked select PCs with the PCMark 10 Extended profile and recorded the scores for various scenarios. These scores are heavily influenced by the CPU and GPU in the system, though the RAM and storage device also play a part. The power plan was set to Balanced for all the PCs while processing the PCMark 10 benchmark.

PCMark 8
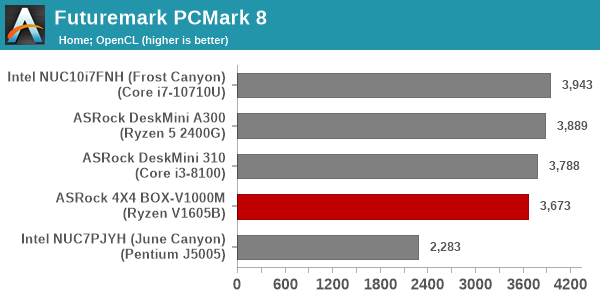
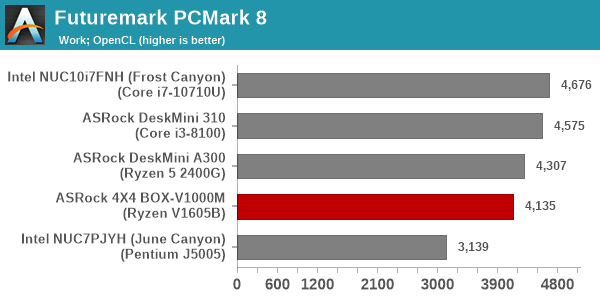
We continue to present PCMark 8 benchmark results (as those have more comparison points) while our PCMark 10 scores database for systems grows in size. PCMark 8 provides various usage scenarios (home, creative and work) and offers ways to benchmark both baseline (CPU-only) as well as OpenCL accelerated (CPU + GPU) performance. We benchmarked select PCs for the OpenCL accelerated performance in all three usage scenarios. These scores are heavily influenced by the CPU in the system.
3DMark
UL's 3DMark comes with a diverse set of graphics workloads that target different Direct3D feature levels. Correspondingly, the rendering resolutions are also different. We use 3DMark 2.4.4264 to get an idea of the graphics capabilities of the system. In this section, we take a look at the performance of the ASRock Industrial 4X4 BOX-V1000M across the different 3DMark workloads.
3DMark Ice Storm
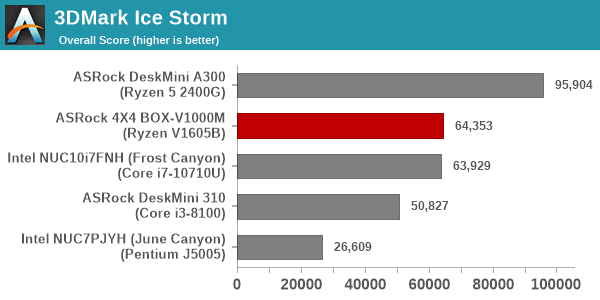
This workload has three levels of varying complexity - the vanilla Ice Storm, Ice Storm Unlimited, and Ice Storm Extreme. It is a cross-platform benchmark (which means that the scores can be compared across different tablets and smartphones as well). All three use DirectX 11 (feature level 9) / OpenGL ES 2.0. While the Extreme renders at 1920 x 1080, the other two render at 1280 x 720. The graphs below present the various Ice Storm worloads' numbers for different systems that we have evaluated.
| UL 3DMark - Ice Storm Workloads | |||
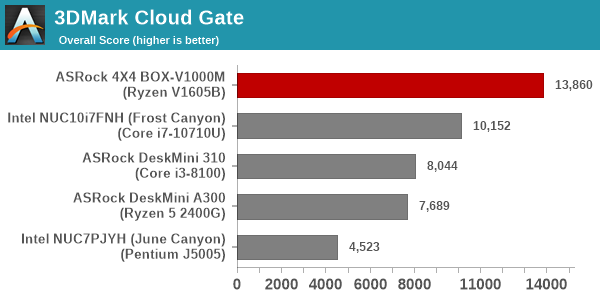
3DMark Cloud Gate
The Cloud Gate workload is meant for notebooks and typical home PCs, and uses DirectX 11 (feature level 10) to render frames at 1280 x 720. The graph below presents the overall score for the workload across all the systems that are being compared.
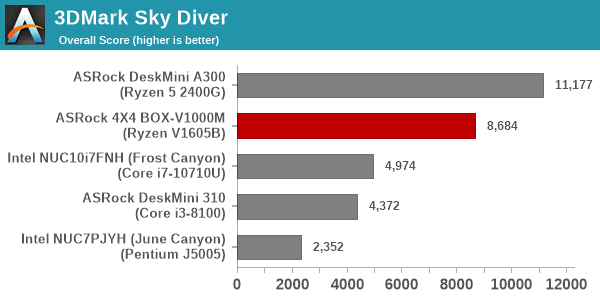
3DMark Sky Diver
The Sky Diver workload is meant for gaming notebooks and mid-range PCs, and uses DirectX 11 (feature level 11) to render frames at 1920 x 1080. The graph below presents the overall score for the workload across all the systems that are being compared.
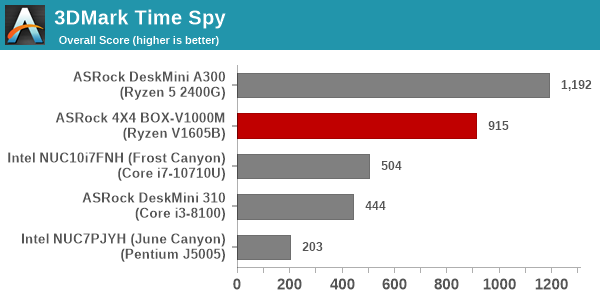
3DMark Time Spy
The Time Spy workload has two levels with different complexities. Both use DirectX 12 (feature level 11). However, the plain version targets high-performance gaming PCs with a 2560 x 1440 render resolution, while the Extreme version renders at 3840 x 2160 resolution. The graphs below present both numbers for all the systems that are being compared in this review.
| UL 3DMark - Time Spy Workloads | |||
3DMark Night Raid
The Night Raid workload is a DirectX 12 benchmark test. It is less demanding than Time Spy, and is optimized for integrated graphics. The graph below presents the overall score in this workload for different system configurations.
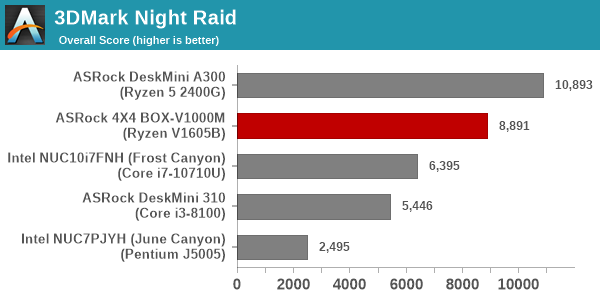
The inference from all of the above benchmark numbers is straightforward - the 4X4 BOX-V1000M leaves all Intel-based offerings (once priced significantly higher too) in the dust when it comes to graphics-intensive tasks. When the CPU comes into the picture, things aren't as rosy. Capabilities such as SpeedShift enable Intel-based systems to provide the extra burst of performance just when it is required for home usage scenarios. In CPU-bottlenecked tasks, the V1605B emerges as an also-ran - it performs better than the Gemini Lake-based June Canyon, but that is nothing to write home about given that the June Canyon is around half the cost of the 4X4 BOX-V1000M.
Miscellaneous Performance Metrics
This section looks at some of the other commonly used benchmarks representative of the performance of specific real-world applications.
3D Rendering - CINEBENCH R15
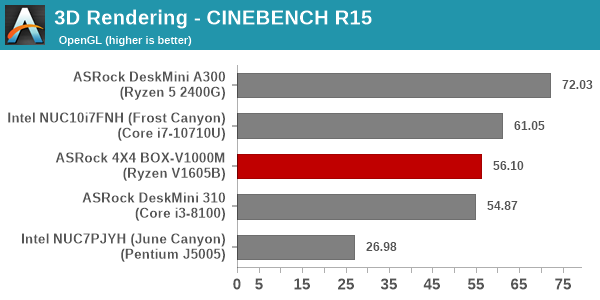
We use CINEBENCH R15 for 3D rendering evaluation. The program provides three benchmark modes - OpenGL, single threaded and multi-threaded. Evaluation of different PC configurations in all three modes provided us the following results.
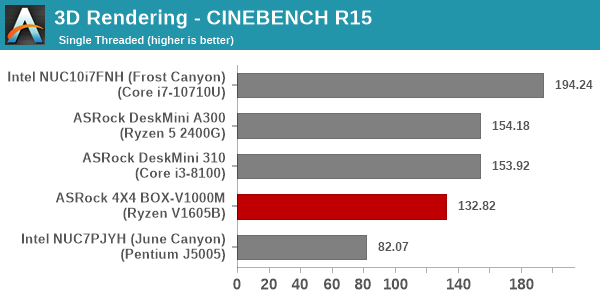
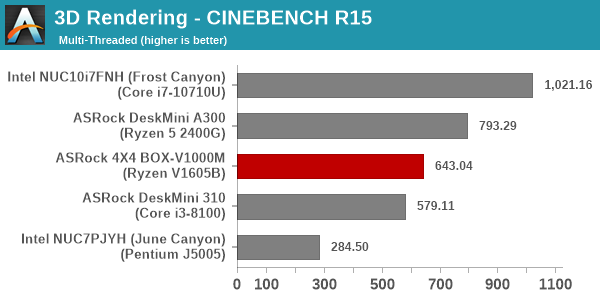
As seen in the UL benchmarks, the 4X4 BOX-V1000M manages to outperform only the Gemini Lake June Canyon in the single-thread case. However, with multi-threading, the octa-thread configuration manages to surpass the DeskMini 310 with a Core i3-8100 (4C/4T) having a much higher TDP.
x265 Benchmark
Next up, we have some video encoding benchmarks using x265 v2.8. The appropriate encoder executable is chosen based on the supported CPU features. In the first case, we encode 600 1080p YUV 4:2:0 frames into a 1080p30 HEVC Main-profile compatible video stream at 1 Mbps and record the average number of frames encoded per second.
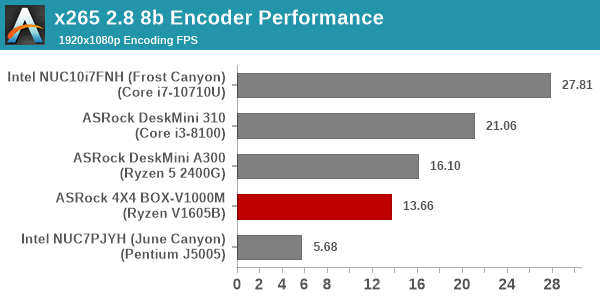
Our second test case is 1200 4K YUV 4:2:0 frames getting encoded into a 4Kp60 HEVC Main10-profile video stream at 35 Mbps. The encoding FPS is recorded.
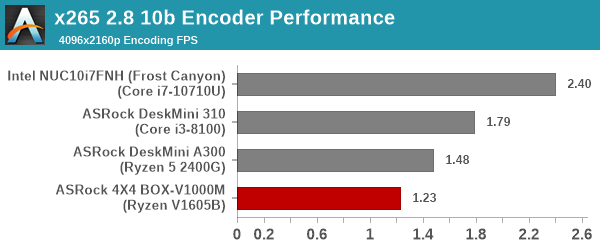
The observations for the previous benchmarks carry over to x265 also.
7-Zip
7-Zip is a very effective and efficient compression program, often beating out OpenCL accelerated commercial programs in benchmarks even while using just the CPU power. 7-Zip has a benchmarking program that provides tons of details regarding the underlying CPU's efficiency. In this subsection, we are interested in the compression and decompression rates when utilizing all the available threads for the LZMA algorithm.
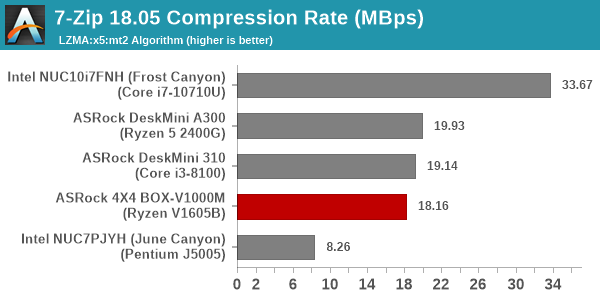
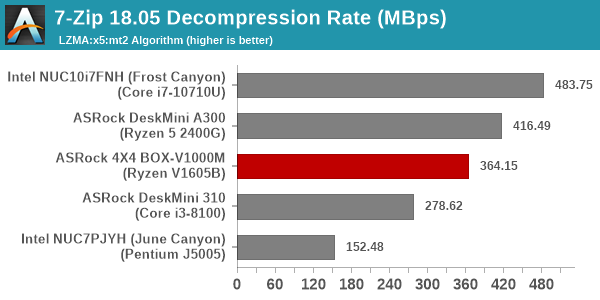
We see the multi-threaded benchmark helping the 4X4 BOX-V1000M to surpass the DeskMini 310's Core i3-8100. Other than that, the observations for Cinebench R15 are valid here too.
Cryptography Benchmarks
Cryptography has become an indispensable part of our interaction with computing systems. Almost all modern systems have some sort of hardware-acceleration for making cryptographic operations faster and more power efficient. In this sub-section, we look at two different real-world applications that may make use of this acceleration.
BitLocker is a Windows features that encrypts entire disk volumes. While drives that offer encryption capabilities are dealt with using that feature, most legacy systems and external drives have to use the host system implementation. Windows has no direct benchmark for BitLocker. However, we cooked up a BitLocker operation sequence to determine the adeptness of the system at handling BitLocker operations. We start off with a 2.5GB RAM drive in which a 2GB VHD (virtual hard disk) is created. This VHD is then mounted, and BitLocker is enabled on the volume. Once the BitLocker encryption process gets done, BitLocker is disabled. This triggers a decryption process. The times taken to complete the encryption and decryption are recorded. This process is repeated 25 times, and the average of the last 20 iterations is graphed below.
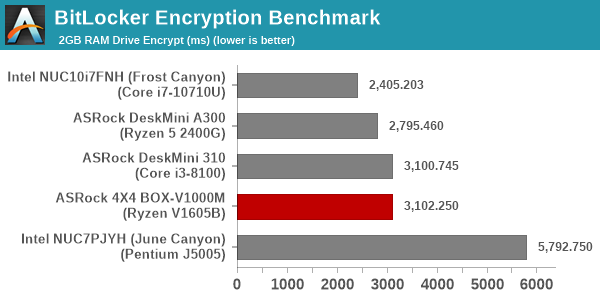
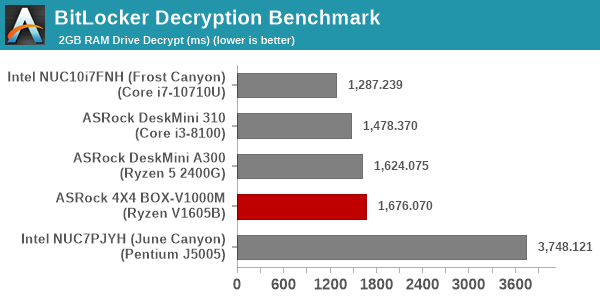
Hardware accelerated cryptographic functions ensure that the gulf between the non-Gemini Lake systems is not very wide.
Creation of secure archives is best done through the use of AES-256 as the encryption method while password protecting ZIP files. We re-use the benchmark mode of 7-Zip to determine the AES256-CBC encryption and decryption rates using pure software as well as AES-NI. Note that the 7-Zip benchmark uses a 48KB buffer for this purpose.
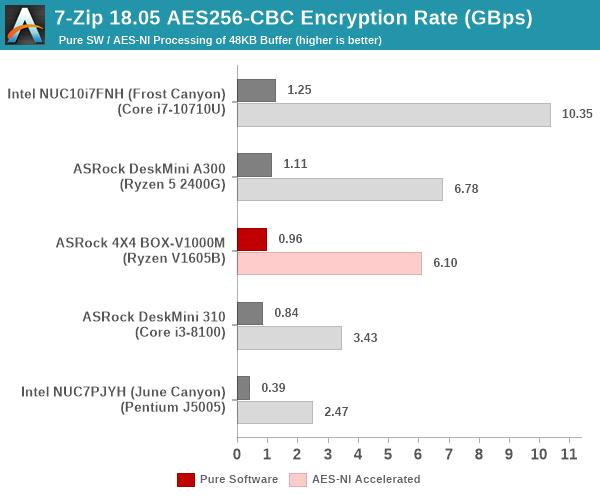
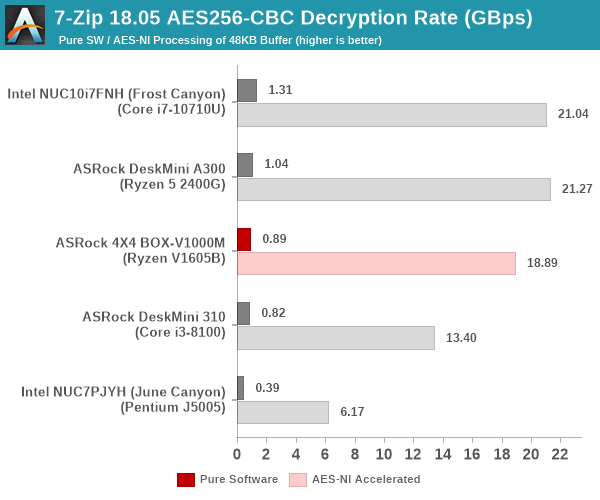
Here, we again see the 4X4 BOX-V1000M land in the middle of the pack by managing to outperform the Core i3-8100-equipped DeskMini 310.
Yet another cryptography application is secure network communication. OpenSSL can take advantage of the acceleration provided by the host system to make operations faster. It also has a benchmark mode that can use varying buffer sizes. We recorded the processing rate for a 8KB buffer using the hardware-accelerated AES256-CBC-HAC-SHA1 feature.
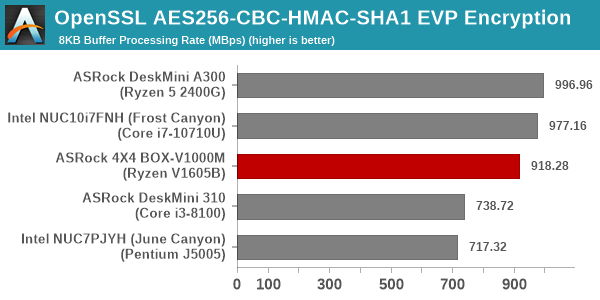
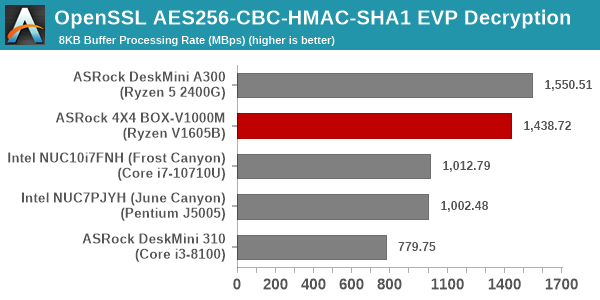
While the performance of the systems is along expected lines for the encryption benchmark, the decryption one seems to heavily favor the Ryzen boards - a detailed analysis of the workload could possibly explain why, but that is beyond the scope of this review.
Agisoft Photoscan
Agisoft PhotoScan is a commercial program that converts 2D images into 3D point maps, meshes and textures. The program designers sent us a command line version in order to evaluate the efficiency of various systems that go under our review scanner. The command line version has two benchmark modes, one using the CPU and the other using both the CPU and GPU (via OpenCL). We present the results from our evaluation using the CPU mode only. The benchmark (v1.3) takes 84 photographs and does four stages of computation:
- Stage 1: Align Photographs (capable of OpenCL acceleration)
- Stage 2: Build Point Cloud (capable of OpenCL acceleration)
- Stage 3: Build Mesh
- Stage 4: Build Textures
We record the time taken for each stage. Since various elements of the software are single threaded, and others multithreaded, it is interesting to record the effects of CPU generations, speeds, number of cores, and DRAM parameters using this software.
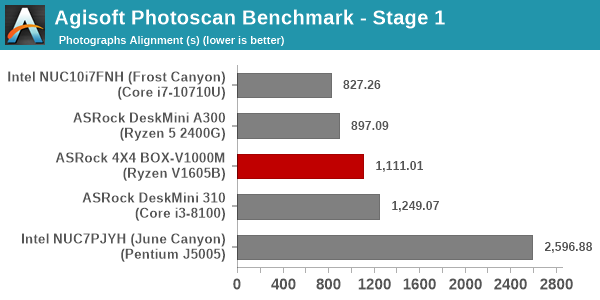
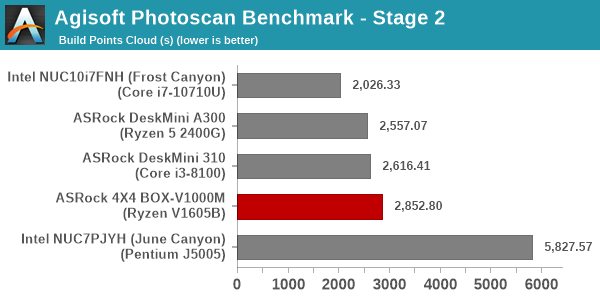
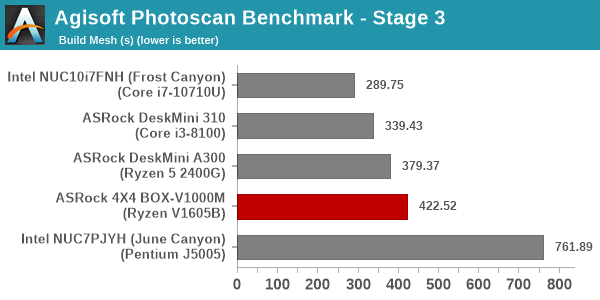
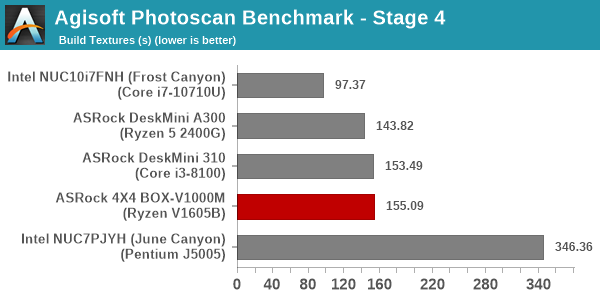
The performance of the 4X4 BOX-V1000M is along the lines of what was observed for the other benchmarks.
Dolphin Emulator
Wrapping up our application benchmark numbers is the new Dolphin Emulator (v5) benchmark mode results.
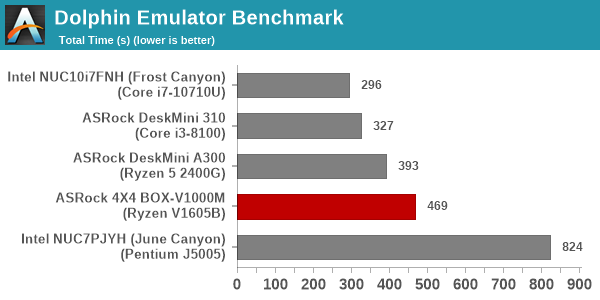
This is again a test of the CPU capabilities, and the Ryzen V1605B manages to better only the Gemini Lake Pentium J5005 among all the compared systems.
HTPC Credentials - Display Outputs and Streaming Capabilities
The
| ASRock Industrial 4X4 BOX-V1000M Display Outputs | ||
| HDMI | 2x DisplayPort | |
| Version | 2.0a | 1.2 |
| Max. Video Output | 3840x2160 @ 60Hz | 4096x2160 @ 60Hz |
| HDCP | Yes (2.2) | |
| HDR | Yes | Yes |
| HD Audio Bitstreaming | Yes | |
Supporting the display of high-resolution protected video content is a requirement for even a casual HTPC user. In addition, HTPC enthusiasts also want their systems to support refresh rates that either match or be an integral multiple of the frame rate of the video being displayed. Most displays / AVRs are able to transmit the supported refresh rates to the PC using the EDID metadata. In some cases, the desired refresh rate might be missing in the list of supported modes.
Refresh Rates Support
Our evaluation of the

The gallery below presents screenshots from the other refresh rates that were tested. The system has no trouble maintaining a fairly accurate refresh rate throughout the duration of the video playback.


Streaming Services
Despite supporting HDCP 2.2, the absence of a supported secure enclave prevents UltraHD Blu-ray playback on the 4X4 BOX-V1000M. Additionally, PlayReady 3.0 was also not available at the time of review - this meant that 4K and HDR Netflix streams were unavailable, and the maximum quality was limited to 5.8 Mbps / 1080p.
The move to 4K, and the need to evaluate HDR support as part of our HTPC testing have made us choose Mystery Box's Peru 8K HDR 60FPS video as our YouTube test sample. On PCs running Windows, it is recommended that HDR streaming videos be viewed using the Microsoft Edge browser after putting the desktop in HDR mode.

The system has no trouble playing back the VP9 Profile 2 HDR video with hardware acceleration, as evident from the dropped frame statistics in the above screenshot.
Various metrics of interest such as GPU usage and at-wall power consumption were recorded for the first four minutes of the playback of the above video. The numbers are graphed below.

The GPU usage is around 70% and the at-wall power consumption is slightly south of 40W for the 4K HDR YouTube playback test.
HTPC Credentials - Local Media Playback and Video Processing
Evaluation of local media playback and video processing is done by playing back files encompassing a range of relevant codecs, containers, resolutions, and frame rates. A note of the efficiency is also made by tracking GPU usage and power consumption of the system at the wall. Users have their own preference for the playback software / decoder / renderer, and our aim is to have numbers representative of commonly encountered scenarios. Towards this, we played back the test streams using the following combinations:
- MPC-HC x64 1.8.5 + LAV Video Decoder (DXVA2 Native) + Enhanced Video Renderer - Custom Presenter (EVR-CP)
- MPC-HC x64 1.8.5 + LAV Video Decoder (D3D11) + madVR 0.92.17 (DXVA-Focused)
- MPC-HC x64 1.8.5 + LAV Video Decoder (D3D11) + madVR 0.92.17 (Lanczos-Focused)
- VLC 3.0.8
- Kodi 18.6
The thirteen test streams (each of 90s duration) were played back from the local disk with an interval of 30 seconds in-between. Various metrics including GPU usage and at-wall power consumption were recorded during the course of this playback. Prior to looking at the metrics, a quick summary of the decoding capabilities of the Vega 8 integrated GPU is useful to have for context.
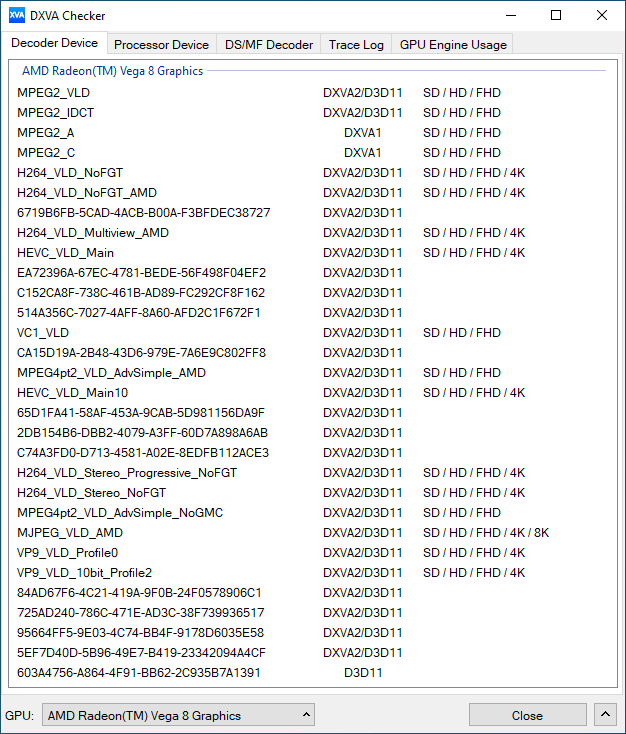
Accelerated decoding support up to 4K resolution is available for AVC, HEVC (8b and 10b), MPEG-4, and VP9 (8b and 10b). MJPEG decoding support exists for up to 8K resolution and VC1 for up to 1080p.
All our playback tests were done with the desktop HDR setting turned on. It is possible for certain system configurations to have madVR automatically turn on/off the HDR capabilities prior to the playback of a HDR video, but, we didn't take advantage of that in our testing.
VLC and Kodi
VLC is the playback software of choice for the average PC user who doesn't need a ten-foot UI. Its install-and-play simplicity has made it extremely popular. Over the years, the software has gained the ability to take advantage of various hardware acceleration options. Kodi, on the other hand, has a ten-foot UI making it the perfect open-source software for dedicated HTPCs. Support for add-ons make it very extensible and capable of customization. We played back our test files using the default VLC and Kodi configurations, and recorded the following metrics.
| Video Playback Efficiency - VLC and Kodi | |||
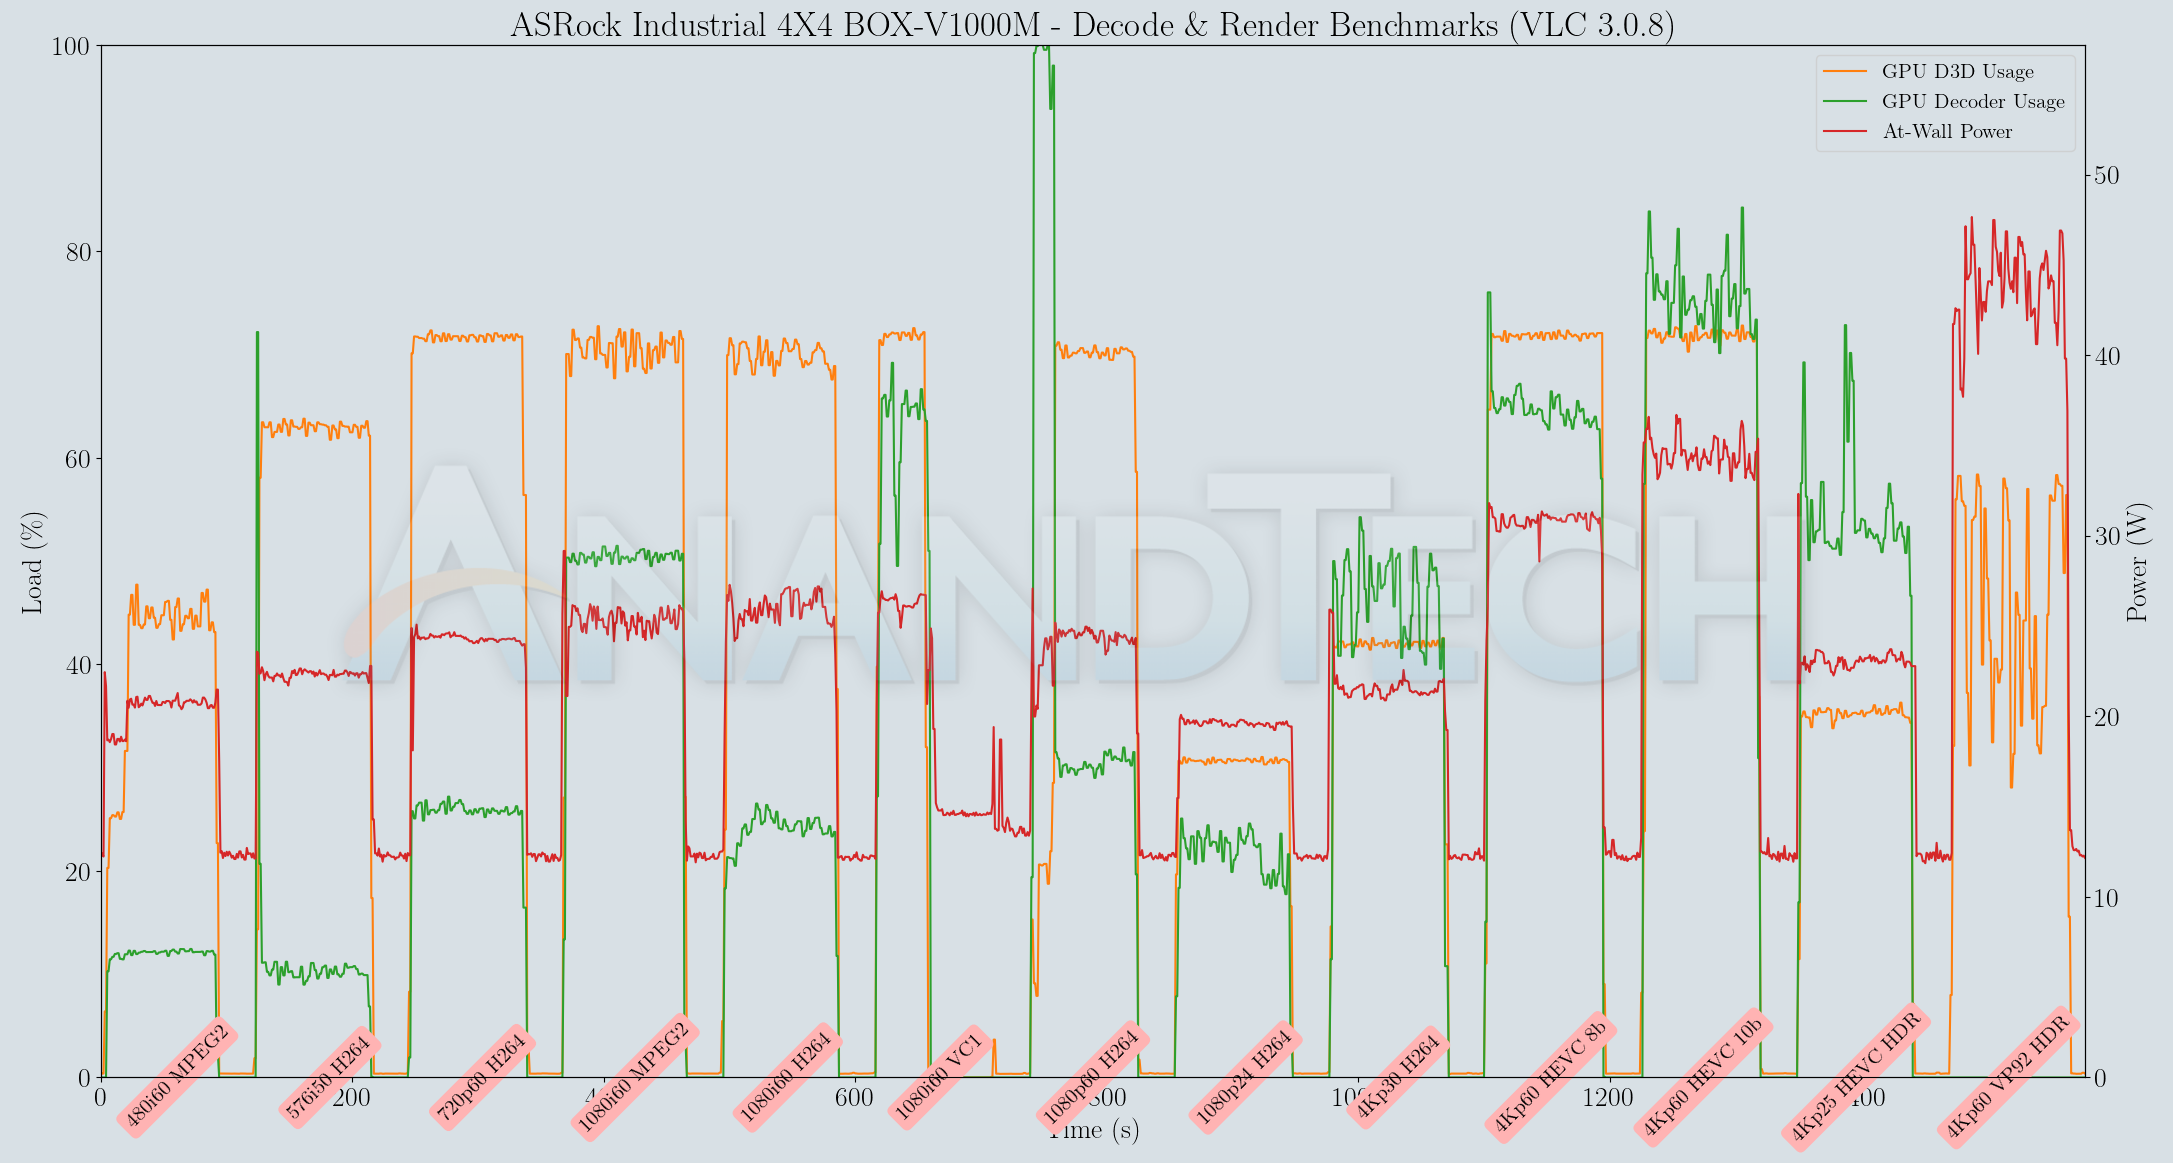
The graphs above indicate that the decoding of the interlaced VC-1 stream is finicky with both VLC and Kodi. Another interesting aspect is that VLC doesn't use accelerated decoding for the VP9 Profile 2 stream, while Kodi does. Other than VC-1 playback (which was fine with the official Video player app in Windows), the decoder testing process was smooth. At-Wall power consumption for the system ranged from 20W-45W depending on the stream and the player.
MPC-HC
MPC-HC offers an easy way to test out different combinations of decoders and renderers. The first configuration we evaluated is the default post-install scenario, with only the in-built LAV Video Decoder forced to DXVA2 Native mode. Two additional passes were done with different madVR configurations. In the first one (DXVA-focused), we configured madVR to make use of the DXVA-accelerated video processing capabilities as much as possible. In the second (Lanczos-focused), the image scaling algorithms were set to 'Lanczos 3-tap, with anti-ringing checked'. Chroma upscaling was configured to be 'BiCubic 75 with anti-ringing checked' in both cases. The metrics collected during the playback of the test files using the above three configurations are presented below.
| Video Playback Efficiency - MPC-HC with EVR-CP and madVR | |||
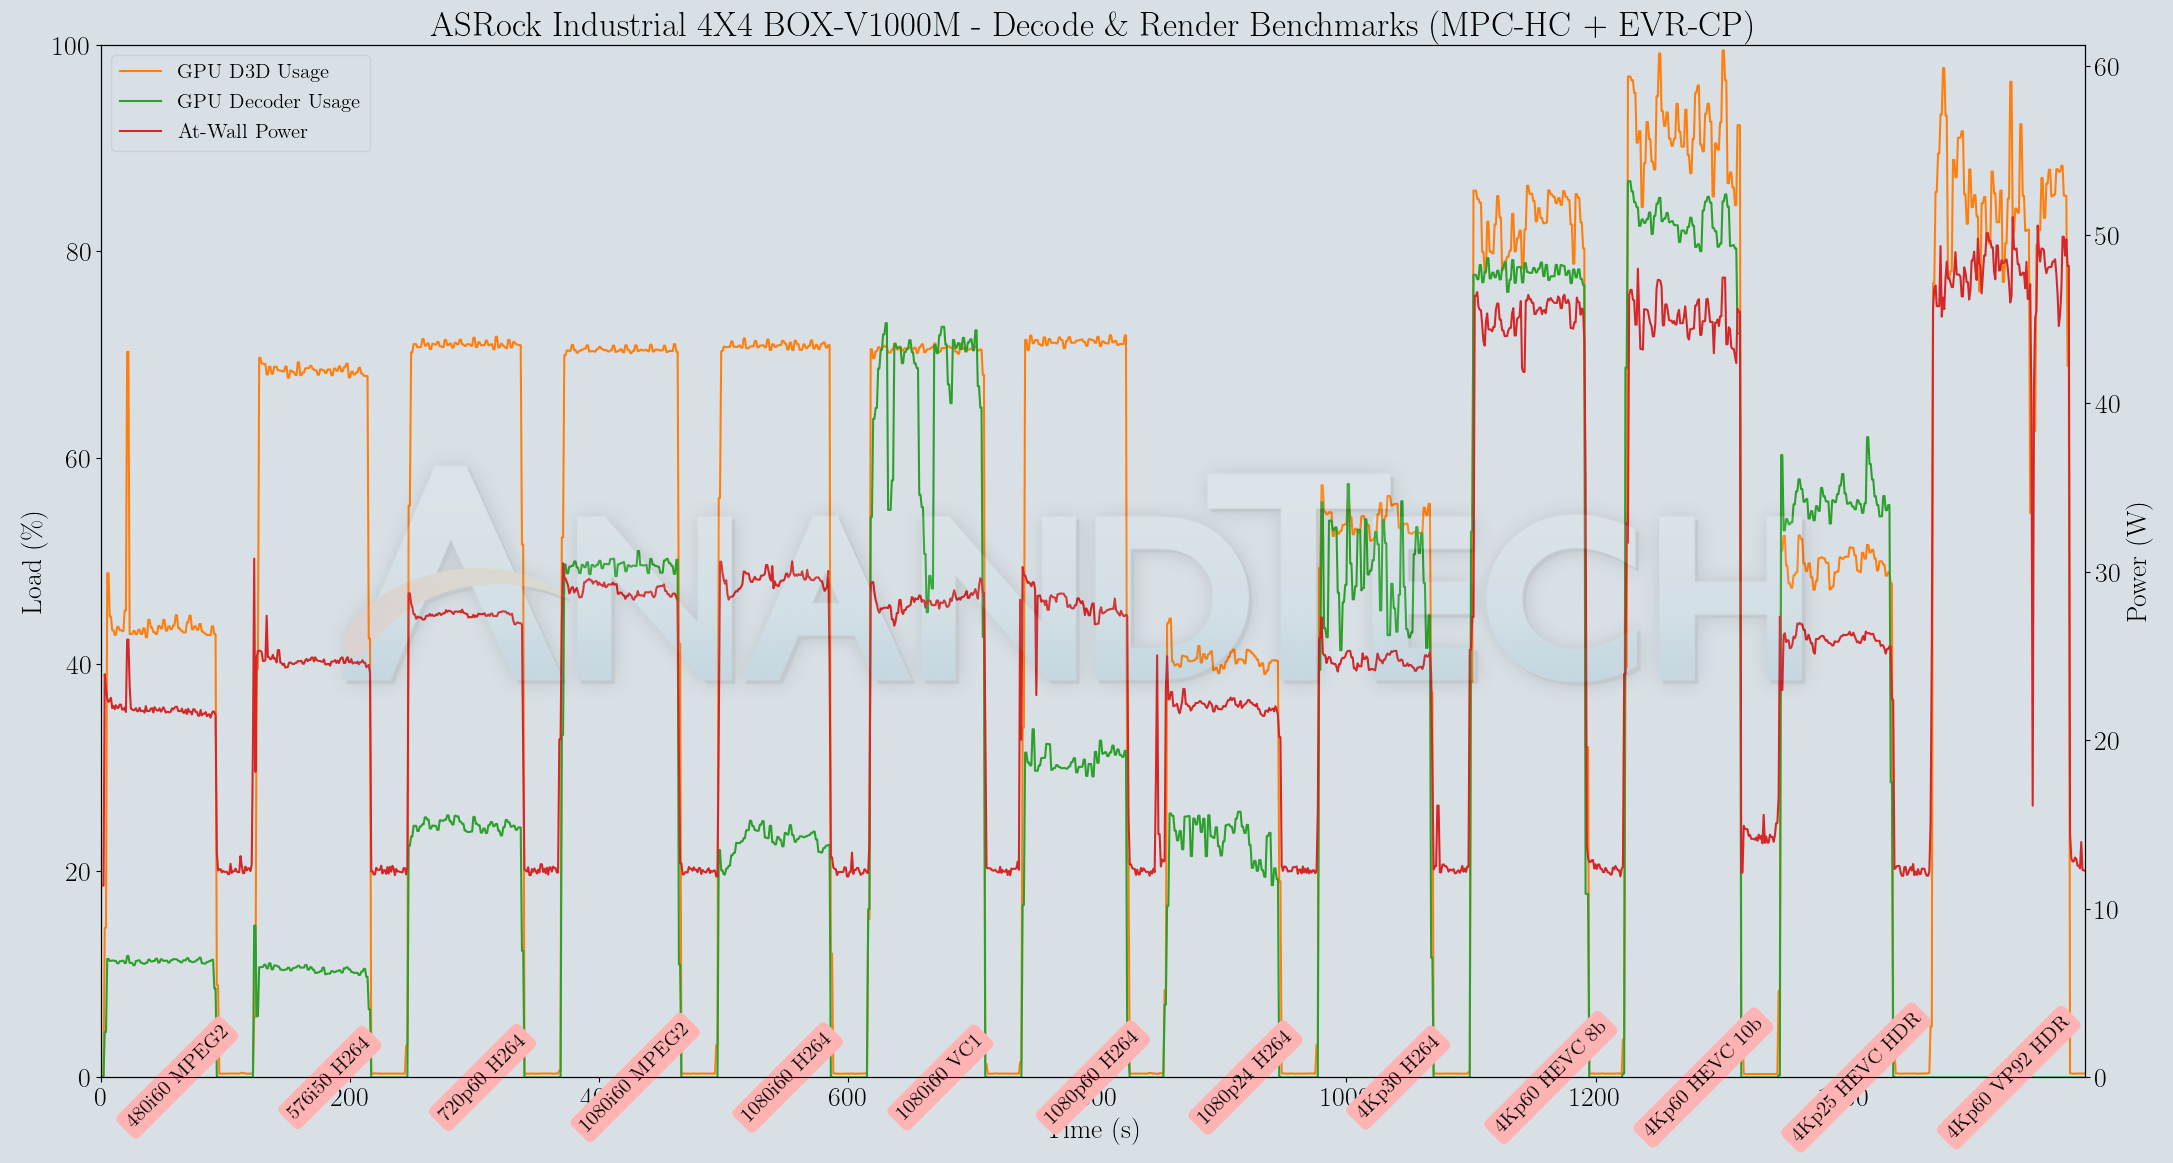
The 4Kp60 streams were a hit or a miss with the different combinations tested above. VC-1 playback was sensitive to madVR settings (working well with DXVA scaling, but failing with the custom configuration). Other 1080p and lower resolution streams had no trouble in playback even with the upscaling to 4K in the picture. These are to be expected, given that madVR is meant to mostly be used with discrete GPUs.
Power Consumption and Thermal Performance
The power consumption at the wall was measured with a 4K display being driven through the HDMI port. In the graph below, we compare the idle and load power of the ASRock Industrial 4X4 BOX-V1000M with other low power PCs evaluated before. For load power consumption, we ran the AIDA64 System Stability Test with various stress components, and noted the maximum sustained power consumption at the wall.
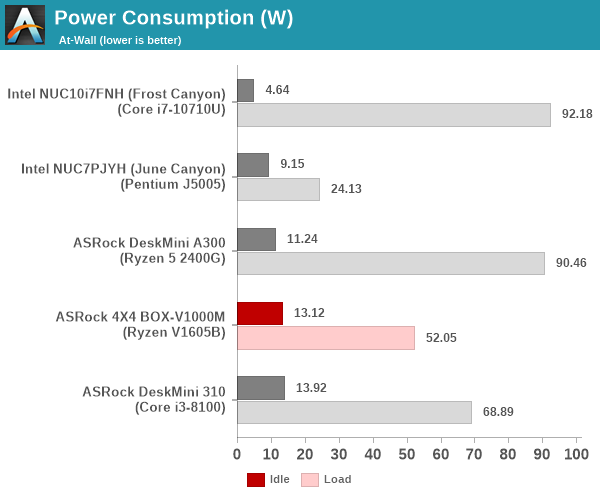
The load power consumption of the 4X4 BOX-V1000M is reasonable given that no external peripherals were connected to the system, However, the idling power is a big cause for concern. In fact, it falls in the same league as the idling power for systems equipped with 65W TDP CPUs.
Our thermal stress routine starts with the system at idle, followed by four stages of different system loading profiles using the AIDA64 System Stability Test (each of 30 minutes duration). In the first stage, we stress the CPU, caches and RAM. In the second stage, we add the GPU to the above list. In the third stage, we stress the GPU standalone. In the final stage, we stress all the system components (including the disks). Beyond this, we leave the unit idle in order to determine how quickly the various temperatures in the system can come back to normal idling range. The various clocks, temperatures and power consumption numbers for the system during the above routine are presented in the graphs below.
| ASRock 4X4 BOX-V1000M System Loading with the AIDA64 System Stability Test | |||
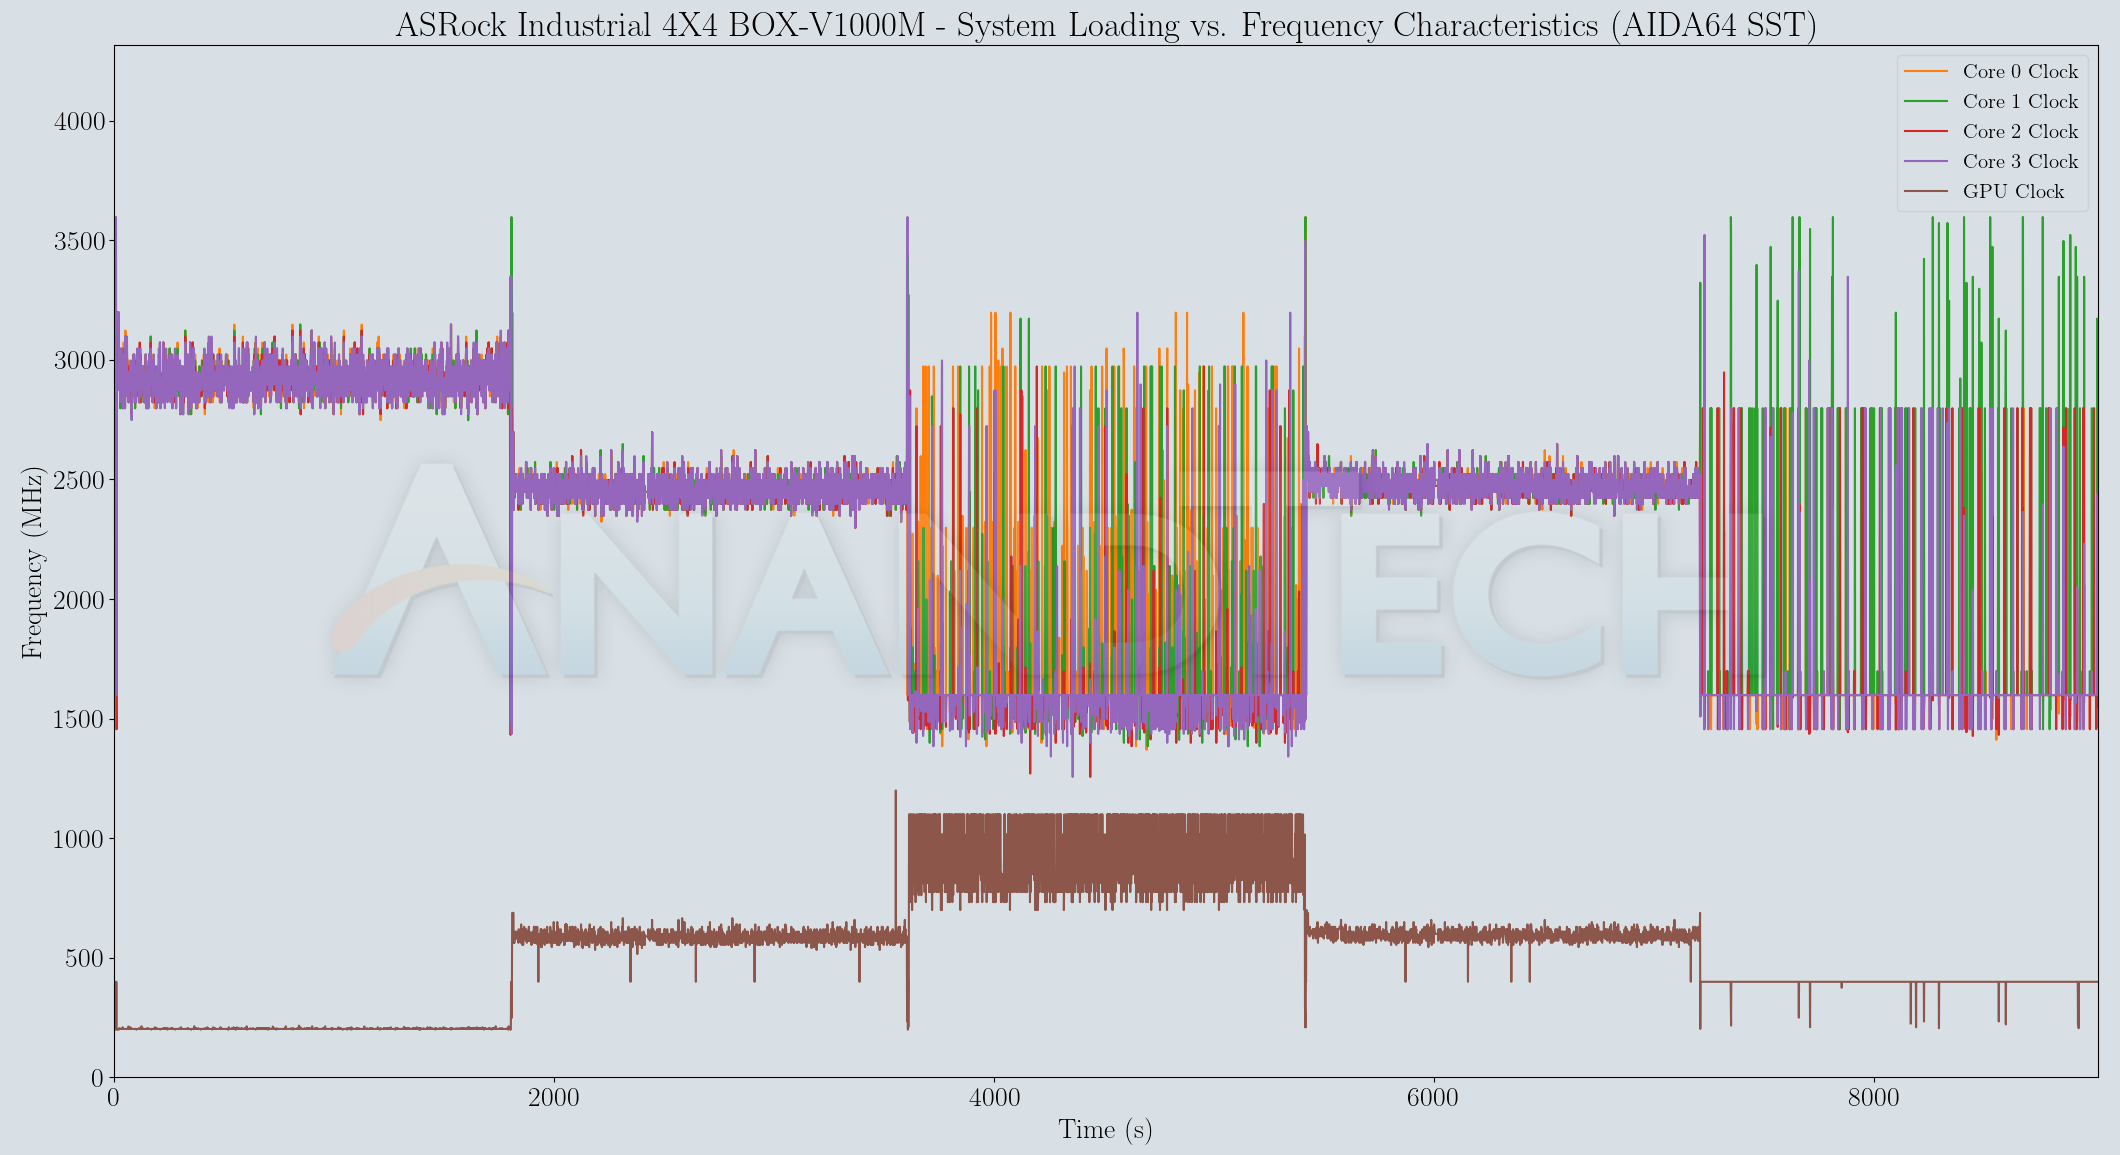
There are no surprises in store - the cores stayed above the rated 2 GHz whenever the CPU was supposed to be actively working.The temperatures didn't go beyond 70C - the noisy fan curves (which has since been fixed by ASRock Industrial in the move from BIOS 1.1 to 1.40) definitely help in this aspect. The power numbers are a bit interesting - While the SoC starts off with a 25W spike, it settles down to around 22W quite quickly for the duration of the stress test. The at-wall consumption is steady around 50W during the process.
| ASRock 4X4 BOX-V1000M System Loading with Prime95 and Furmark | |||
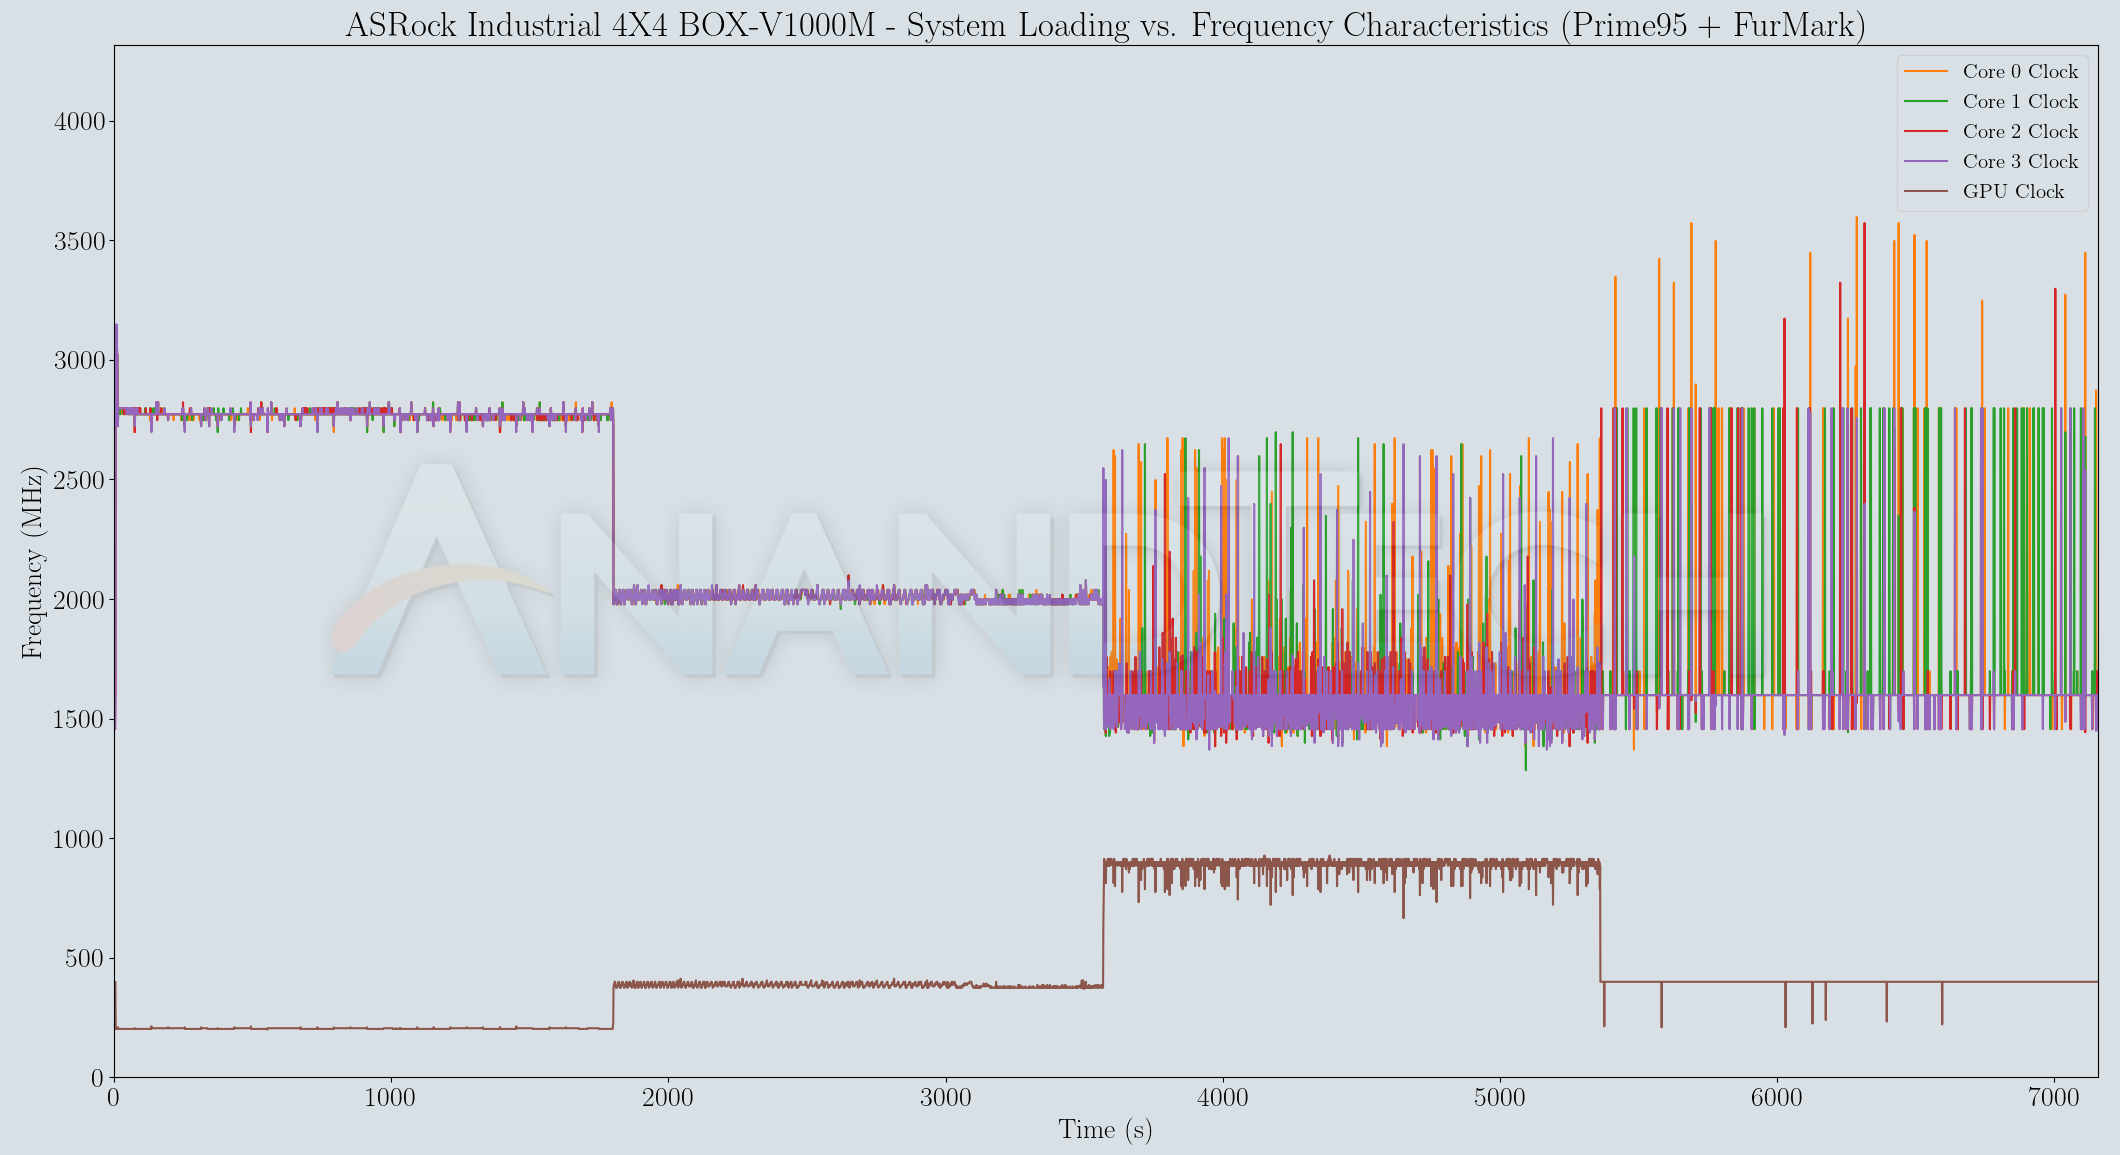
Our custom stress test using Prime95 and FurMark also shows similar behavior profiles for the frequencies, temperatures and power consumption numbers.
According to the official specifications, the junction temperature of the V1605B is 105C. The thermal solution is very conservative and doesn't allow the SoC to reach anywhere near that number. Based on the frequencies of various SoC blocks, there was no thermal throttling at play either. Overall, ASRock Industrial has managed to create an effective, albeit noisy, thermal solution for the 4X4 BOX-V1000M.
Concluding Remarks
AMD NUCs such as the ASRock Industrial 4X4 BOX-V1000M represent the first serious non-Intel x86 play in the burgeoning UCFF PC market. Single-board computers (SBCs) have also developed well beyond their embedded markets focus, thanks to the popularity of Raspberry Pi and similar ARM-based kits. x86 has generally played second-fiddle in this market (mainly due to the cost factor).
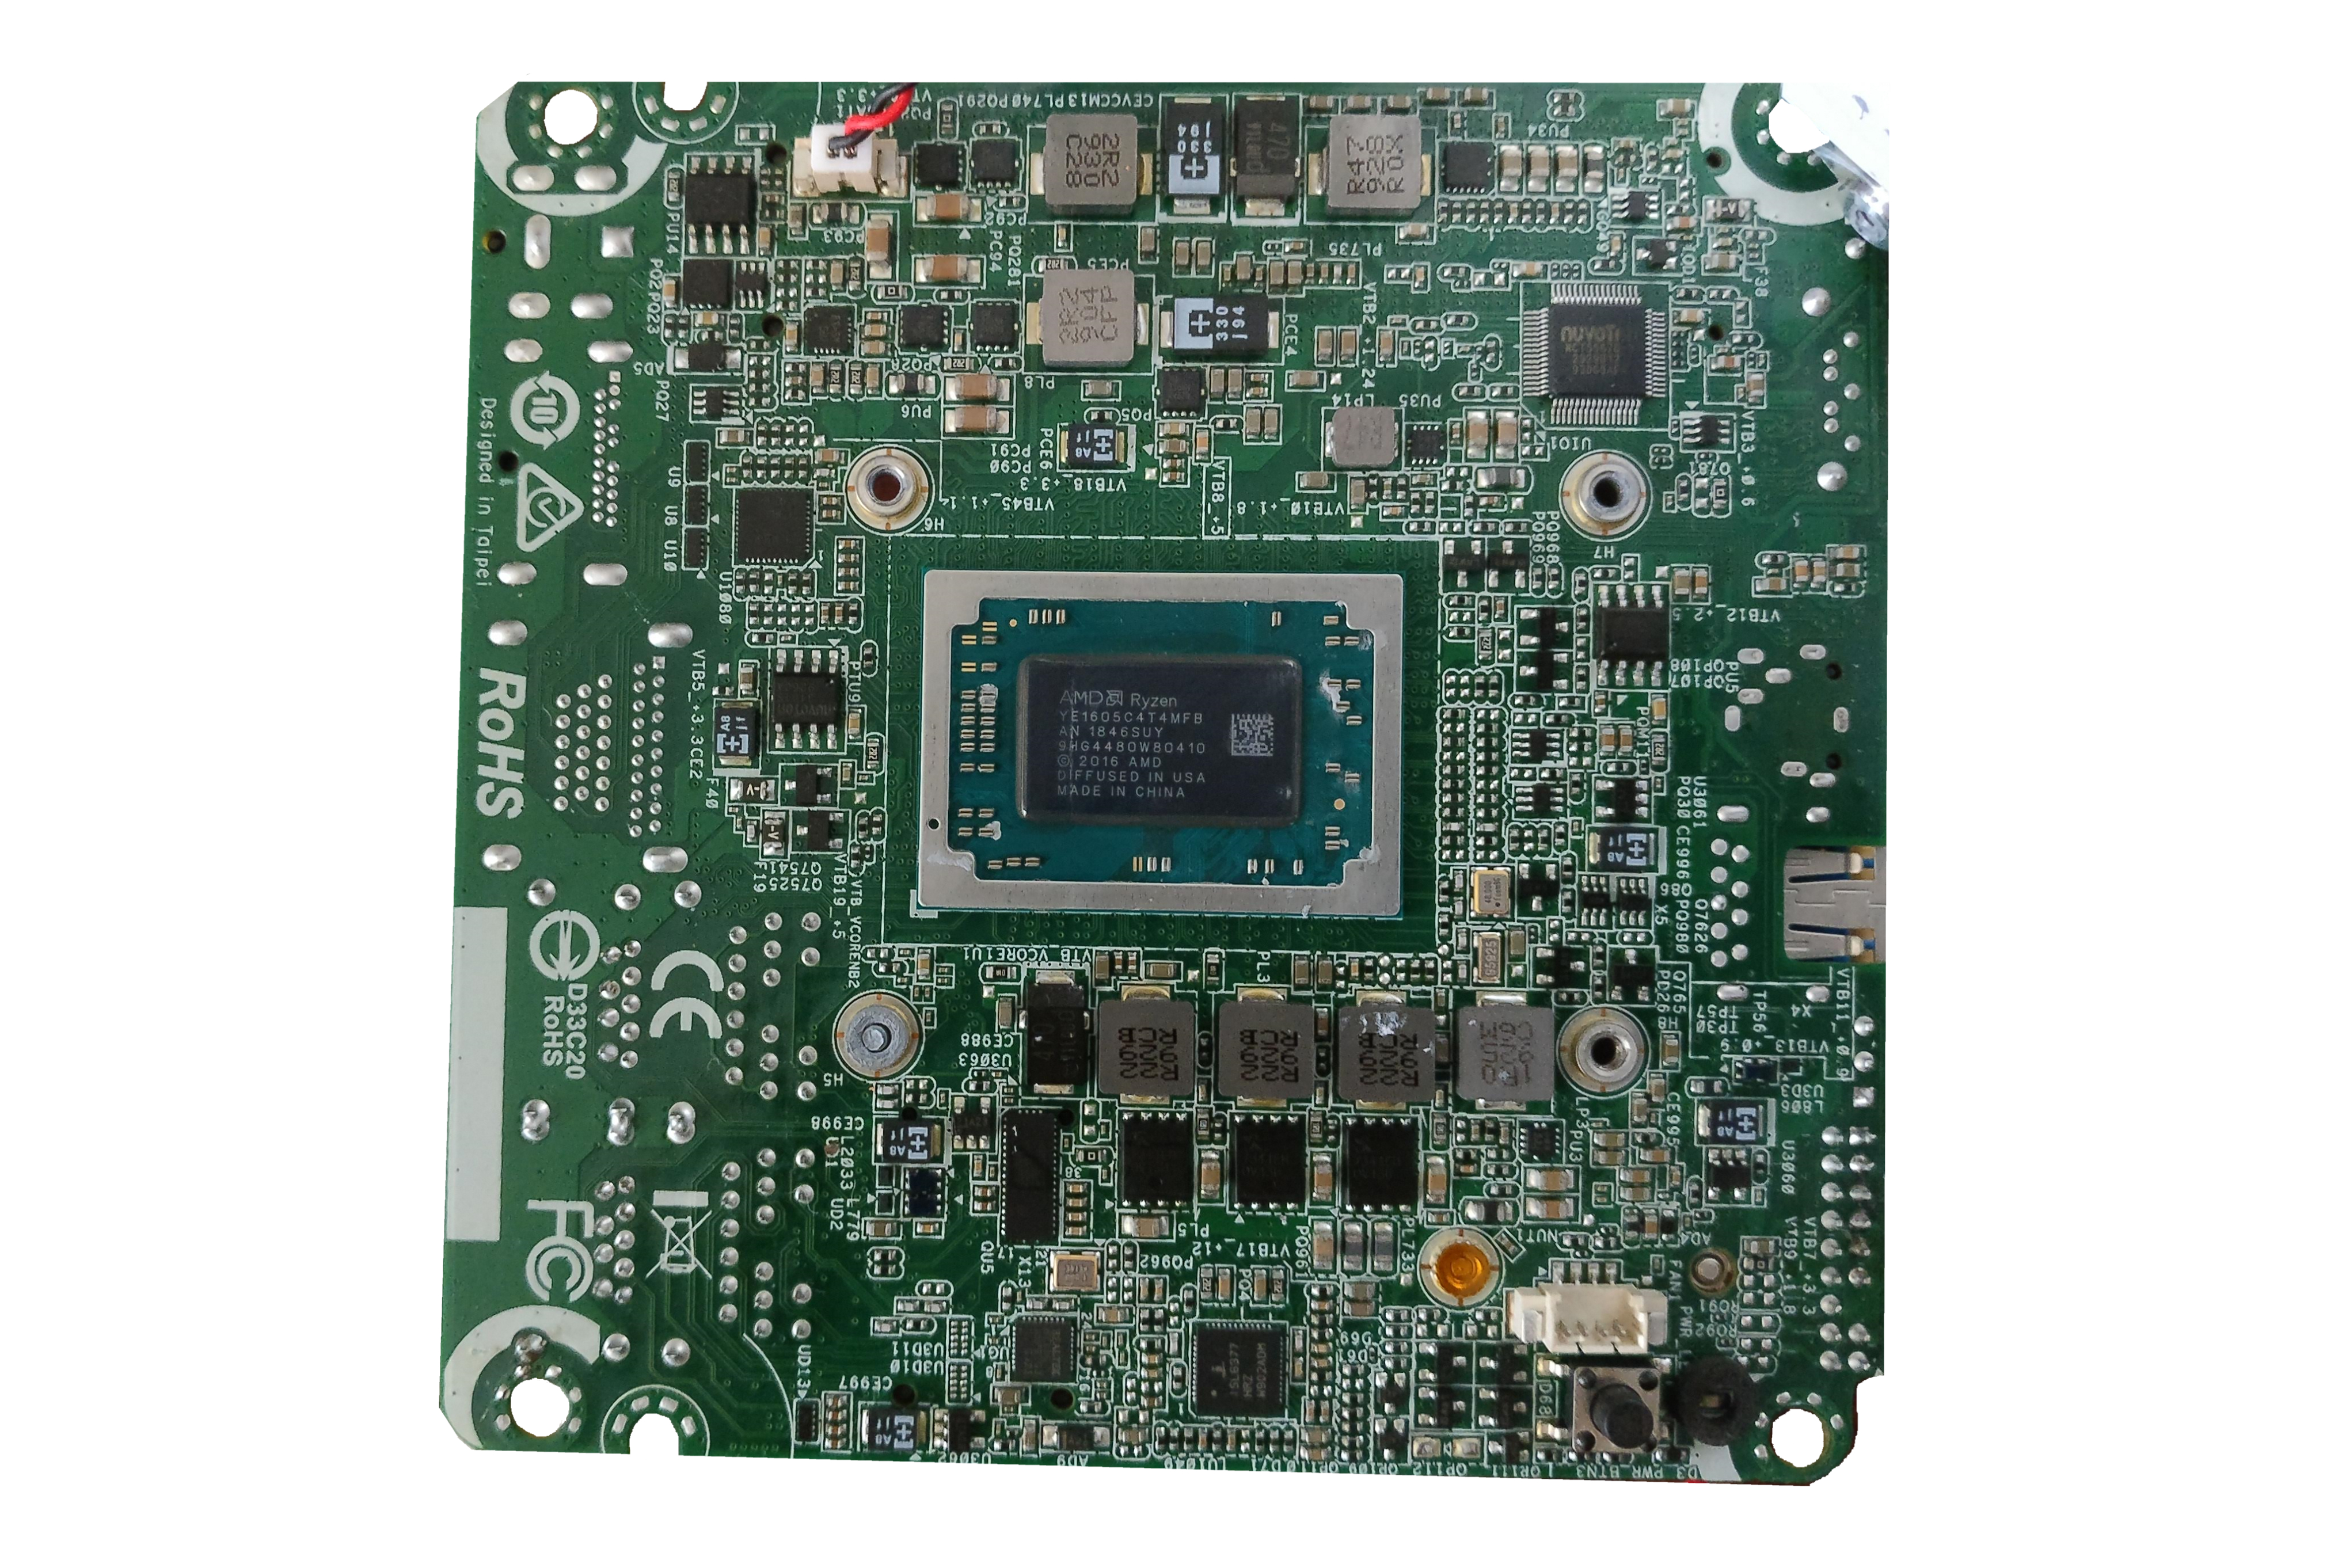
The Ryzen Embedded V1605B Package
Intel's Atom-class SoCs have made some inroads in this segment, and the Ryzen Embedded series has enabled AMD to join the party. While vendors such as Udoo target the maker market with their Ryzen Embedded SBCs such as the Bolt v8, ASRock Industrial has adopted Intel's approach of selling boards and kits as separate SKUs for the NUCs - the SBC used inside the 4X4 BOX-V1000M (the 4X4-V1000M) is available for standalone purchase by other system integrators and computing solution providers. AMD's partners such as OnLogic have gone ahead and done exactly that to create systems such as the OnLogic ML100G-40.

OnLogic's ML100G-40
Consumers finding the performance and characteristics of the 4X4 BOX-V1000M suitable for their applications may require a pre-assembled passively-cooled configuration with ingress protection for deployment. The OnLogic ML100G-40 based on the 4X4-V1000M from ASRock Industrial is a perfect fit for that scenario. It must be noted that the Ryzen Embedded Series and ASRock Industrial / OnLogic's offering comes with a 10-year support cycle - this is important for industrial deployments.
In the preceding sections, we took a detailed look at the internals of the 4X4 BOX-V1000M, and subjected it to a variety of workloads typically run on compact PCs in home / SOHO / industrial environments. Storage and wireless networking benchmarks are usually run as part of our test suite, but not presented in this review because a SATA SSD was used in a slot that also supports NVMe SSDs. Comparing against other systems equipped with NVMe SSDs on the storage subsystem aspect is unlikely to provide any useful information. The Intel Wireless-AC 3168 is also a dated WLAN card (The Wi-Fi 6 AX200 has since taken over as the de-facto WLAN component in most computers today). With theoretical speeds of up to 433 Mbps, the 3168 card seems to have been put in place as a check-box item. In any case, applications requiring the latest wireless standards and peak performance can always replace the Wireless-AC 3168 module with a Wi-Fi 6 card such as the Intel AX200 - Note that only the PCIe version of the card is compatible, and not the CNVIo 2 one.
Overall, the 4X4 BOX-V1000M has given us with the opportunity to evaluate an AMD NUC after a gap of more than six years. In that time frame, AMD has scripted a remarkable turnaround. Due to the HEDT focus (at least on the marketing front) of the first-generation Zen microarchitecture and the resulting Ryzen CPUs, our expectations from the Ryzen Embedded V1605B SoC in the 4X4 BOX-V1000M were modest. In the end, we were pleasantly surprised. That said, the system has both pluses and minuses.
Pros:
- The physical footprint of the system compares very favorably to the existing AMD SFF PCs based on mini-STX boards. The 4X4 and the Intel NUC form-factors are essentially equivalent.
- The chassis design and thermal solution allow for a sustained power consumption of around 22W for the V1605B SoC without any throttling
- The 4X4 BOX-V1000M ships with two gigabit Ethernet ports, auguring well for usage in networking applications
- The system supports three simultaneous 4Kp60 displays - a feature not available in equivalently priced Intel-based NUCs
- The performance-per-dollar aspect is impressive for multi-threaded and graphics workloads compared to the current Intel-based NUCs
Cons:
- There is no support on the motherboard for the commonly-used M.2 2280 SSD form-factor (Only M.2 2242 and 2260 are supported in the available slot), and the chassis design doesn't allow for easy installation of the SODIMMs
- The bundled single-stream Wi-Fi 5 (802.11ac) WLAN card seems like a check-box item. It may have been better to reduce the system cost by not bundling a WLAN component, given that the 4X4-V1000M board has an user-upgradable slot for the same
- The single-threaded performance is a tad disappointing, as is the performance-per-watt metric. However, the newer generation Ryzens are likely to bring better news on this front
- AMD GPU drivers are not the best when it comes to stability
On the drivers aspect, certain popular productivity and creativity programs occasionally crash or hang. Driver updates often fix the issues (and sometimes create new ones in the process). While flaky drivers are the bane for all GPU vendors, it is an unfortunate fact that GPU drivers on AMD-based systems have given us more trouble during SFF PC benchmarking than others. That said, the applications for the Ryzen Embedded series are such that the expected workloads are usually sanitized thoroughly prior to deployment. New drivers are deployed only after qualification. The thermal solution and the PL1 / PL2 performance turbo scheme are tightly coupled aspects not discussed in the above lists - while the thermal solution is excellent in keeping things cool without throttling, the fan noise is not attractive. Recent BIOS updates have apparently modified the fan curves for better user experience. ASRock Industrial has also been conservative in configuring the PL1 / PL2 values. In the case of the Frost Canyon NUC, we saw the instantaneous package power go as high as 42W (with the Core i7-10710U operating in cTDPup mode of 25W). The 4X4 BOX-V1000M goes up to 26W before settling down at 22W. Given that the board is designed for industrial environments with possibly high thermal stress, the conservative approach can't be faulted.
The barebones version of the ASRock Industrial 4X4 BOX-V1000M is available for $390. We have seen it priced as low as $360 previously. All things said, the performance-per-dollar metric is excellent for this first-generation product. ASRock Industrial has already launched the second generation version using Renoir APUs, though its appearance at e-tail outlets is not imminent. Another aspect to consider is that the 4X4-V1000M board has a 10-year support cycle (due to the use of the Ryzen Embedded SoC). The longevity support is not available for the Renoir APU version. In conclusion, exciting times are in store for UCFF PC enthusiasts with the appearance of AMD-based NUCs like the 4X4 BOX-V1000M.


