Original Link: https://www.anandtech.com/show/6710/intel-ssd-525-review-240gb
Intel SSD 525 Review (240GB)
by Anand Lal Shimpi on January 30, 2013 1:42 AM ESTThe mSATA SSD space has been heating up over the past year as Ultrabooks and other small form factor devices like Intel’s NUC have continued to grow in popularity. While mostly a placeholder until M.2 (formerly NGFF) SSDs show up on the market, mSATA drives are currently the only solution if you need a standardized small form factor 6Gbps SATA SSD.
Due to physical limitations, the largest mSATA SSDs on the market today are still 240/256GB as there’s only room for 4 NAND packages (8 x 8GB die per package). The transition to 128Gbit NAND die will double this to 480/512GB so I’d expect that limit to be broken in the next quarter or two.
Although there are capacity limitations, there are no real performance limitations to delivering an mSATA SSD. As we found in our review of Micron’s mSATA C400, you can deliver the same performance as a 2.5” SSD in the mSATA form factor. It’s a pretty amazing thing to think about. You get more performance out of a tiny mSATA SSD than out of a stack of 10K RPM hard drives.

Intel has been dabbling in the mSATA space for a while now. Until Monday the fastest mSATA SSD Intel made was based on Intel’s first controller technology, but earlier this week that all changed with the announcement of the Intel SSD 525.
Like the 520, 330 and 335, Intel’s SSD 525 uses SandForce’s SF-2281 controller (the same silicon revision as the 520/330/335). Unlike those drives, the 525 is the first and only Intel built SandForce drive to ship in an mSATA form factor.
Why does Intel continue to use a third party SATA controller in many of its flagship drives? Although I once believed this was an issue with Intel having issues on the design front, I now believe that a big part of it has to do with the Intel SSD group being more resource constrained than other groups within the company.

If you’re running a group inside Intel that doesn’t happen to make high-margin CPUs, you’re far more limited than you’d think in terms of what you’re able to do. One example being that you can’t just go and design whatever custom silicon you want for your SSDs. New designs require additional resources to create and tons of validation to bring to market. As a result, Intel continues to service the client market using third party controllers that are cheaper to license and integrate than Intel’s only internal 6Gbps SATA controller (the large, power hungry but still awesome beast behind Intel’s DC S3700).
Like the 520/330/335 that came before it, Intel’s SSD 525 uses a custom SandForce firmware that’s only available on Intel SSDs. SandForce doesn’t give Intel access to its firmware source code, however any bugs and fixes found as a result of Intel’s own validation are incorporated into the Intel firmware. Intel retains some period of exclusivity on the features included in its custom SandForce firmware.
Intel’s firmware is based on an older version of the SandForce SF-2281 firmware, which makes sense given how long the first Intel SSD 520 spent in development and validation before its release. The 525 in particular uses a far newer firmware than any of the other Intel SF-2281 SSDs. Intel’s firmware naming system has never made a whole lot of sense, at least on the SandForce drives, but the 525’s shipping firmware revision is LLKi compared to 335t on the 335, 300i on the 330 and 400i on the 520.
Intel wasn’t too specific about what changes were made to the 525 other than to say that there are a ton of improvements that impact power, system compatibility and stability. The 525 will also throttle performance in the event that it's in a severely thermally limited environment. There’s no word on what, if or when any of these updates will make their way to the 330, 335 and 520. Intel's spec sheets list no performance difference between the 525 and 520, although Intel does boast lower idle power consumption compared to the 520.
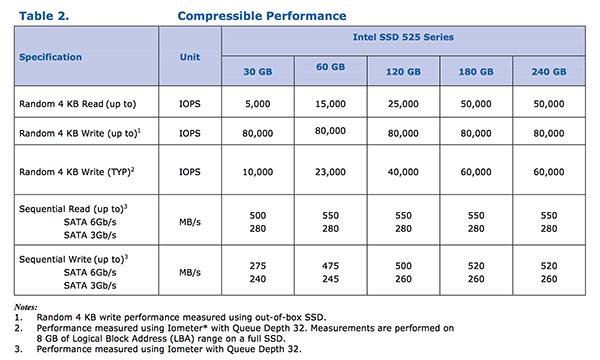
Intel sent us nearly every member of the 525 family, which spans capacities from 30GB all the way up to 240GB. I had to board a plane for the RIM BlackBerry 10 announcement after getting the 525s in for testing so I was only able to put the 240GB through its paces. You can expect to see performance and power results from the rest of the drives over the next few days. Suggested pricing can be found in the table below:
| Intel SSD 525 Launch Pricing | ||||||||
| Capacity | 30GB | 60GB | 90GB | 120GB | 180GB | 240GB | ||
| RCP/MSRP | $54 | $104 | $129 | $149 | $214 | $279 | ||
The 525's MSRPs aren't exactly aggressive, but street prices tend to be more competitive than these figures so we'll have to wait and see just how competitive the 525 is once it's available in volume. Keep in mind that although the 120GB and 180GB 525s are shipping to etailers today, volume production of the rest of the lineup won't come until later this quarter. The 525 comes with a 5-year warranty.
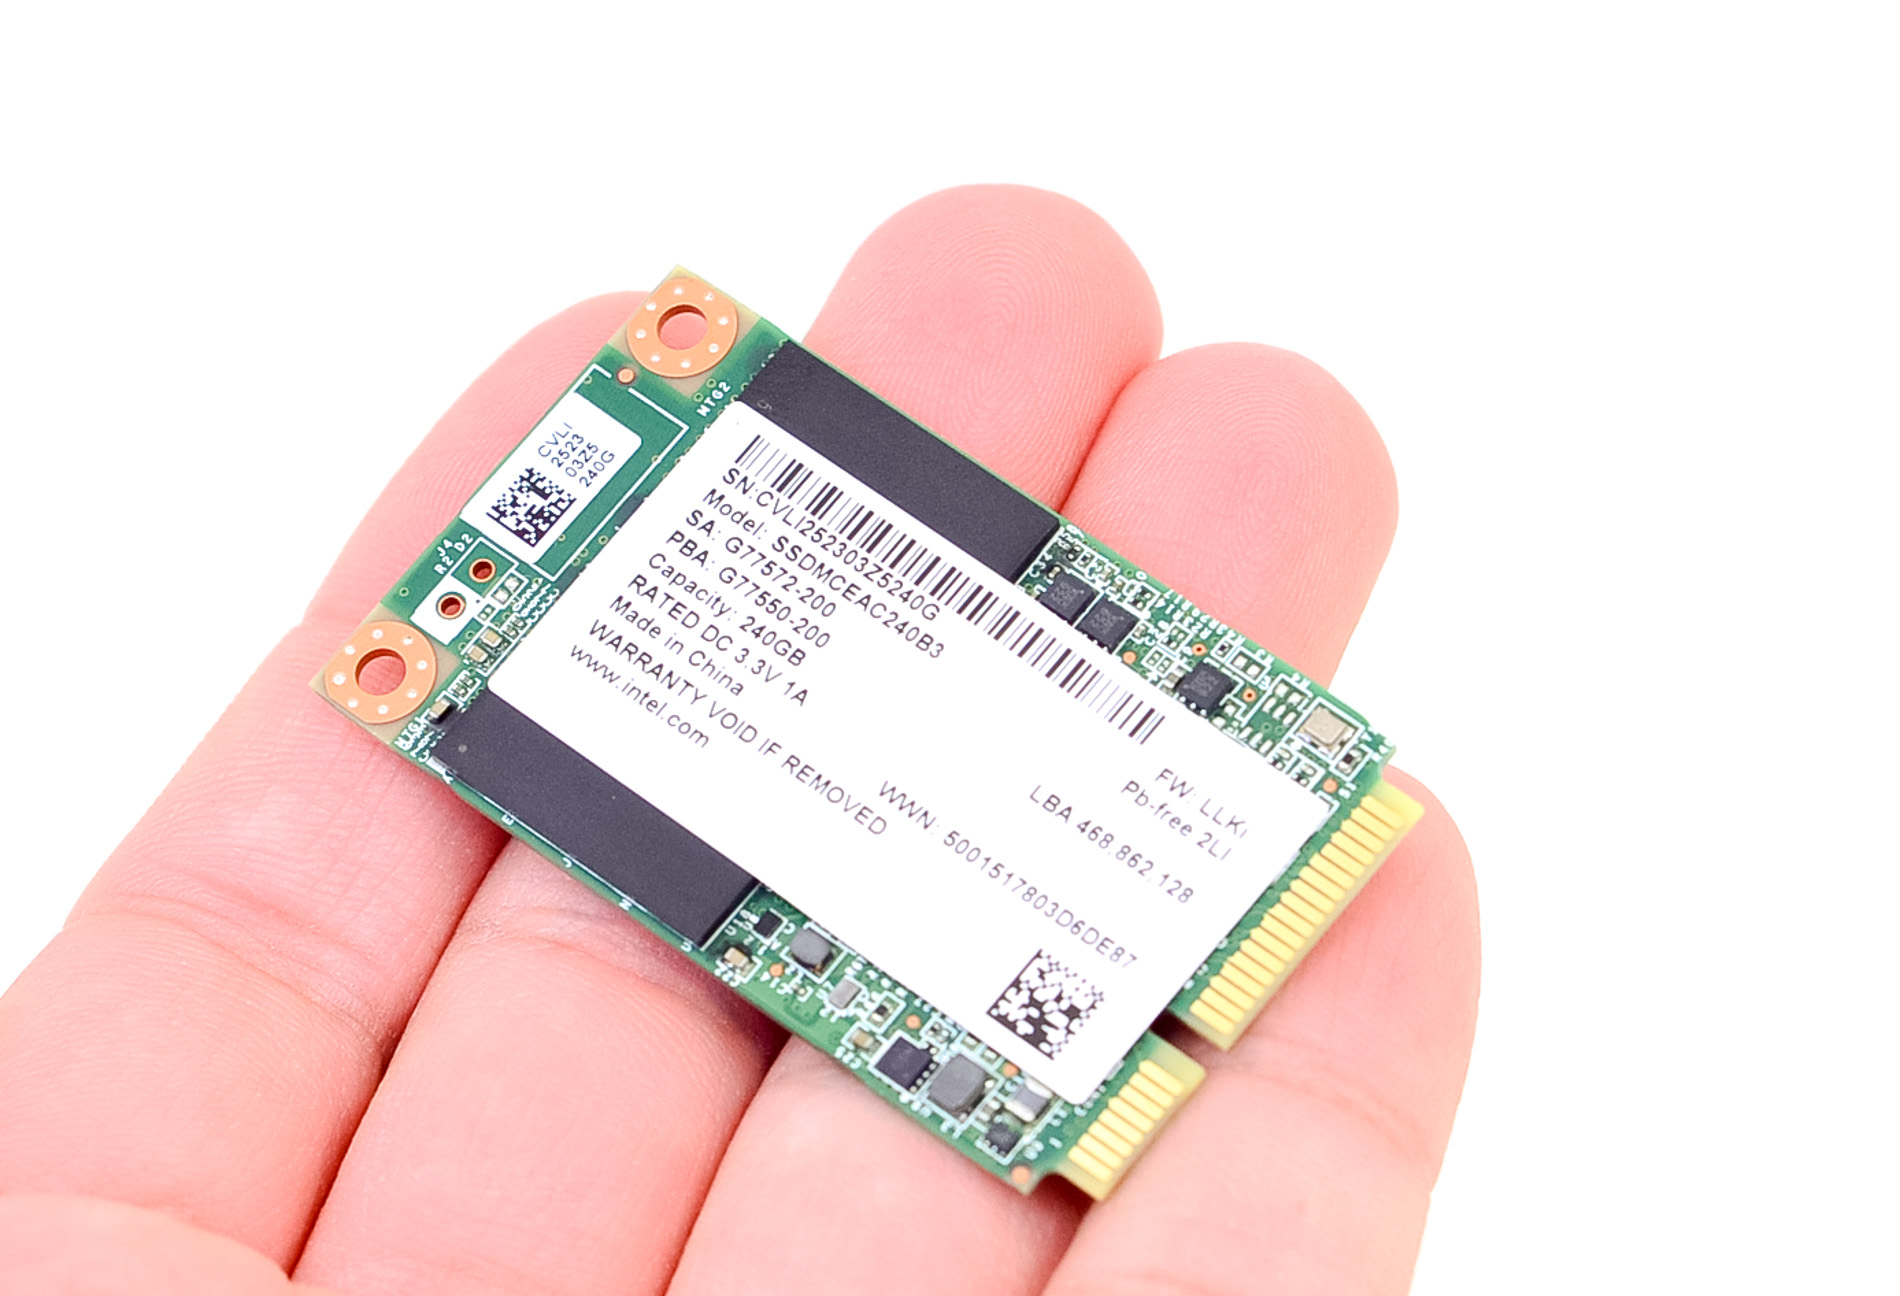
There’s not a whole lot of room on a standard mSATA SSD (51mm x 30mm), which is part of why the new M.2 spec includes options for multiple card lengths to accommodate larger capacity drives. Despite the limited dimensions, Intel and other manufacturers are generally able to fit four NAND packages plus a controller onto the card. This is one situation where the SandForce controller not having an external DRAM is very helpful as you can easily fit the large controller with two NAND packages on one side of the PCB, with the remaining two packages occupying the back side.
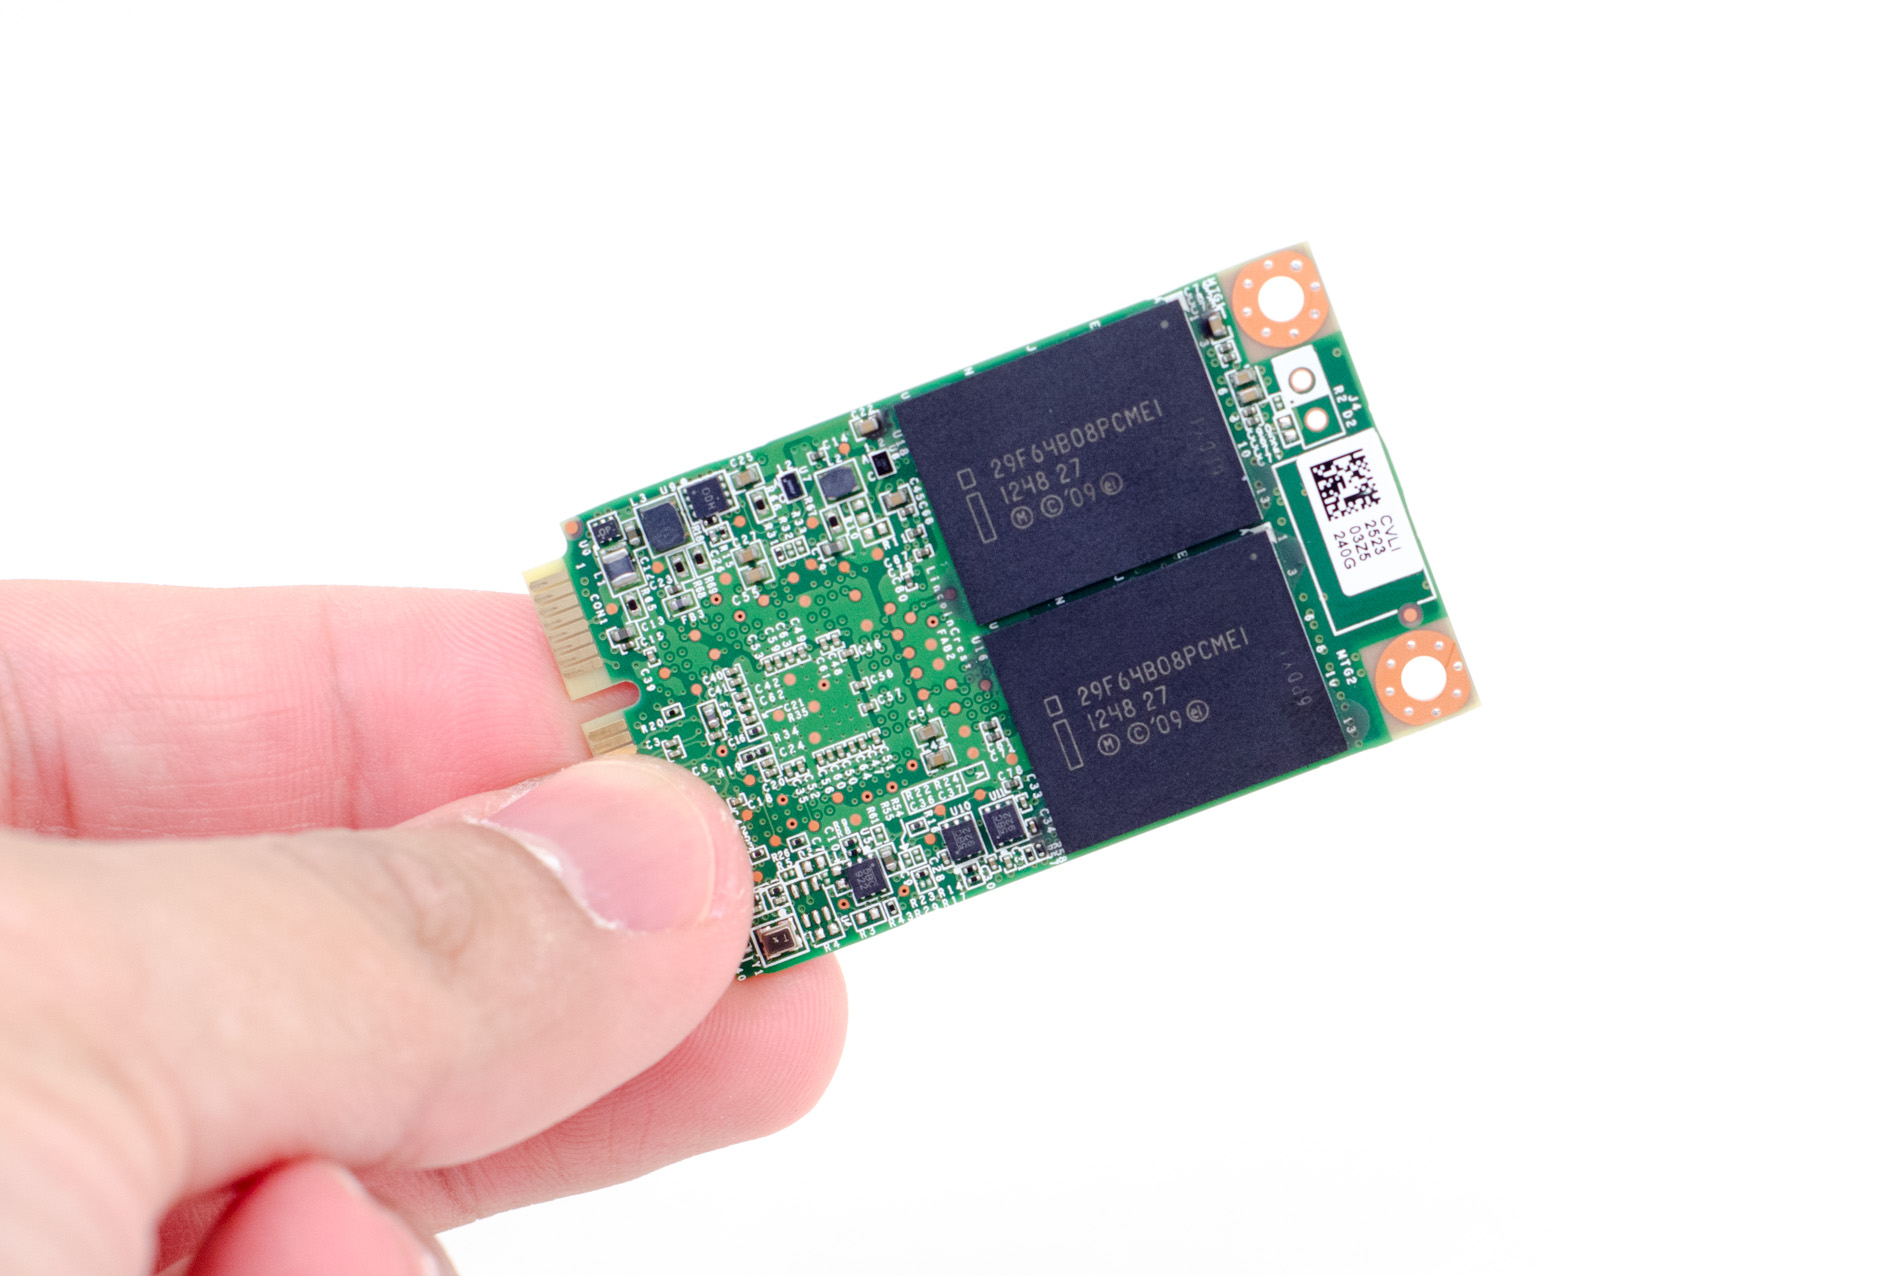
As Kristian pointed out in his review of the 335, you can tell what process node the NAND is built on by looking at the second to last character in Intel’s part numbers. Intel’s 20nm NAND is denoted by the letter F while 25nm parts are labeled E. Looking at the NAND on the 240GB 525 we see an E, which confirms that this drive uses 25nm Intel NAND.
There’s no real downside to not moving to 20nm at this point, although it is a bit unusual for Intel to introduce a drive based on 25nm NAND after it has already started the transition to 20nm. I suspect Intel is still trying to balance volumes and pricing at this point as it transitions between the two nodes.
As we get into performance analysis I wouldn’t expect too much of a difference between the mSATA Intel SSD 525 and the standard 2.5” SATA 520. Any differences that do exist will likely be due to the newer firmware on the 525 and whatever power optimizations might be in place on the physically smaller drive.
Random Read/Write Speed
The four corners of SSD performance are as follows: random read, random write, sequential read and sequential write speed. Random accesses are generally small in size, while sequential accesses tend to be larger and thus we have the four Iometer tests we use in all of our reviews.
Our first test writes 4KB in a completely random pattern over an 8GB space of the drive to simulate the sort of random access that you'd see on an OS drive (even this is more stressful than a normal desktop user would see). I perform three concurrent IOs and run the test for 3 minutes. The results reported are in average MB/s over the entire time. We use both standard pseudo randomly generated data for each write as well as fully random data to show you both the maximum and minimum performance offered by SandForce based drives in these tests. The average performance of SF drives will likely be somewhere in between the two values for each drive you see in the graphs. For an understanding of why this matters, read our original SandForce article.
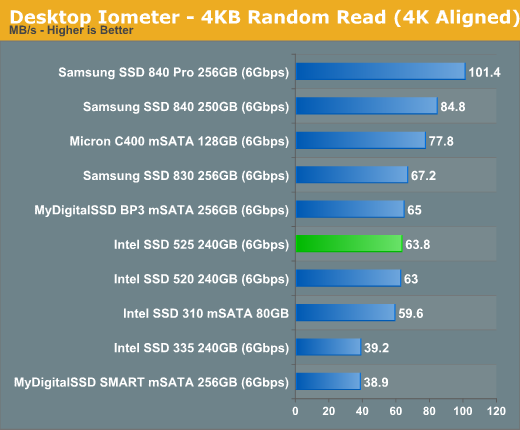
Random read performance is basically identical to the 520, and middle of the pack compared to other SSDs here. If we limit the comparison to just mSATA drives, only Micron's C400 does a better job.
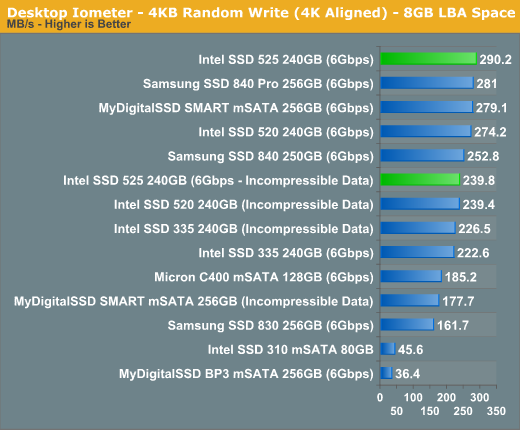
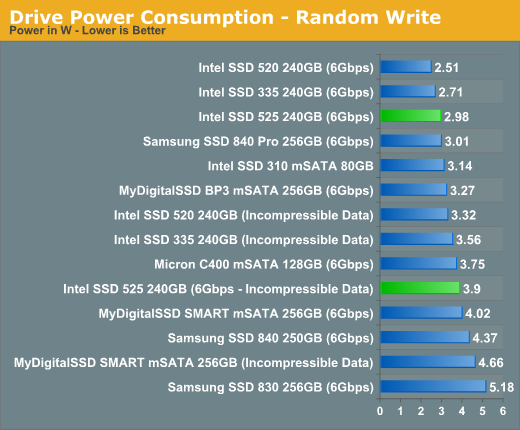
Random write performance with data that's easily compressed is a clear win for the 525. It's clear the Intel has done some work under the hood as the 525 even outpaces the 520 here. Even when faced with incompressible data, the 525 does quite well (although its advantage over the 520 disappears).
Many of you have asked for random write performance at higher queue depths. What I have below is our 4KB random write test performed at a queue depth of 32 instead of 3. While the vast majority of desktop usage models experience queue depths of 0 - 5, higher depths are possible in heavy I/O (and multi-user) workloads:
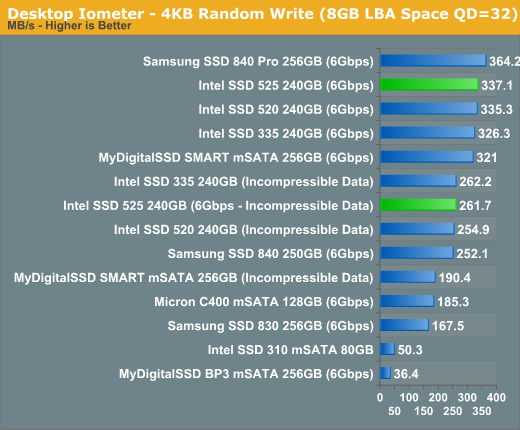
SandForce drives do a good job scaling with queue depth and we see the 525 behave as expectedly here. Both it and the 520 converge to the same performance levels.
Sequential Read/Write Speed
To measure sequential performance I ran a 1 minute long 128KB sequential test over the entire span of the drive at a queue depth of 1. The results reported are in average MB/s over the entire test length.
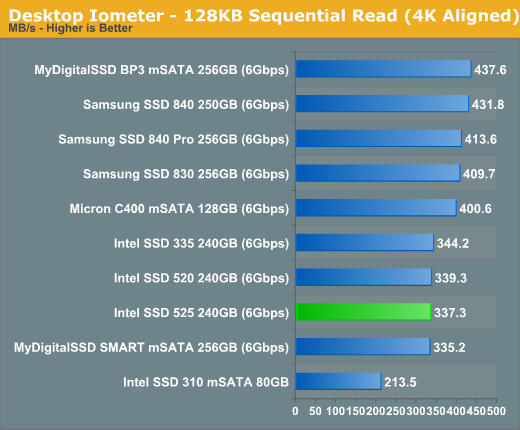
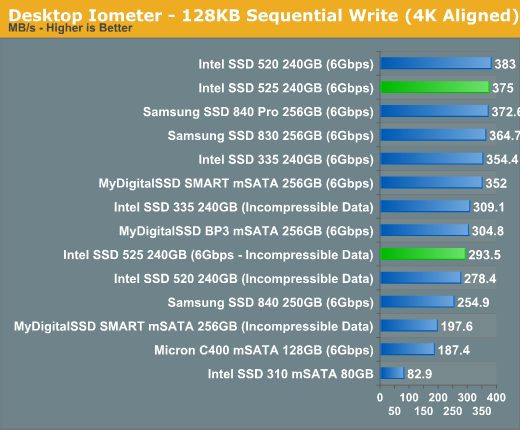
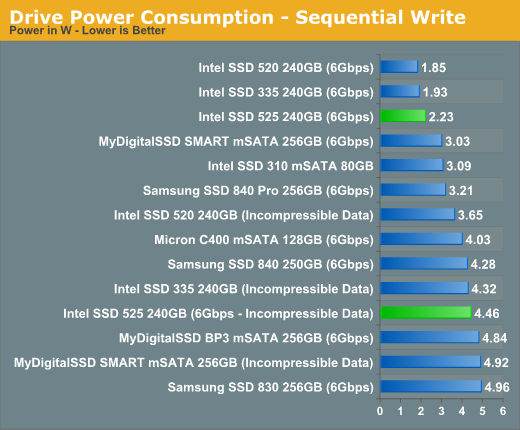
Sequential performance is once again near identical to the 520, with the 520 pulling ahead in sequential writes.
AS-SSD Incompressible Sequential Performance
The AS-SSD sequential benchmark uses incompressible data for all of its transfers. The result is a pretty big reduction in sequential write speed on SandForce based controllers.
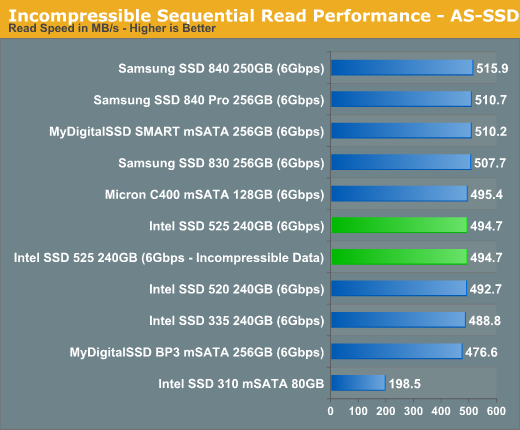
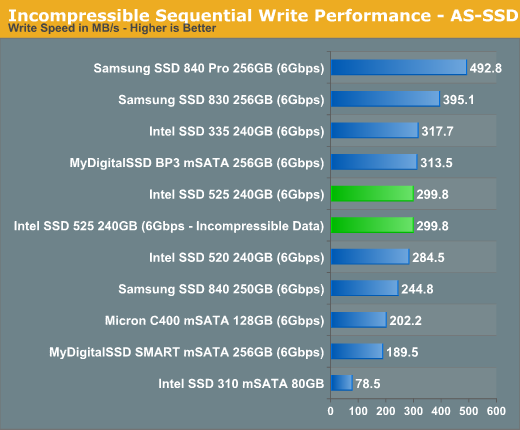
Incompressible performance is very similar to the 520, although once again the 525 does pull ahead slightly.
Performance vs. Transfer Size
ATTO does a good job of showing us how sequential performance varies with transfer size. Most controllers optimize for commonly seen transfer sizes and neglect the rest. The optimization around 4KB, 8KB and 128KB transfers makes sense given that's what most workloads are bound by, but it's always important to understand how a drive performs across the entire gamut.
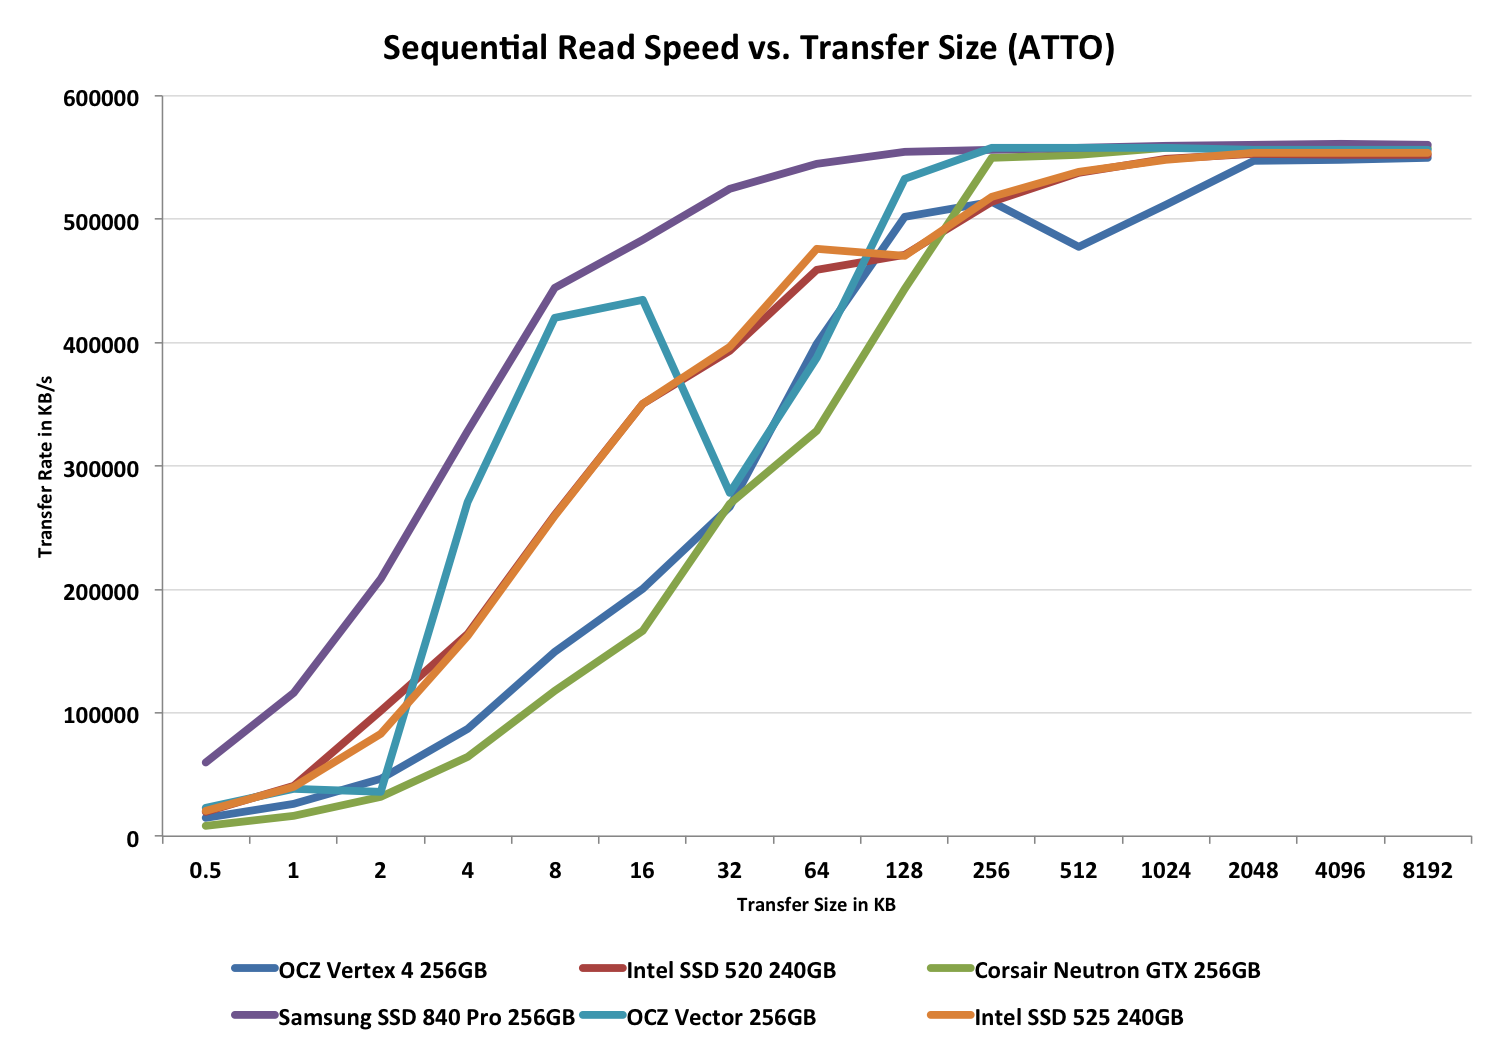
The 525's sequential read curve is almost identical to that of the 520. Whatever firmware improvements exist in the 525, they don't seem to obviously impact low queue depth sequential read performance over the 520.
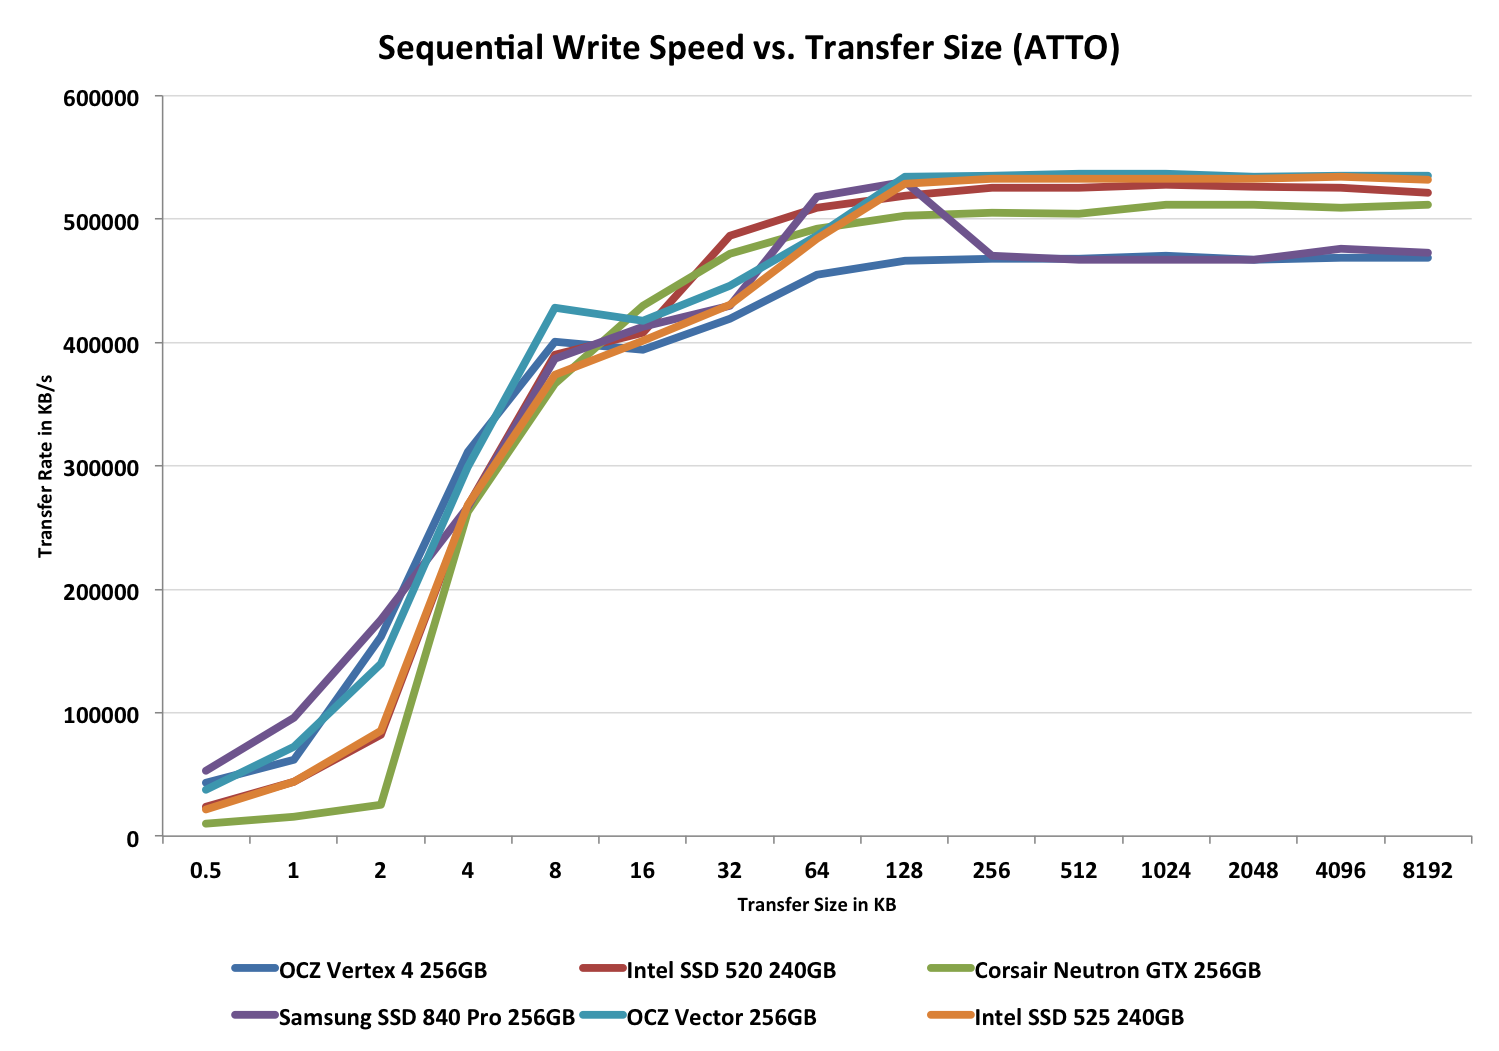
Sequential write performance is a similar story, although the 520 does have a bit of an advantage in 32KB sequential transfers. Overall the 525 and 520 look indistinguishable however.
Performance Consistency
In our Intel SSD DC S3700 review I introduced a new method of characterizing performance: looking at the latency of individual operations over time. The S3700 promised a level of performance consistency that was unmatched in the industry, and as a result needed some additional testing to show that. The reason we don't have consistent IO latency with SSDs is because inevitably all controllers have to do some amount of defragmentation or garbage collection in order to continue operating at high speeds. When and how an SSD decides to run its defrag and cleanup routines directly impacts the user experience. Frequent (borderline aggressive) cleanup generally results in more stable performance, while delaying that can result in higher peak performance at the expense of much lower worst case performance. The graphs below tell us a lot about the architecture of these SSDs and how they handle internal defragmentation.
To generate the data below I took a freshly secure erased SSD and filled it with sequential data. This ensures that all user accessible LBAs have data associated with them. Next I kicked off a 4KB random write workload across all LBAs at a queue depth of 32 using incompressible data. I ran the test for just over half an hour, no where near what we run our steady state tests for but enough to give me a good look at drive behavior once all spare area filled up.
I recorded instantaneous IOPS every second for the duration of the test. I then plotted IOPS vs. time and generated the scatter plots below. Each set of graphs features the same scale. The first two sets use a log scale for easy comparison, while the last set of graphs uses a linear scale that tops out at 40K IOPS for better visualization of differences between drives.
The high level testing methodology remains unchanged from our S3700 review. Unlike in previous reviews however, I did vary the percentage of the drive that I filled/tested depending on the amount of spare area I was trying to simulate. The buttons are labeled with the advertised user capacity had the SSD vendor decided to use that specific amount of spare area. If you want to replicate this on your own all you need to do is create a partition smaller than the total capacity of the drive and leave the remaining space unused to simulate a larger amount of spare area. The partitioning step isn't absolutely necessary in every case but it's an easy way to make sure you never exceed your allocated spare area. It's a good idea to do this from the start (e.g. secure erase, partition, then install Windows), but if you are working backwards you can always create the spare area partition, format it to TRIM it, then delete the partition. Finally, this method of creating spare area works on the drives I've tested here but not all controllers may behave the same way.
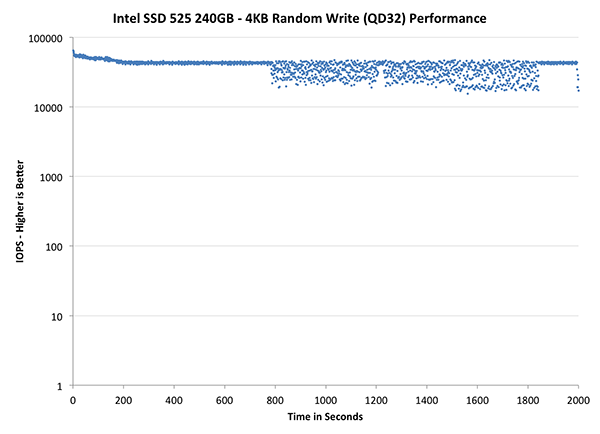
The first set of graphs shows the performance data over the entire 2000 second test period. In these charts you'll notice an early period of very high performance followed by a sharp dropoff. What you're seeing in that case is the drive alllocating new blocks from its spare area, then eventually using up all free blocks and having to perform a read-modify-write for all subsequent writes (write amplification goes up, performance goes down).
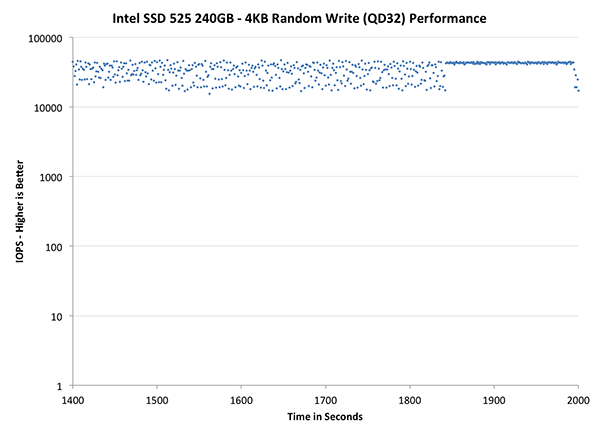
The second set of graphs zooms in to the beginning of steady state operation for the drive (t=1400s). The third set also looks at the beginning of steady state operation but on a linear performance scale. Click the buttons below each graph to switch source data.
| Impact of Spare Area | ||||||||
| Intel SSD DC S3700 200GB | Intel SSD 335 240GB | Intel SSD 525 240GB | Corsair Neutron 240GB | OCZ Vector 256GB | Samsung SSD 840 Pro 256GB | |||
| Default | ||||||||
| 25% Spare Area | - | - | - | |||||
I'm not entirely sure what's going on in this curve as normally what we see is continued dropoff after around 1800 seconds of hammering the drive. There's a chance that Intel has pushed for more IO consistency in the 525's firmware, or it's more likely that something funny happened during our testing process. I'll be repeating this test immediately after I get back from the RIM event and will update the results accordingly. What we see up to the 1800 second mark is consistent with other SandForce based SSDs. There's great IO consistency for a while but then a clear degradation if you're hitting the drive with incompressible data.
Where SandForce gets a reprieve is in the fact that the drive is almost never in this state, even if it's full. A big part of your OS and applications will always be compressible, which gives the controller more free space to work with. As a result, the IO distribution ends up looking a lot tighter than what we're showing here.
The next set of charts look at the steady state (for most drives) portion of the curve. Here we'll get some better visibility into how everyone will perform over the long run.
| Impact of Spare Area | ||||||||
| Intel SSD DC S3700 200GB | Intel SSD 335 240GB | Intel SSD 525 240GB | Corsair Neutron 240GB | OCZ Vector 256GB | Samsung SSD 840 Pro 256GB | |||
| Default | ||||||||
| 25% Spare Area | - | - | - | |||||
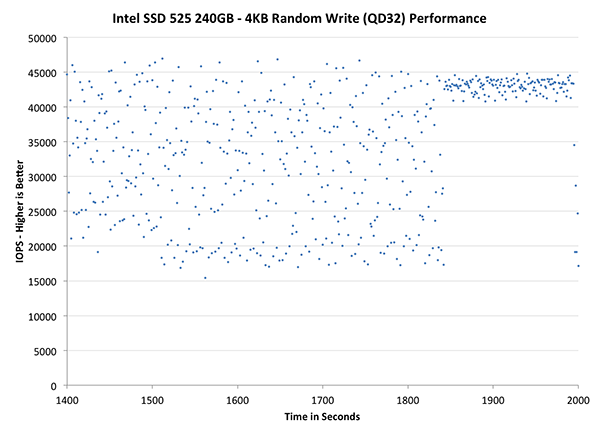
The final set of graphs abandons the log scale entirely and just looks at a linear scale that tops out at 50K IOPS. We're also only looking at steady state (or close to it) performance here:
| Impact of Spare Area | ||||||||
| Intel SSD DC S3700 200GB | Intel SSD 335 240GB | Intel SSD 525 240GB | Corsair Neutron 240GB | OCZ Vector 256GB | Samsung SSD 840 Pro 256GB | |||
| Default | ||||||||
| 25% Spare Area | - | - | - | |||||
In the truly worst case scenario, the 525 is hardly consistent although minimum performance isn't anywhere near as bad as many of the other controllers. Hang tight as I'll be updating this page with results including larger effective spare area (which will be a better approximation of real world consistency given SF's real time compression/de-dupe keeps NAND less populated by default) and some more investigation as to what's going on with IO consistency towards the end of the curve here.
AnandTech Storage Bench 2011
Two years ago we introduced our AnandTech Storage Bench, a suite of benchmarks that took traces of real OS/application usage and played them back in a repeatable manner. I assembled the traces myself out of frustration with the majority of what we have today in terms of SSD benchmarks.
Although the AnandTech Storage Bench tests did a good job of characterizing SSD performance, they weren't stressful enough. All of the tests performed less than 10GB of reads/writes and typically involved only 4GB of writes specifically. That's not even enough exceed the spare area on most SSDs. Most canned SSD benchmarks don't even come close to writing a single gigabyte of data, but that doesn't mean that simply writing 4GB is acceptable.
Originally I kept the benchmarks short enough that they wouldn't be a burden to run (~30 minutes) but long enough that they were representative of what a power user might do with their system.
Not too long ago I tweeted that I had created what I referred to as the Mother of All SSD Benchmarks (MOASB). Rather than only writing 4GB of data to the drive, this benchmark writes 106.32GB. It's the load you'd put on a drive after nearly two weeks of constant usage. And it takes a *long* time to run.
1) The MOASB, officially called AnandTech Storage Bench 2011 - Heavy Workload, mainly focuses on the times when your I/O activity is the highest. There is a lot of downloading and application installing that happens during the course of this test. My thinking was that it's during application installs, file copies, downloading and multitasking with all of this that you can really notice performance differences between drives.
2) I tried to cover as many bases as possible with the software I incorporated into this test. There's a lot of photo editing in Photoshop, HTML editing in Dreamweaver, web browsing, game playing/level loading (Starcraft II & WoW are both a part of the test) as well as general use stuff (application installing, virus scanning). I included a large amount of email downloading, document creation and editing as well. To top it all off I even use Visual Studio 2008 to build Chromium during the test.
The test has 2,168,893 read operations and 1,783,447 write operations. The IO breakdown is as follows:
| AnandTech Storage Bench 2011 - Heavy Workload IO Breakdown | ||||
| IO Size | % of Total | |||
| 4KB | 28% | |||
| 16KB | 10% | |||
| 32KB | 10% | |||
| 64KB | 4% | |||
Only 42% of all operations are sequential, the rest range from pseudo to fully random (with most falling in the pseudo-random category). Average queue depth is 4.625 IOs, with 59% of operations taking place in an IO queue of 1.
Many of you have asked for a better way to really characterize performance. Simply looking at IOPS doesn't really say much. As a result I'm going to be presenting Storage Bench 2011 data in a slightly different way. We'll have performance represented as Average MB/s, with higher numbers being better. At the same time I'll be reporting how long the SSD was busy while running this test. These disk busy graphs will show you exactly how much time was shaved off by using a faster drive vs. a slower one during the course of this test. Finally, I will also break out performance into reads, writes and combined. The reason I do this is to help balance out the fact that this test is unusually write intensive, which can often hide the benefits of a drive with good read performance.
There's also a new light workload for 2011. This is a far more reasonable, typical every day use case benchmark. Lots of web browsing, photo editing (but with a greater focus on photo consumption), video playback as well as some application installs and gaming. This test isn't nearly as write intensive as the MOASB but it's still multiple times more write intensive than what we were running in 2010.
As always I don't believe that these two benchmarks alone are enough to characterize the performance of a drive, but hopefully along with the rest of our tests they will help provide a better idea.
The testbed for Storage Bench 2011 has changed as well. We're now using a Sandy Bridge platform with full 6Gbps support for these tests.
AnandTech Storage Bench 2011 - Heavy Workload
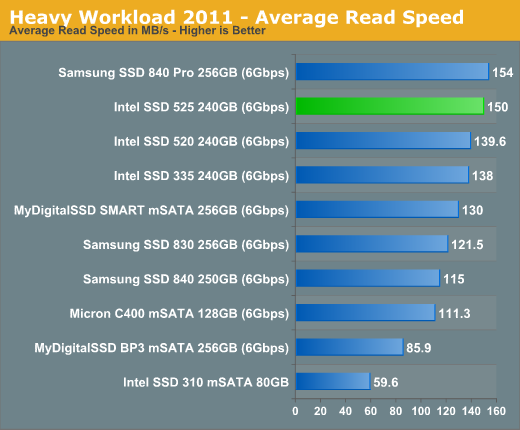
We'll start out by looking at average data rate throughout our new heavy workload test:
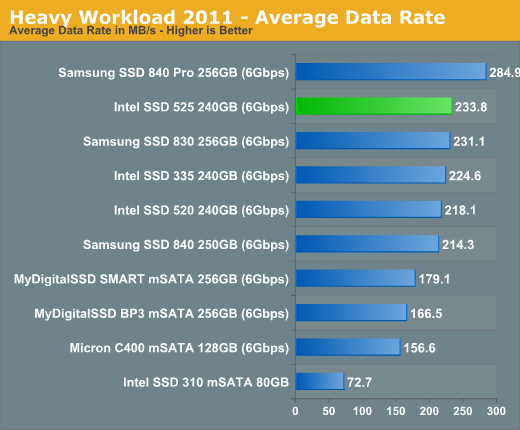
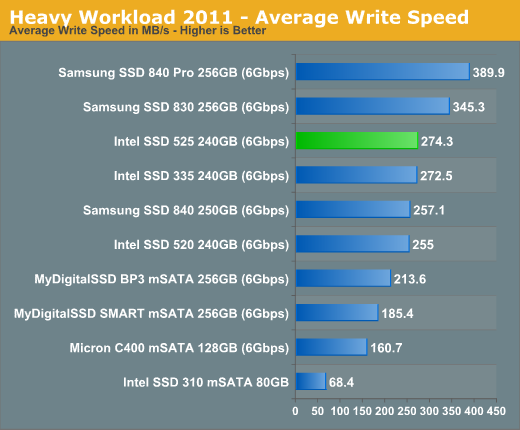
The 525 does manage to pull a small but tangible advantage over the 520 in our heavy workload test. The performance advantage seems to be largely due to improvement in write speed if we look at the breakdown:
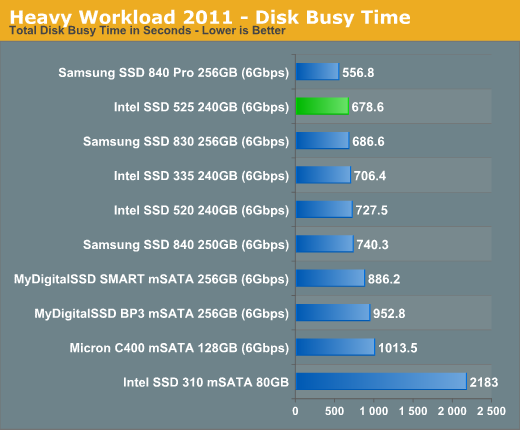
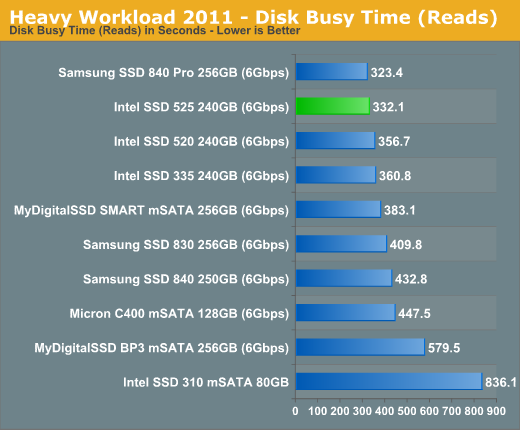
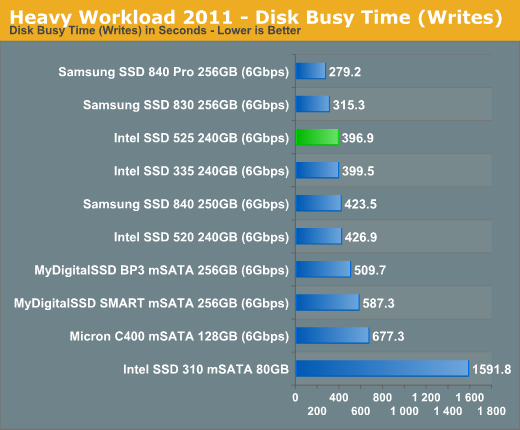
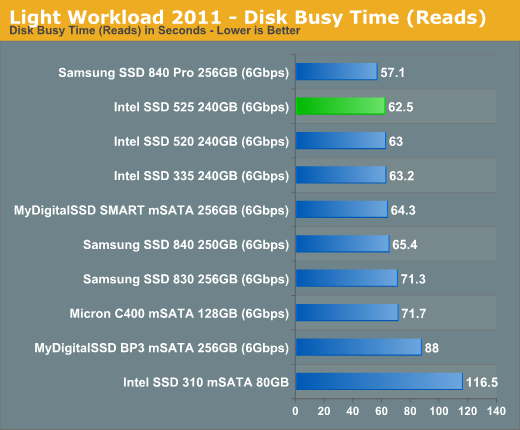
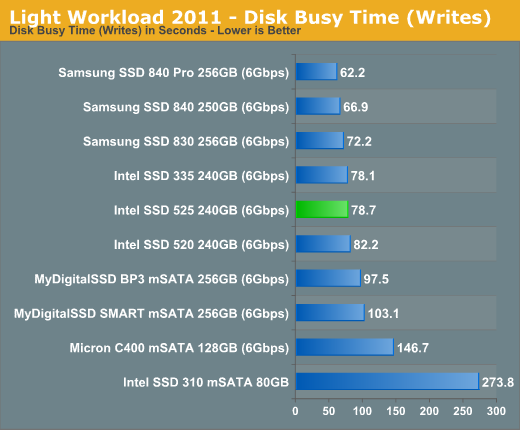
The next three charts just represent the same data, but in a different manner. Instead of looking at average data rate, we're looking at how long the disk was busy for during this entire test. Note that disk busy time excludes any and all idles, this is just how long the SSD was busy doing something:
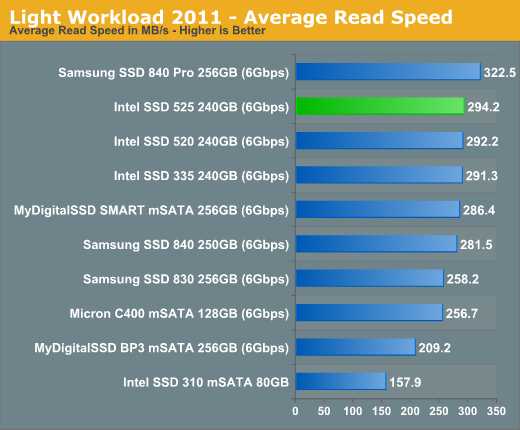
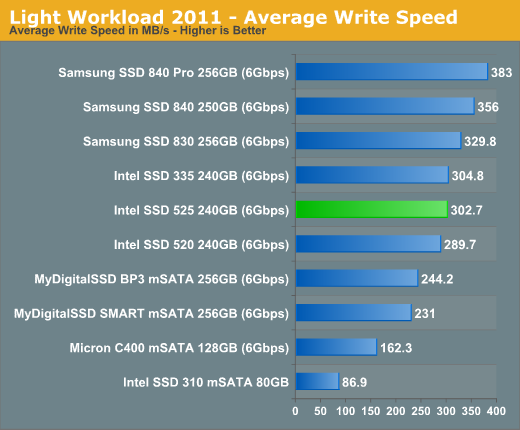
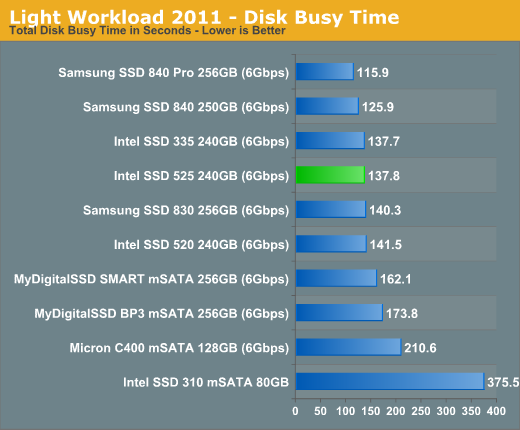
AnandTech Storage Bench 2011 - Light Workload
Our new light workload actually has more write operations than read operations. The split is as follows: 372,630 reads and 459,709 writes. The relatively close read/write ratio does better mimic a typical light workload (although even lighter workloads would be far more read centric).
The I/O breakdown is similar to the heavy workload at small IOs, however you'll notice that there are far fewer large IO transfers:
| AnandTech Storage Bench 2011 - Light Workload IO Breakdown | ||||
| IO Size | % of Total | |||
| 4KB | 27% | |||
| 16KB | 8% | |||
| 32KB | 6% | |||
| 64KB | 5% | |||
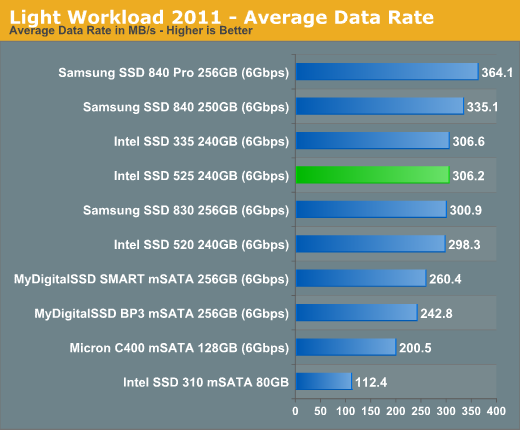
There's a smaller improvement over the 520 in our light workload. The 525 isn't really supposed to be faster than the 520, just available in a smaller form factor - any performance advantage is simply icing on the cake.
TRIM Functionality
SandForce has always exhibited strange behavior when it came to TRIM. Even Intel's custom firmware in the SSD 520 wasn't able to fix SandForce's TRIM problem. The issue happens when the SSD is completely filled with incompressible data (both user LBAs and spare area). Any performance degradation after that point won't be restored with a TRIM pass and instead will require a secure erase to return to new. None of the Intel SF SSDs have been able to fix this issue and the 525 is no exception. I ran a slightly modified version of our usual test here. I filled the drive with incompressible data, ran our consistency workload (also with incompressible data) then measured performance using a 128KB (incompressible) pass in IOmeter. I then TRIMed the entire drive and re-ran the IOmeter test.
| Intel SSD 525 Resiliency - IOMeter 128KB Incompressible Sequential Write | |||||
| Clean | After Torture (30 mins) | After TRIM | |||
| Intel SSD 525 240GB | 293.5 MB/s | 59.8 MB/s | 153.3 MB/s | ||
And the issues persists. This is really a big problem with SandForce drives if you're going to store lots of incompressible data (such as MP3s, H.264 videos and other highly compressed formats) because sequential speeds may suffer even more in the long run. As an OS drive the SSD 335 will do just fine since it won't be full of incompressible data, but I would recommend buying something non-SandForce if the main use will be storage of incompressible data.
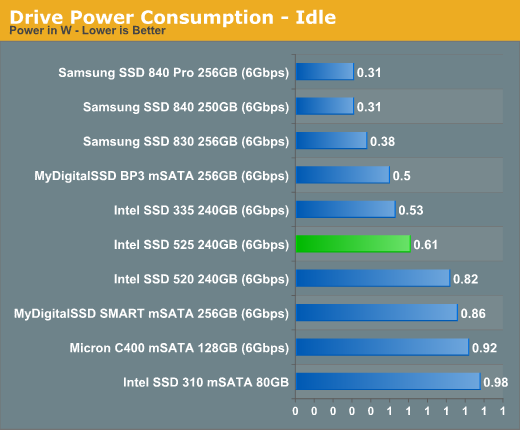
Power Consumption
Idle power consumption is appreciably lower on the 525 than on the 520, however it's still not as low as the latest from Samsung. According to SandForce, a newer silicon spin of the SF-2281 controller exists that drives idle power consumption down even lower however most drive makers haven't chosen to implement it. Intel confirmed that it's still using the same silicon as the 525, so all improvements here are purely due to firmware.
Despite the gains in idle power consumption, I did measure consistently higher power consumption under active workloads. The gains at idle are more important to improving battery life, although I would liked to have seen reductions across the board. Even more, if SandForce has newer, lower power silicon available I'd like to see that used as well. SandForce tells me that its new low power SF-2281 revision is mostly used by OEMs at this point, not channel drive vendors.
Update: We've measured 525 power consumption using the 3.3V rail supplied directly to the drive.
Final Words
Intel's SSD 525, at least in the 240GB form we reviewed today, is largely an updated, smaller form factor version of the 520 we met last year. The firmware updates Intel put in place on the 525 seem to improve performance over the 520, and the drive does boast lower idle power consumption although higher active power usage compared to its older, larger brother.
Intel did focus on improving system stability and compatibility with the 525's firmware, which could make it a better solution than competing mSATA SandForce drives, especially for those users who have been burned by SandForce before. With SandForce's 3rd generation controller due out in the second half of the year and M.2 drives due out in a similar timeframe, the 525's honeymoon period really is now. Luckily for Intel, there's a large (and growing) population of mSATA enabled systems on the market today looking for a good SSD to power them. If you're ok with the tradeoffs that come with a SandForce drive, the 525 is probably one of the best mSATA options on the market today.
Unlike in the 2.5" SATA space where there are many controller/firmware combinations to choose from, it's tough finding really good mSATA drives in the etail channel. I'm glad to see Intel aggressively pursuing this market with the 525. I hope we'll see the same attention paid to M.2 when it begins to gain popularity.
I would still like to see Intel use more of its home grown controller technology in drives rather than relying on 3rd party controller vendors. Here's hoping that the technology used in the S3700 will eventually waterfall down to Intel's other products.


