Original Link: https://www.anandtech.com/show/7032/amds-richland-vs-intels-haswell-gpu-on-the-desktop-radeon-hd-8670d-hd-4600
AMD's Richland vs. Intel's Haswell GPU on the Desktop: Radeon HD 8670D vs. Intel HD 4600
by Anand Lal Shimpi on June 6, 2013 12:00 PM ESTThe run up to Computex has been insane. Kabini, Haswell and Iris hit us back to back to back, not to mention all of the travel before receiving those products to get briefed on everything. Needless to say, we're in major catchup mode. There's a lot more that I wanted to do with Haswell desktop that got cut out due to Iris, and much more I wanted to do with Iris that I had to scrap in order to fly out to Computex. I will be picking up where I left off later this month, but with WWDC, Samsung and a couple of NDA'd events later this month, it's not going to be as quick as I'd like.
One part that arrived while I was in the middle of launch central was AMD's Richland for desktop. Effectively a refresh of Trinity with slightly higher clocks, a software bundle and more sophisticated/aggressive turbo. Richland maintains socket compatibility with Trinity (FM2), so all you should need is a BIOS update to enable support for the chip. AMD sent over two Richland parts just before I left for Computex: the 100W flagship A10-6800K and the 65W A10-6700. I didn't have time to do Richland justice before I left, however I did make sure to test the 6800K in tandem with Haswell's GPU just so I had an idea of how things would stack up going forward as I was writing my Iris Pro conclusion.
For all intents and purposes, Iris Pro doesn't exist in the desktop space, making Haswell GT2 (HD 4600) the fastest socketed part with discrete graphics that Intel ships today. In our Haswell desktop review I didn't get a chance to really analyze HD 4600 performance, so I thought I'd take this opportunity to refresh the current state of desktop integrated processor graphics. Unlike the staggered CPU/GPU launch of Trinity on the desktop, the situation with Richland is purely a time limitation on my end. This was all I could put together before I left for Computex.
Although Richland comes with a generational increase in model numbers, the underlying architecture is the same as Trinity. We're still talking about Piledriver modules and a Cayman derived GPU. It won't be until Kaveri that we see GCN based processor graphics from AMD at this price segment (Kabini is already there).
As Jarred outlined in his launch post on Richland, the 6800K features 4 - 8% higher CPU clocks and a 5% increase in GPU clocks compared to its predecessor. With improved Turbo Core management, AMD expects longer residency at max turbo frequencies but you shouldn't expect substantial differences in performance on the GPU side. The A10-6800K also includes official support for DDR3-2133. AMD is proud of its valiation on the A10-6800K, any parts that won't pass at DDR3-2133 are demoted to lower end SKUs. I never spent a ton of time testing memory overclocking with Trinity, but my A10-5800K sample had no issues running at DDR3-2133 either. I couldn't get DDR3-2400 working reliably however.
| AMD Elite A-Series Desktop APUs, aka Richland | ||||||
| Model | A10-6800K | A10-6700 | A8-6600K | A8-6500 | A6-6400K | A4-4000 |
| Modules/Cores | 2/4 | 2/4 | 2/4 | 2/4 | 1/2 | 1/2 |
| CPU Base Freq | 4.1 | 3.7 | 3.9 | 3.5 | 3.9 | 3.0 |
| Max Turbo | 4.4 | 4.3 | 4.2 | 4.1 | 4.1 | 3.2 |
| TDP | 100W | 65W | 100W | 65W | 65W | 65W |
| Graphics | HD 8670D | HD 8670D | HD 8570D | HD 8570D | HD 8470D | ? |
| GPU Cores | 384 | 384 | 256 | 256 | 192 | 128 |
| GPU Clock | 844 | 844 | 844 | 800 | 800 | 724 |
| L2 Cache | 2x2MB | 2x2MB | 2x2MB | 2x2MB | 1MB | 1MB |
| Max DDR3 | 2133 | 1866 | 1866 | 1866 | ||
| Price (MSRP) | $150 ($142) | $149 ($142) | $120 ($112) | $119 ($112) | $80 | $46 |
Just to put things in perspective, here are the previous generation Trinity desktop APUs:
| AMD Trinity Desktop APUs | ||||||
| Model | A10-5800K | A10-5700 | A8-5600K | A8-5500 | A6-5400K | A4-5300 |
| Modules/Cores | 2/4 | 2/4 | 2/4 | 2/4 | 1/2 | 1/2 |
| CPU Base Freq | 3.8 | 3.4 | 3.6 | 3.2 | 3.6 | 3.4 |
| Max Turbo | 4.2 | 4.0 | 3.9 | 3.7 | 3.8 | 3.6 |
| TDP | 100W | 65W | 100W | 65W | 65W | 65W |
| Graphics | HD 7660D | HD 7660D | HD 7560D | HD 7560D | HD 7540D | HD 7480D |
| GPU Cores | 384 | 384 | 256 | 256 | 192 | 128 |
| GPU Clock | 800 | 760 | 760 | 760 | 760 | 723 |
| L2 Cache | 2x2MB | 2x2MB | 2x2MB | 2x2MB | 1MB | 1MB |
| Max DDR3 | 2133 | 1866 | 1866 | 1866 | ||
| Current Price | $130 | $129 | $110 | $105 | $70 | $55 |
For my Richland test platform I used the same Gigabyte UD4 Socket-FM2 motherboard I used for our desktop Trinity review, simply updated to the latest firmware release. I ran both AMD platforms using the same Catalyst 13.6 driver with the same DDR3-2133 memory frequency. AMD was quick to point out that only the A10-6800K ships with official DDR3-2133 support, so the gap in performance between it and Trinity may be even larger if the latter tops out at DDR3-1866. The HD 4000/4600 numbers are borrowed from my Iris Pro review using DDR3-2400, however I didn't notice scaling on Haswell GT2 beyond DDR3-1866.
I'll be following up with a more thorough look at Richland once I'm back from my current bout of traveling.
Metro: Last Light
Metro: Last Light is the latest entry in the Metro series of post-apocalyptic shooters by developer 4A Games. Like its processor, Last Light is a game that sets a high bar for visual quality, and at its highest settings an equally high bar for system requirements thanks to its advanced lighting system. This doesn’t preclude it from running on iGPUs thanks to the fact that it scales down rather well, but it does mean that we have to run at fairly low resolutions to get a playable framerate.
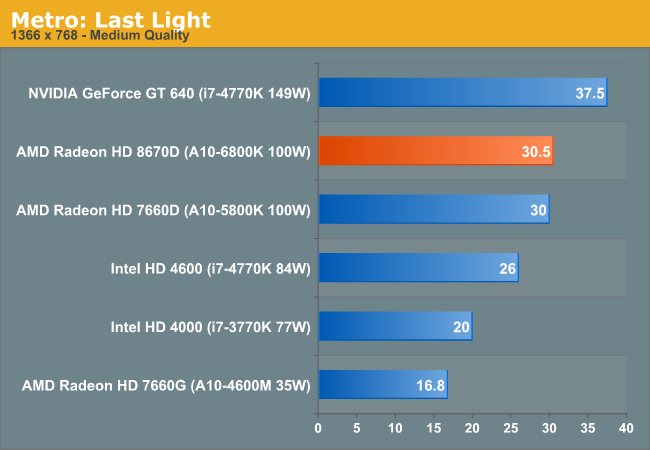
Looking at desktop parts alone, Intel really suffers from not having a socketed GT3 SKU. Although HD 4600 is appreciably faster than HD 4000 (+30%), both Trinity and Richland are around 17% faster than it. As you'll see, Metro ends up being one of the smaller gaps between the two in our suite.
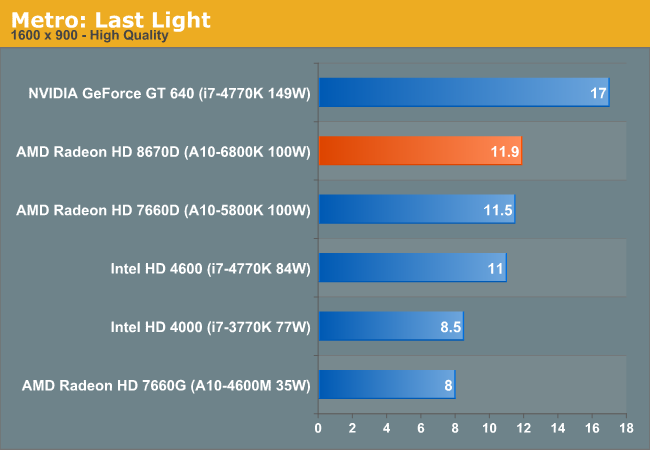
As memory bandwidth becomes the ultimate bounding condition, the gap between Richland and Haswell shrinks considerably. Note that on the HD 4600 side, the difference between DDR3-1333 and DDR3-2400 is only 10% here. Given the limited performance of the 20 EU Haswell GPU configuration, it doesn't seem like Intel is all that bandwidth limited here.
BioShock: Infinite
Bioshock Infinite is Irrational Games’ latest entry in the Bioshock franchise. Though it’s based on Unreal Engine 3 – making it our obligatory UE3 game – Irrational had added a number of effects that make the game rather GPU-intensive on its highest settings. As an added bonus it includes a built-in benchmark composed of several scenes, a rarity for UE3 engine games, so we can easily get a good representation of what Bioshock’s performance is like.

If Metro was an example of the worst case scenario for Richland, BioShock: Infinite is the best case scenario. Here the Radeon HD 8670D holds a 50% performance advantage over Intel's HD 4600 graphics.
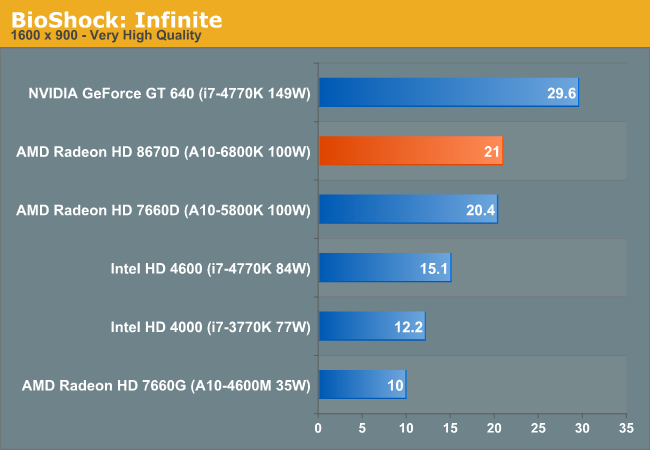
The gap narrows a bit at higher resolution/quality settings, but it's still 39%.
Sleeping Dogs
A Square Enix game, Sleeping Dogs is one of the few open world games to be released with any kind of benchmark, giving us a unique opportunity to benchmark an open world game. Like most console ports, Sleeping Dogs’ base assets are not extremely demanding, but it makes up for it with its interesting anti-aliasing implementation, a mix of FXAA and SSAA that at its highest settings does an impeccable job of removing jaggies. However by effectively rendering the game world multiple times over, it can also require a very powerful video card to drive these high AA modes.
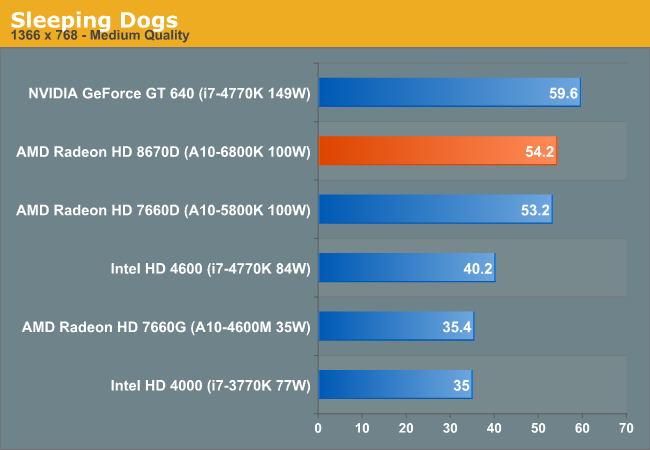
Richland is approaching 60 fps in our Sleeping Dogs benchmark at medium quality, definitely not bad at all. The advantage over Intel's HD 4600 is 34%.
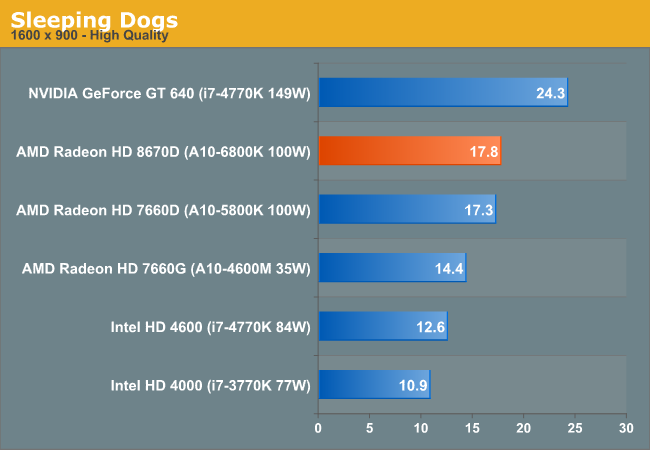
The performance advantage grows a bit at the higher quality/resolution settings, however we drop below the line of playability. With most of these games, you can trade off image quality for resolution however.
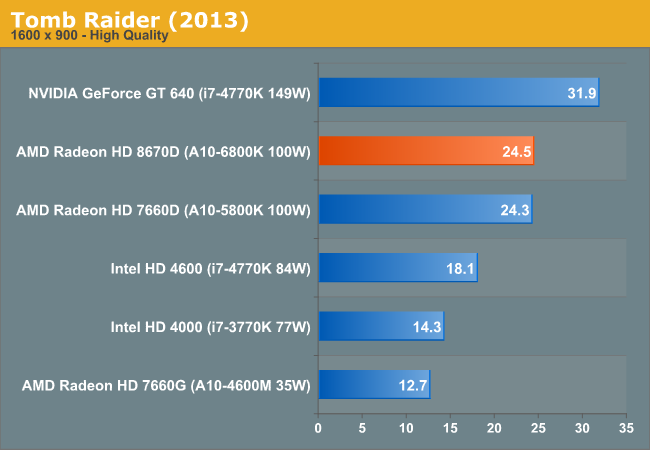
Tomb Raider (2013)
The simply titled Tomb Raider is the latest entry in the Tomb Raider franchise, making a clean break from past titles in plot, gameplay, and technology. Tomb Raider games have traditionally been technical marvels and the 2013 iteration is no different. iGPUs aren’t going to have quite enough power to use its marquee feature – DirectCompute accelerated hair physics (TressFX) – however even without it the game still looks quite good at its lower settings, while providing a challenge for our iGPUs.
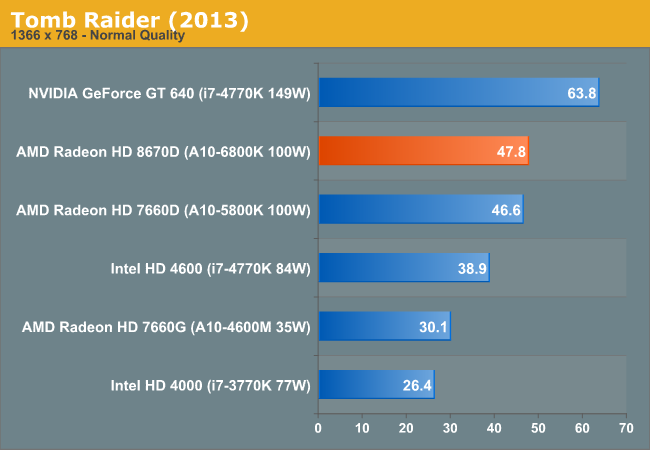
Tomb Raider is another title that doesn't put Richland in the best light, but it still ends up around 23% faster than Haswell GT2.
Battlefield 3
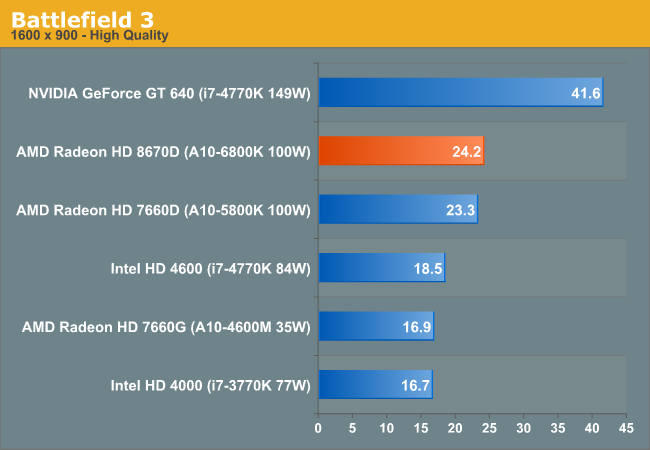
Our multiplayer action game benchmark of choice is Battlefield 3, DICE’s 2011 multiplayer military shooter. Its ability to pose a significant challenge to GPUs has been dulled some by time and drivers at the high-end, but it’s still a challenge for more entry-level GPUs such as the iGPUs found on Intel and AMD's latest parts. Our goal here is to crack 60fps in our benchmark, as our rule of thumb based on experience is that multiplayer framerates in intense firefights will bottom out at roughly half our benchmark average, so hitting medium-high framerates here is not necessarily high enough.
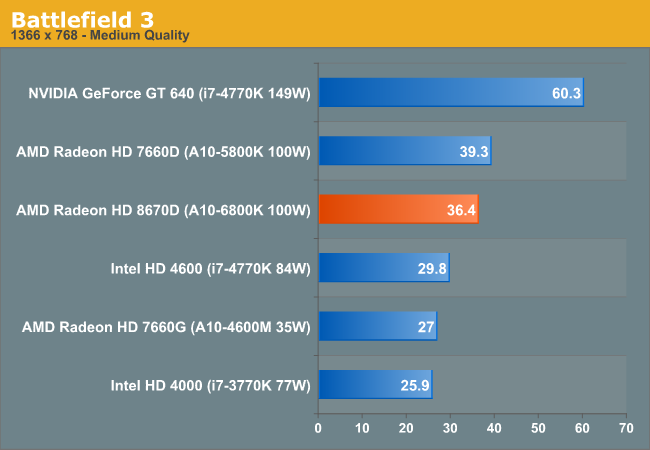
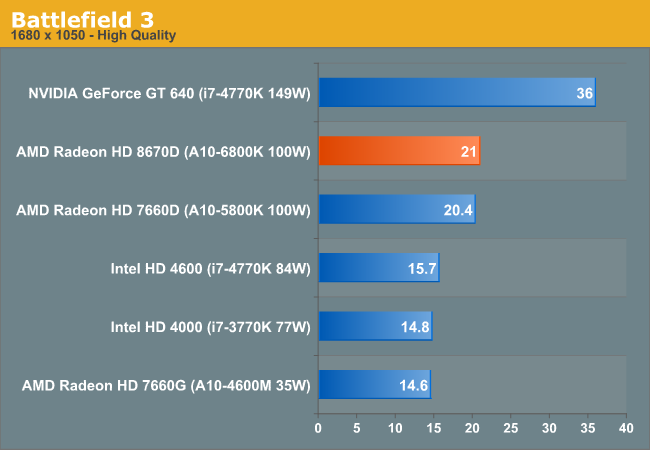
Richland's performance in Battlefield 3 climbs around 30% over the HD 4600 regardless of quality/resolution.
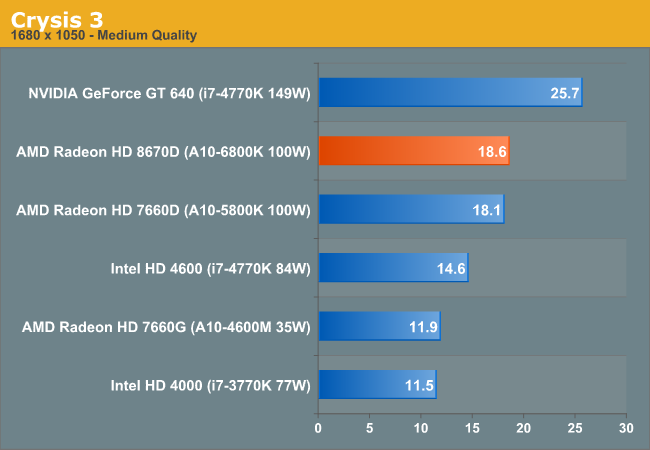
Crysis 3
With Crysis 3, Crytek has gone back to trying to kill computers, taking back the “most punishing game” title in our benchmark suite. Only in a handful of setups can we even run Crysis 3 at its highest (Very High) settings, and the situation isn't too much better for entry-level GPUs at its lowest quality setting. In any case Crysis 1 was an excellent template for the kind of performance required to drive games for the next few years, and Crysis 3 looks to be much the same for 2013.
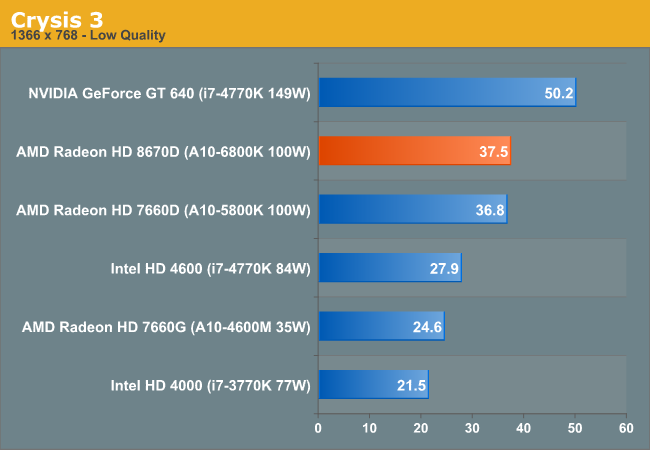
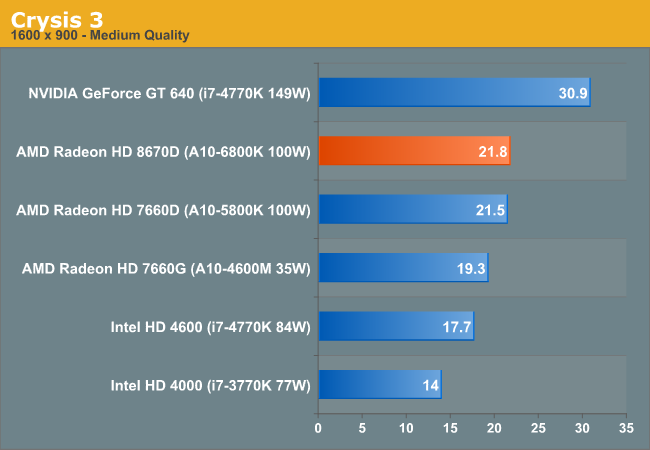
Crysis is another benchmark where we see an increase in performance in the low 30% range.
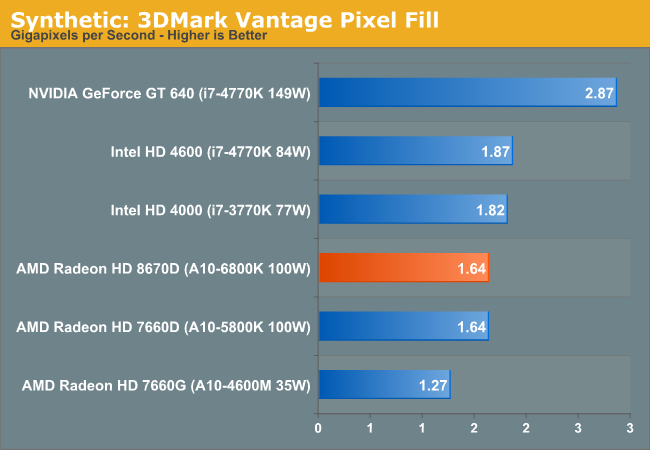
Synthetics
Our synthetic benchmarks can sometimes tell us a lot about what an architecture is capable of. We'll turn to 3DMark Vantage first to stress ROP and texel rates.
Moving on, we have our 3DMark Vantage texture fillrate test, which does for texels and texture mapping units what the previous test does for ROPs.
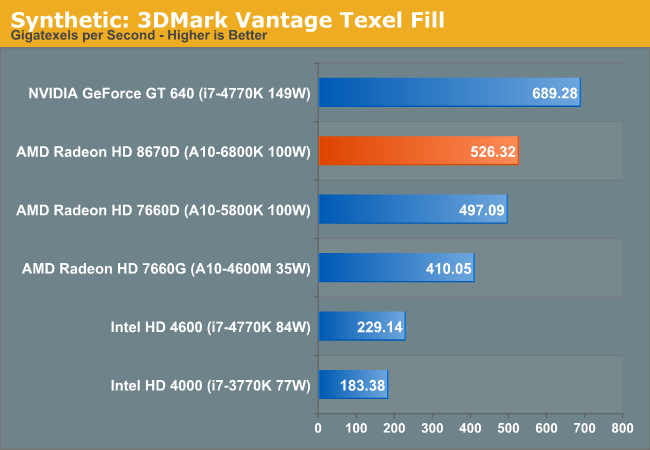
Haswell could use some extra texture hardware, here Richland delivers more than 2x the peak textured fill rate of Haswell GT2.
Finally we’ll take a quick look at tessellation performance with TessMark.
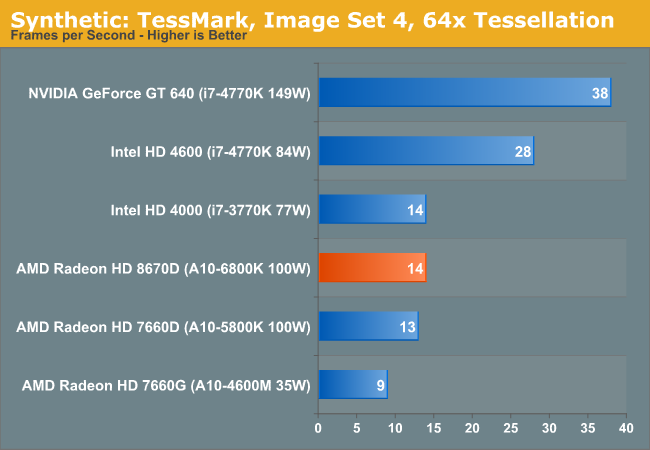
As we saw in our Iris Pro review, Hawell's tessellation performance is surprisingly good.
Compute
As always we'll start with our DirectCompute game example, Civilization V, which uses DirectCompute to decompress textures on the fly. Civ V includes a sub-benchmark that exclusively tests the speed of their texture decompression algorithm by repeatedly decompressing the textures required for one of the game’s leader scenes. While DirectCompute is used in many games, this is one of the only games with a benchmark that can isolate the use of DirectCompute and its resulting performance.
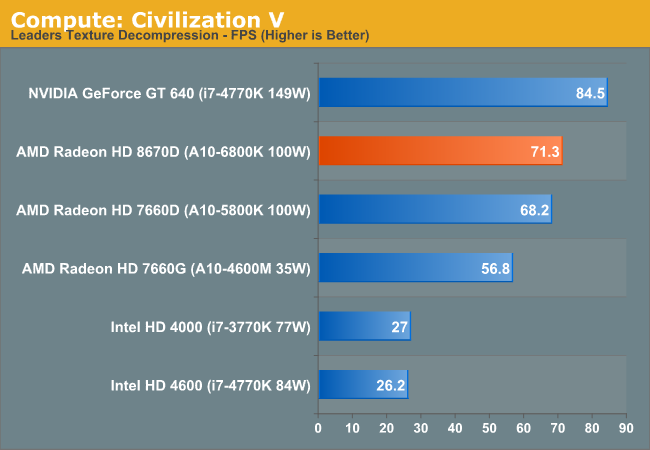
AMD does extremely well in our sole DirectCompute test, outperforming Intel's latest desktop graphics solution by a huge margin.
Our next benchmark is LuxMark2.0, the official benchmark of SmallLuxGPU 2.0. SmallLuxGPU is an OpenCL accelerated ray tracer that is part of the larger LuxRender suite. Ray tracing has become a stronghold for GPUs in recent years as ray tracing maps well to GPU pipelines, allowing artists to render scenes much more quickly than with CPUs alone.
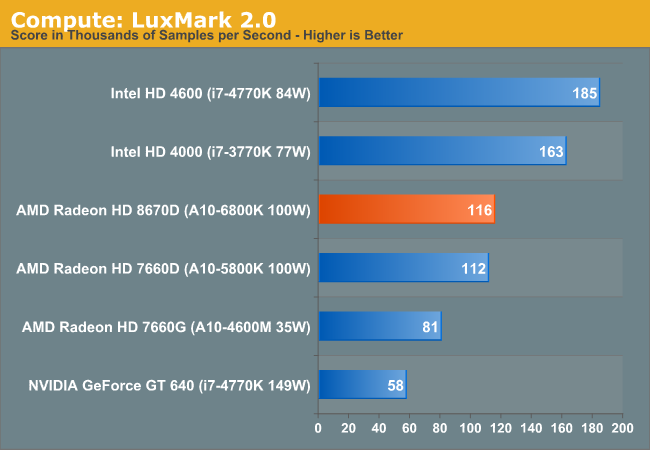
Haswell GT2's OpenCL performance can be very good, which is what we're seeing here. HD 4600 ends up being almost 60% faster than the Radeon HD 8670D.
Our 3rd benchmark set comes from CLBenchmark 1.1. CLBenchmark contains a number of subtests; we’re focusing on the most practical of them, the computer vision test and the fluid simulation test. The former being a useful proxy for computer imaging tasks where systems are required to parse images and identify features (e.g. humans), while fluid simulations are common in professional graphics work and games alike.
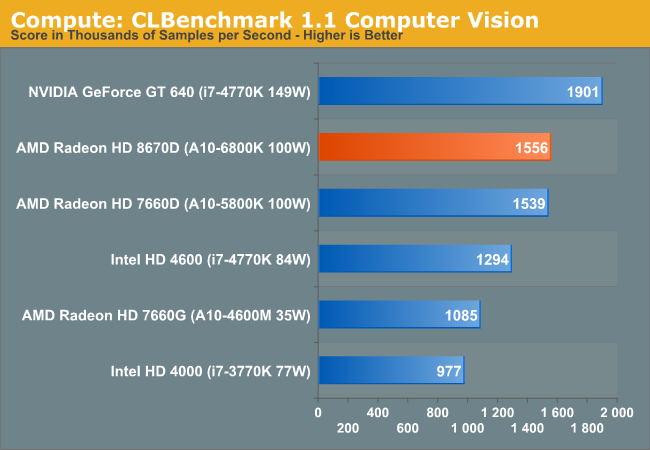
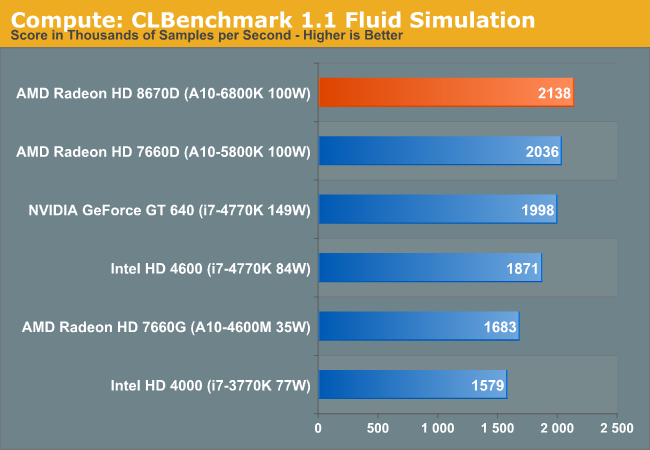
AMD and Intel trade places once again with CLBenchmark. Here, Richland does extremely well.
Our final compute benchmark is Sony Vegas Pro 12, an OpenGL and OpenCL video editing and authoring package. Vegas can use GPUs in a few different ways, the primary uses being to accelerate the video effects and compositing process itself, and in the video encoding step. With video encoding being increasingly offloaded to dedicated DSPs these days we’re focusing on the editing and compositing process, rendering to a low CPU overhead format (XDCAM EX). This specific test comes from Sony, and measures how long it takes to render a video.
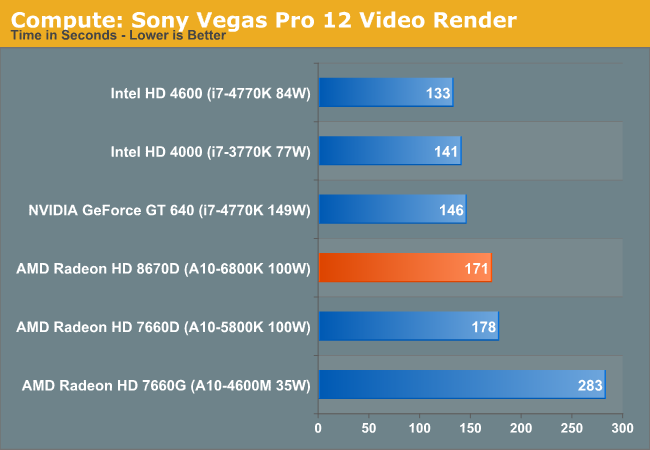
The last compute test goes to Intel, although the two put up a good fight across the entire suite.
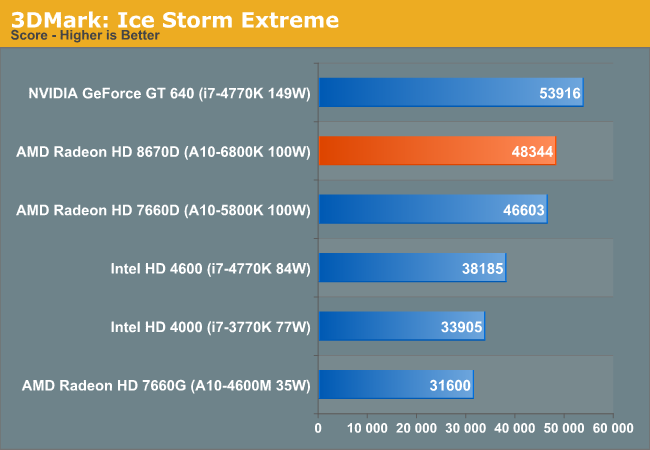
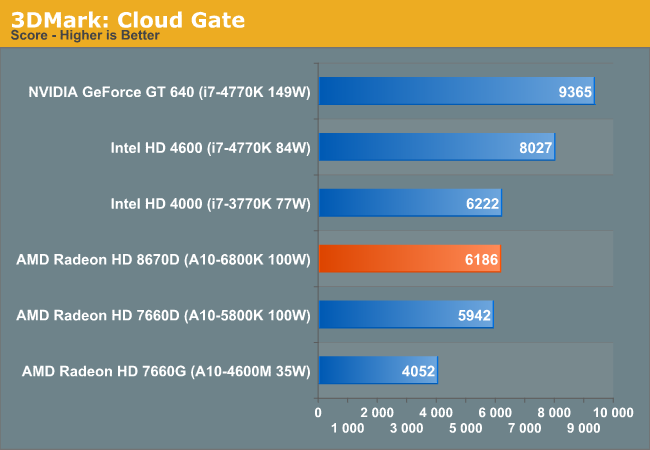
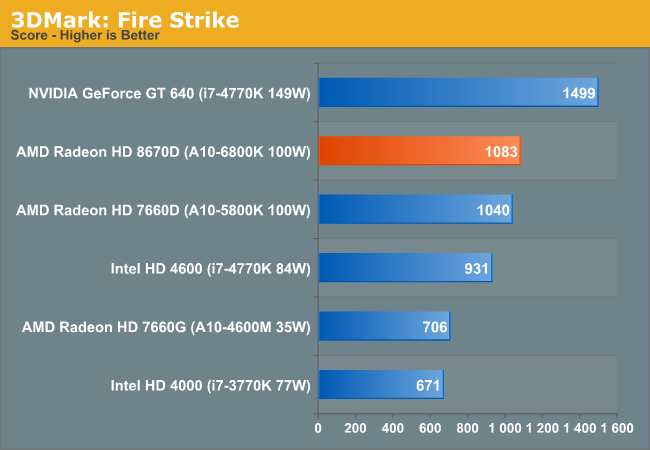
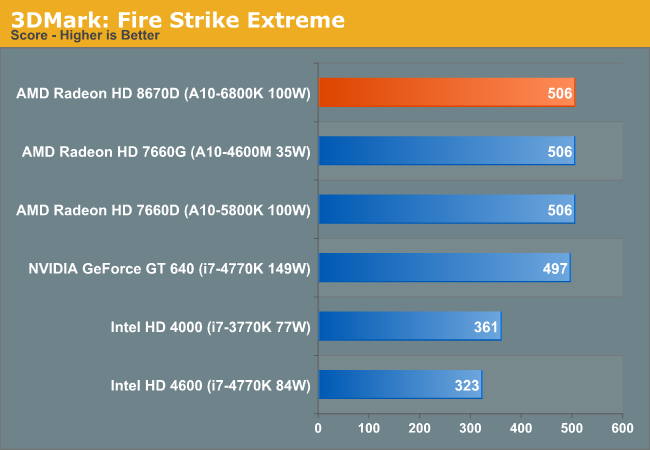
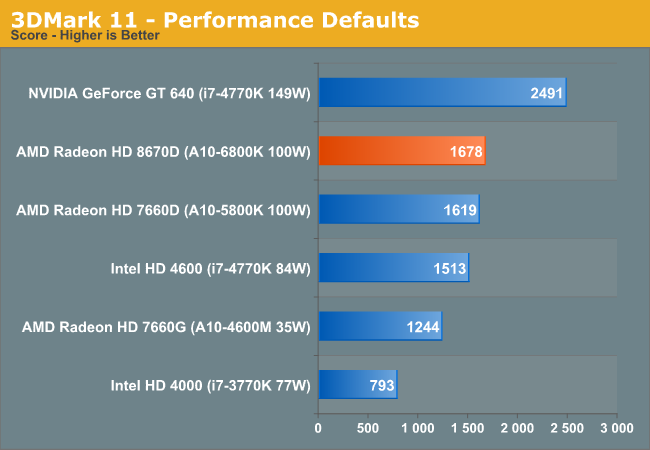
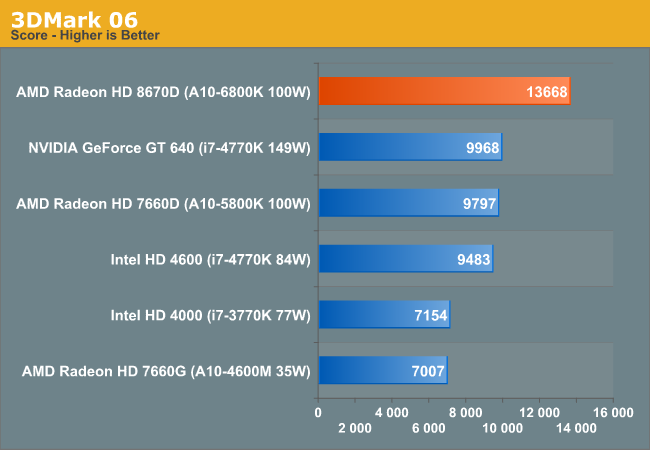
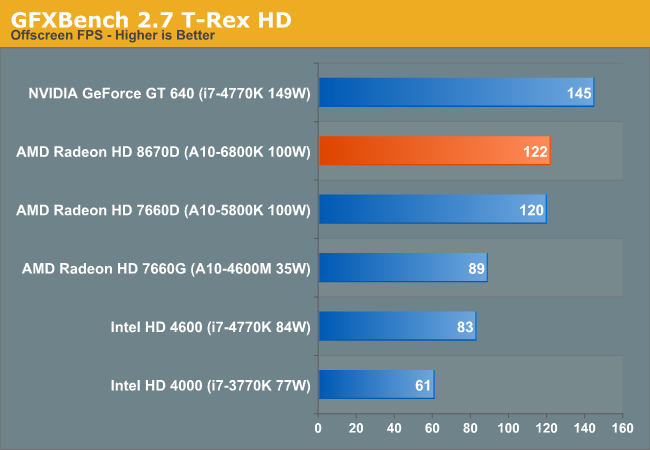
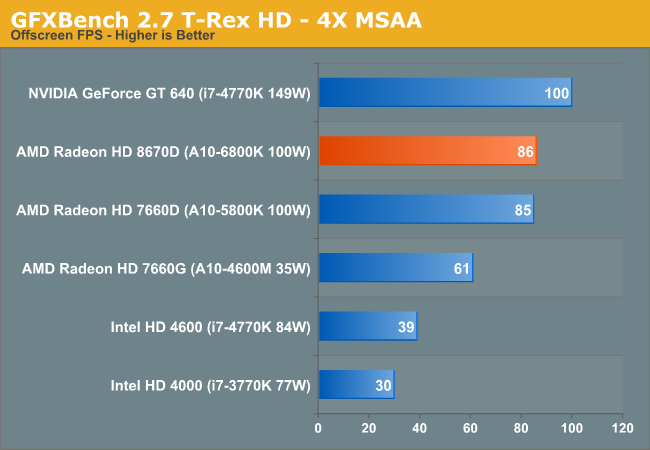
3DMark and GFXBench
Although we don't draw any conclusions based on 3DMark and GFXBench, I ran this data on Richland as well since I had Trinity, Ivy Bridge and Haswell comparison points.

Final Words
Despite Haswell's arrival on the desktop, AMD is in no trouble at all from a graphics perspective. At the high end, Richland maintains a 17 - 50% GPU performance advantage (~30% on average) over Intel's HD 4600 (Haswell GT2). All things equal, even Trinity is good enough to maintain this performance advantage - a clear downside of Intel not bringing its Iris or Iris Pro graphics to any socketed desktop parts.
While there isn't a substantial increase in GPU performance between Richland and Trinity, AMD's GPU performance lead over Ivy Bridge was big enough to withstand Haswell's arrival. Note that although we're comparing performance to Haswell here, Richland exists in a lower price bracket. If you want the best desktop solution with processor graphics, AMD remains your best bet.
Later this year we'll see the arrival of Kaveri, which will be AMD's true response to Iris as well as its first HSA enabled APU. For as long as I can remember, integrated graphics was one of the most frustrating aspects of PC hardware to test. It looks like that's finally about to change.


